. 2018 May 3;9(1):1788.
doi: 10.1038/s41467-018-04062-6.

Population coding of conditional probability distributions in dorsal premotor cortex

Affiliations

Population coding of conditional probability distributions in dorsal premotor cortex

Joshua I Glaser et al. Nat Commun. .

Abstract

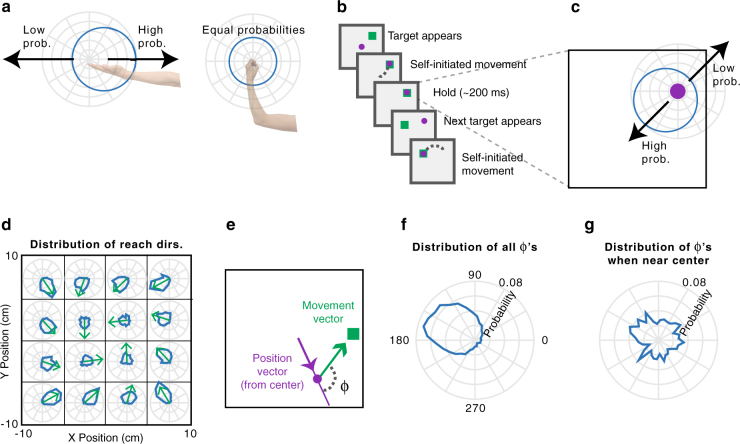
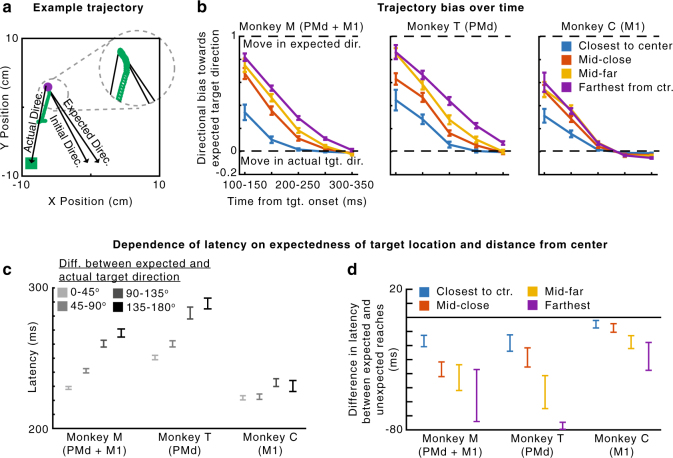
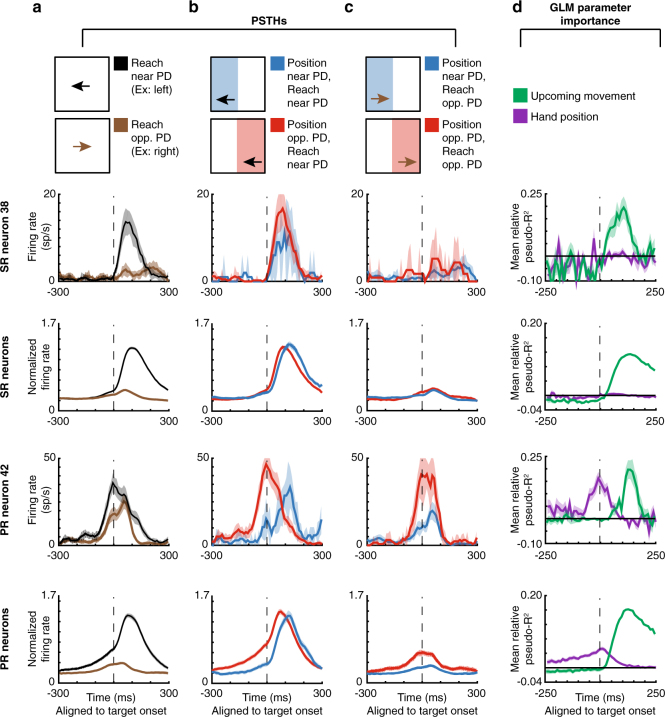
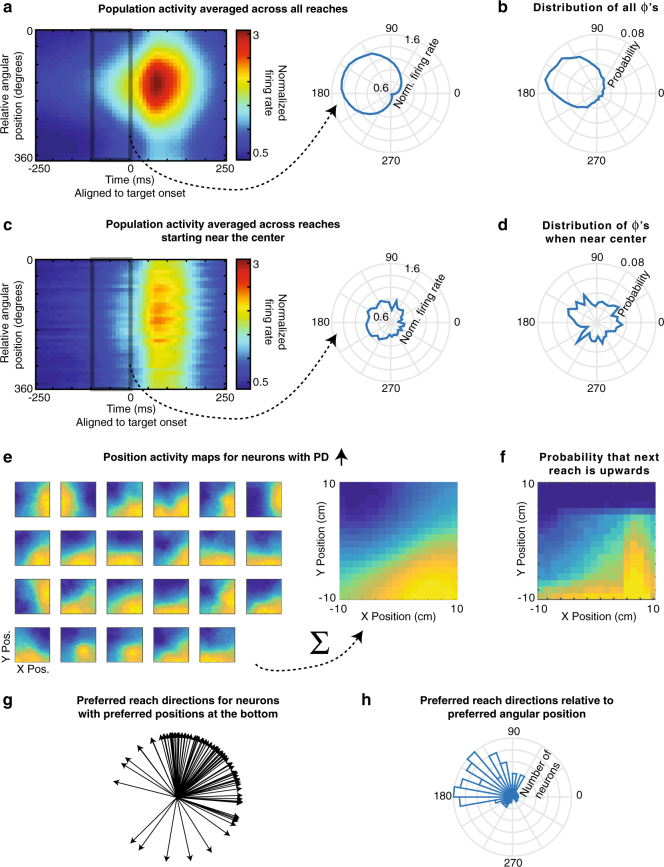
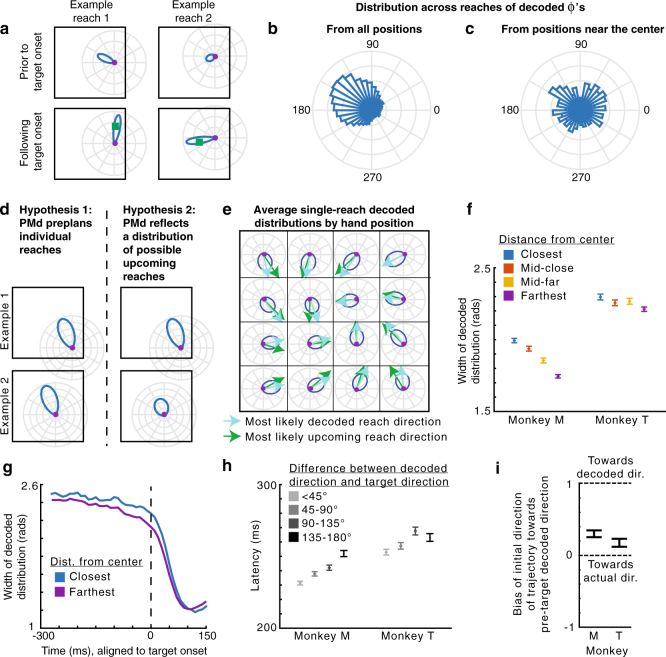
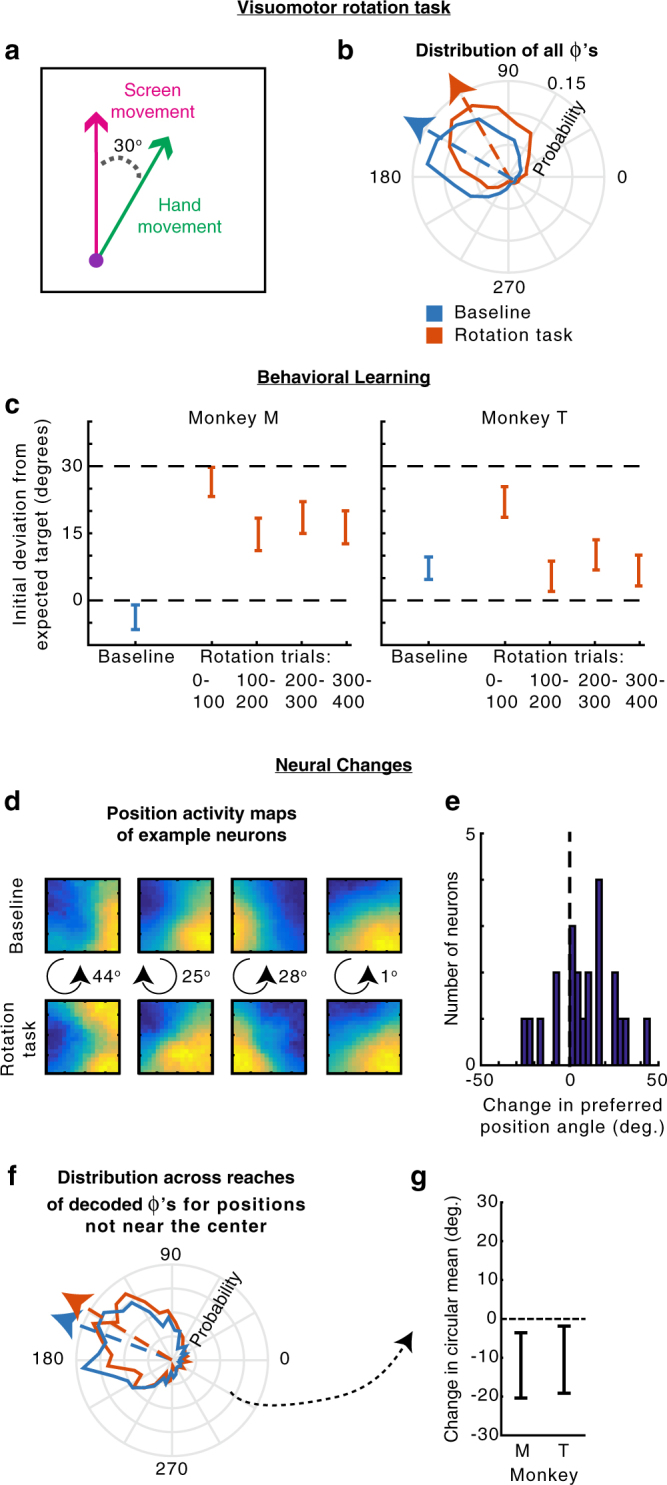
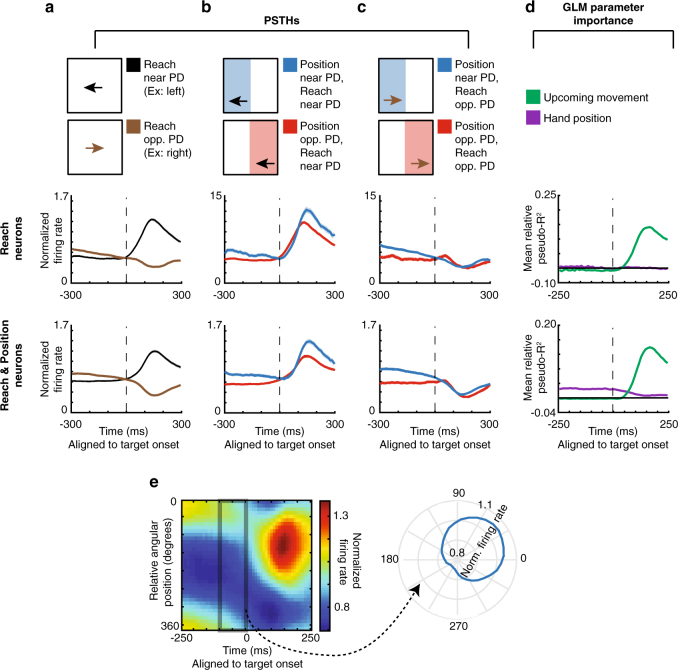
Our bodies and the environment constrain our movements. For example, when our arm is fully outstretched, we cannot extend it further. More generally, the distribution of possible movements is conditioned on the state of our bodies in the environment, which is constantly changing. However, little is known about how the brain represents such distributions, and uses them in movement planning. Here, we record from dorsal premotor cortex (PMd) and primary motor cortex (M1) while monkeys reach to randomly placed targets. The hand's position within the workspace creates probability distributions of possible upcoming targets, which affect movement trajectories and latencies. PMd, but not M1, neurons have increased activity when the monkey's hand position makes it likely the upcoming movement will be in the neurons' preferred directions. Across the population, PMd activity represents probability distributions of individual upcoming reaches, which depend on rapidly changing information about the body's state in the environment.


Conflict of interest statement

The authors declare no competing interests.

Figures

Fig. 1
Fig. 1
Experimental design and statistics. a If the arm is outstretched, the only possible arm movements are back toward the body (left). In other limb postures, it may be possible to move the arm in any direction (right). In blue, circular probability distributions are shown for the possible upcoming movements based on the current arm posture. b Experimental design. The monkey makes sequences of four reaches, briefly holding within each target box before the next target appears. c The current hand position limits the range of possible locations of the next target, due to the borders of the workspace and target presentation algorithm. d The probability distributions of upcoming reach directions (blue) from different areas of space (x and y divided into quartiles). Green arrows point toward the circular means of the distributions. e Φ is the angular difference between the upcoming movement vector (the vector that brings the hand to the target) and the current angular hand position (relative to the center of the workspace). f The probability distribution of Φ’s from all hand positions. g The probability distribution of Φ’s from initial hand positions within 2 cm of the center of the workspace
Fig. 2
Fig. 2
Behavior. a An example trajectory. The initial direction of the reach (green) starts toward the expected direction of the target, given the current hand position. It later moves in the actual direction of the target. The inset shows an enlarged view of the beginning of the reach. b The median bias of the trajectory over time. A bias of 1 signifies that the direction of the trajectory is toward the expected target direction, while a bias of 0 signifies that the direction of the trajectory is toward the actual target direction. Negative biases signify movement away from the expected direction. Different traces are shown for hand positions at varying distances from the center of the workspace. Error bars are standard errors of the median. c The mean latency of reaches as a function of the angular difference between the actual and expected target directions. d The difference in mean latency between expected and unexpected reaches (expected minus unexpected), depending on the hand’s distance from the center. “Expected” reaches are those that had an angular difference between the actual and expected target directions of less than 60°. “Unexpected” reaches had an angular difference of more than 120°. In panels c and d, error bars represent SEMs. In panels b and d, distances from the center are divided as follows: “closest” is 0–20% of distances from the center, “mid-close” is 20–40%, “mid-far” is 40–60%, and “farthest” is 60–100%. We used these divisions for plotting, rather than standard quartiles, to ensure that there were “unexpected” reaches in each bin. When using standard quartiles, there were no “unexpected” reaches for some monkeys in the last quartile (greatest 25% of distances from the center) because when very far from the center, the next target cannot be in an unexpected direction (farther away from the center)
Fig. 3
Fig. 3
PMd PSTHs and GLM results. First row: A selected-response (SR) neuron. Second row: Normalized averages of SR neurons. Third row: A potential-response (PR) neuron. Bottom row: Normalized averages of PR neurons. ac Peristimulus time histograms (PSTHs) for PMd neurons, aligned to target onset. Shaded areas represent SEMs. a PSTHs of reaches near the preferred direction (PD; black) vs. opposite the PD (brown). b PSTHs of reaches near the PD, with a starting hand position near the PD (lower probability of moving near the PD; blue) vs. a position opposite the PD (higher probability of moving near the PD; red). c PSTHs of reaches opposite the PD, with a starting hand position near the PD (blue) vs. a position opposite the PD (red). d We utilized a generalized linear model (GLM) to control for confounds in the PSTHs, including different distributions of starting positions, upcoming movements, and previous movements. Here, we show the importance of parameters in the GLM, across time, for PMd neurons. We show mean relative pseudo-R2 over time, of the upcoming movement (green) and hand position (purple) covariates. For the 2nd and bottom row, shaded areas represent SEMs across neurons. For individual neurons, shaded areas represent the standard deviation across bootstraps
Fig. 4
Fig. 4
The PMd population jointly represents the distribution of upcoming reaches. a Left: The average normalized firing rate of all PR neurons, over time, as a function of relative angular hand position. For each neuron, the relative angular position is the preferred direction of the neuron minus the angular hand position. Activity is normalized and averaged across all PR neurons. Right: The average normalized firing rate in the 100 ms prior to target onset, plotted as a function of the relative angular hand position. b The distribution of upcoming movement directions relative to angular hand positions. This is duplicated from Fig. 1f for easy comparison with panel a. c, d Same as panels a and b, but for only for reaches starting near (within 2 cm of) the center. Note that panel d is duplicated from Fig. 1g. Left: Position activity maps for example PR neurons with preferred movement directions that are oriented upwards. The position activity maps show the neurons’ activity as a function of hand position (blue is low; yellow is high) from −100 to 50 ms surrounding target onset. Right: The sum of the position maps for all PR neurons, when their preferred directions are oriented upwards. f A map showing the probability that the next movement will be upwards, as a function of initial hand position. g Preferred reach directions for all PR neurons, when space is rotated so that their preferred hand angular position is oriented to be at the bottom (270°). h A histogram of preferred reach directions of all PR neurons relative to their preferred angular hand position (the reach PD minus the preferred angular hand position)
Fig. 5
Fig. 5
PMd population activity represents the distribution of upcoming movements—single reach decoding. a The distribution of decoded reach directions (blue) from the population of PMd neurons for two example reaches (left and right), before and after target onset (top and bottom). The purple circle is the current hand position, and the green square is the target location. b The distribution of decoded Φ’s across all reaches. The decoded Φ is the pre-target decoded reach direction relative to the hand’s angular position (same as Φ from Fig. 1, except with decoded direction instead of actual reach direction). c The distribution of decoded Φ’s across reaches starting within 2 cm of the center. d The predictions of two hypotheses (left and right), shown for two different hand positions (example 1 vs. example 2). e Average pre-target decoded reach direction distributions as a function of hand position. The displayed distributions have the average width and peak angle of all decoded distributions from hand positions within the grid square. Light blue arrows point toward the circular means of these distributions. Green arrows point toward the most likely reach direction (from Fig. 1d). f The full width at half maximum of the pre-target decoded distribution as a function of hand distance from the center of the workspace. Distances from the center are binned as in Fig. 2. Error bars are SEMs. g Width of the decoded distributions over time, for starting positions that are closest (blue) and farthest (purple) from the center. h Latency of the reach as a function of the angular difference between the pre-target decoded direction and the actual target direction. Error bars are SEMs. i The bias of the initial trajectory of the reach (100–150 ms from target onset) toward the pre-target decoded direction. A bias of 1 signifies the initial trajectory is toward the decoded direction, while a bias of 0 is toward the actual target direction. Negative values are away from the decoded direction. 95% confidence intervals, computed via bootstrapping, are shown
Fig. 6
Fig. 6
Visuomotor rotation control task. a The visuomotor rotation (VR) task. Movements on the screen (in the workspace) are rotated 30° counterclockwise relative to the hand movement. b The distribution of hand movements relative to the angular hand position in the workspace, i.e., Φ’s, for the baseline task (blue) and the VR task (orange). Arrows point toward the circular means of the distributions. c The difference between the initial reach direction (100–150 ms from target onset) and the expected movement direction during the baseline task (blue) and different periods during the VR task (orange). The expected movement direction was the most likely upcoming movement direction given the current workspace position and movement statistics (panel b). Positive values mean the initial reach direction was counterclockwise of the expected target direction, meaning the monkey had not adapted. Error bars represent the circular SEM. d Position activity maps (activity as a function of position in the workspace) of example PR neurons in the baseline (top) and VR task in the second 2/3 of trials (bottom), as in Fig. 4c. In the middle, we show the direction (clockwise or counterclockwise) and magnitude of change of the preferred angular position. e The change in preferred angular position of all PR neurons (VR minus baseline). Positive means a counterclockwise shift. f The distribution of pre-target decoded reach directions relative to the hand’s angular position (decoded Φ’s) for positions not near the center (greater than the median distance). Decoding from the VR task used the second 2/3 of trials. g The difference between the circular mean of the distributions of decoded Φ’s in panel f, between the baseline and VR tasks (VR minus baseline). Error bars represent 95% confidence intervals from bootstrapping
Fig. 7
Fig. 7
M1 does not reflect the probability of upcoming movements. ad PSTHs and GLM results for M1 neurons. Columns have the same schematics as Fig. 3. First row of PSTHs: Normalized averages of reach neurons, defined as those neurons significant for movement during the late period, but not position in the early period of the GLM. This was the same criteria as for SR neurons in PMd. Second row: Normalized averages of reach & position neurons, defined as those neurons significant for movement during the late period, and position in the early period of the GLM. This was the same criteria as for PR neurons in PMd. Note that we did not use the same “SR/PR” nomenclature as PMd, because there was no evidence in the PSTHs of M1 neurons that position was used to represent potential upcoming movements. e Same schematic as Fig. 4a, but for M1 reach & position neurons. Left: The normalized average firing rate, as a function of time and relative angular position. Activity is averaged across all reach & position neurons. Right: The normalized average firing rate in the 100 ms prior to target onset, plotted as a function of the relative angular hand position

Comment in

References

    1. Basso MA, Wurtz RH. Modulation of neuronal activity in superior colliculus by changes in target probability. J. Neurosci. 1998;18:7519–7534. doi: 10.1523/JNEUROSCI.18-18-07519.1998. - DOI - PMC - PubMed
    1. Dorris MC, Munoz DP. Saccadic probability influences motor preparation signals and time to saccadic initiation. J. Neurosci. 1998;18:7015–7026. doi: 10.1523/JNEUROSCI.18-17-07015.1998. - DOI - PMC - PubMed
    1. Yang T, Shadlen MN. Probabilistic reasoning by neurons. Nature. 2007;447:1075–1080. doi: 10.1038/nature05852. - DOI - PubMed
    1. Dekleva BM, Ramkumar P, Wanda PA, Kording KP, Miller LE. Uncertainty leads to persistent effects on reach representations in dorsal premotor cortex. eLife. 2016;5:e14316. doi: 10.7554/eLife.14316. - DOI - PMC - PubMed
    1. Haith AM, Huberdeau DM, Krakauer JW. Hedging your bets: intermediate movements as optimal behavior in the context of an incomplete decision. PLoS Comput. Biol. 2015;11:e1004171. doi: 10.1371/journal.pcbi.1004171. - DOI - PMC - PubMed

Publication types

LinkOut - more resources