

Applications of Bayesian network models in predicting types of hematological malignancies
- PMID: 29725024
- PMCID: PMC5934387
- DOI: 10.1038/s41598-018-24758-5
Applications of Bayesian network models in predicting types of hematological malignancies
Abstract
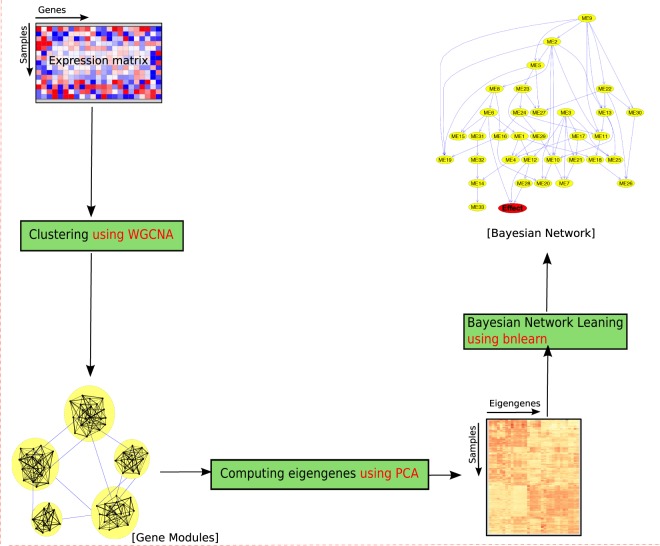
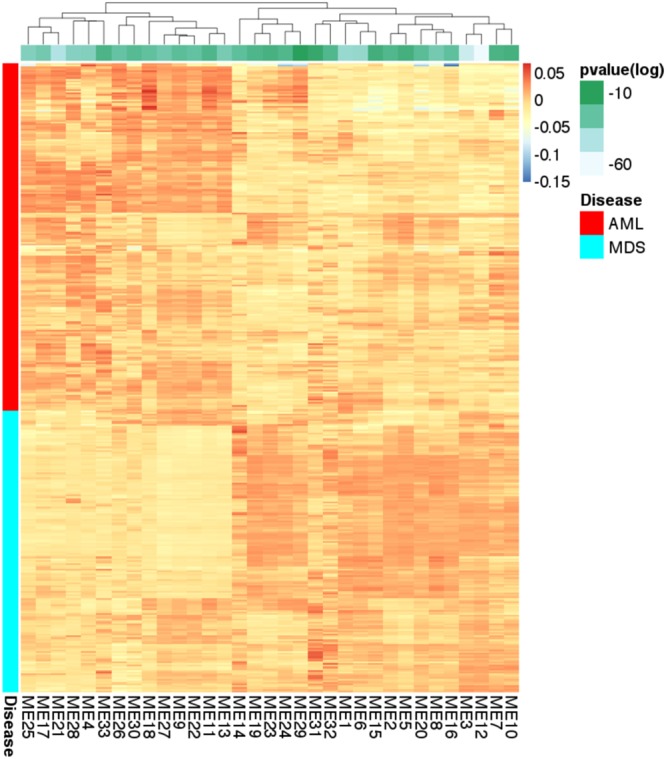
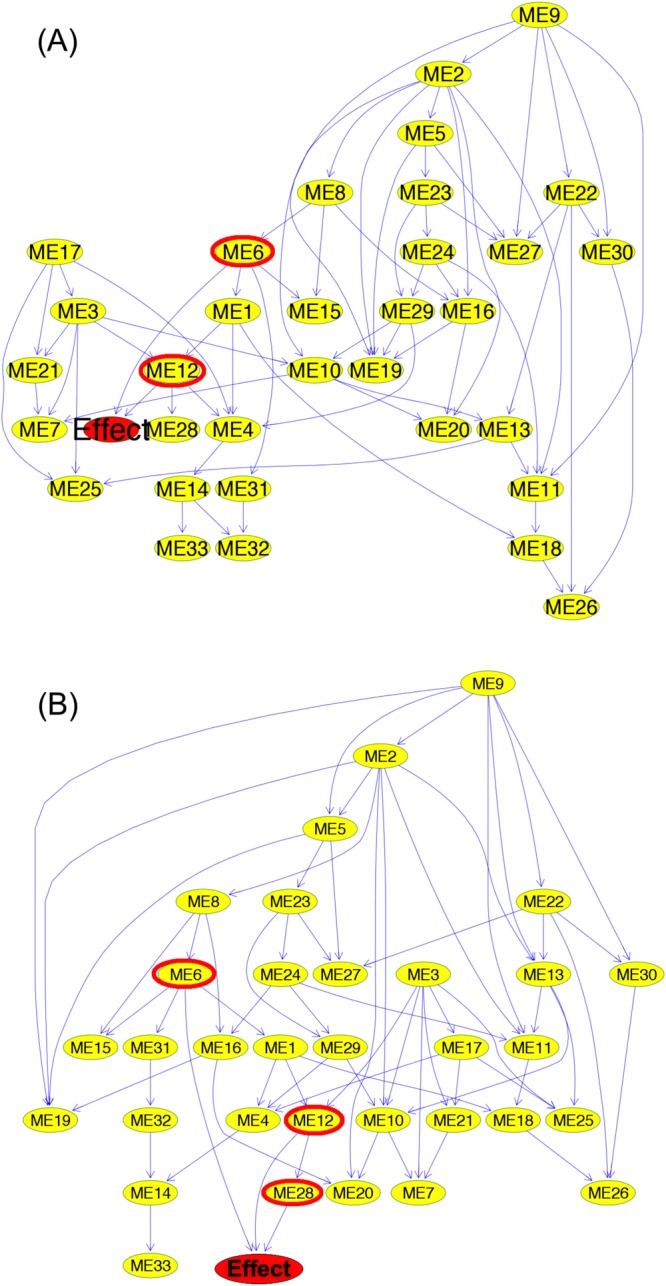
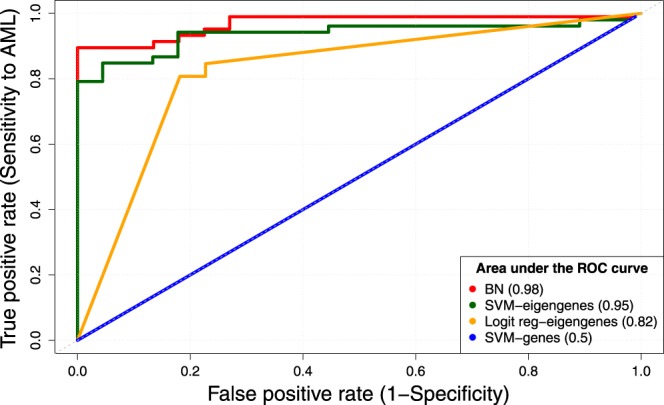
Network analysis is the preferred approach for the detection of subtle but coordinated changes in expression of an interacting and related set of genes. We introduce a novel method based on the analyses of coexpression networks and Bayesian networks, and we use this new method to classify two types of hematological malignancies; namely, acute myeloid leukemia (AML) and myelodysplastic syndrome (MDS). Our classifier has an accuracy of 93%, a precision of 98%, and a recall of 90% on the training dataset (n = 366); which outperforms the results reported by other scholars on the same dataset. Although our training dataset consists of microarray data, our model has a remarkable performance on the RNA-Seq test dataset (n = 74, accuracy = 89%, precision = 88%, recall = 98%), which confirms that eigengenes are robust with respect to expression profiling technology. These signatures are useful in classification and correctly predicting the diagnosis. They might also provide valuable information about the underlying biology of diseases. Our network analysis approach is generalizable and can be useful for classifying other diseases based on gene expression profiles. Our previously published Pigengene package is publicly available through Bioconductor, which can be used to conveniently fit a Bayesian network to gene expression data.
Conflict of interest statement
The authors declare no competing interests.
Figures
References
-
- Jemal A, Thomas A, Murray T, Thun M. Cancer statistics, 2002. CA: a cancer journal for clinicians. 2002;52:23–47. - PubMed
-
- Shi J, et al. Transformation of myelodysplastic syndromes into acute myeloid leukemias. Chinese Medical Journal. 2004;117:963–967. - PubMed
-
- Wang L, Gao C, Chen B. [research progress on mechanism of mds transformation into aml] Zhongguo shi yan xue ye xue za zhi/Zhongguo bing li sheng li xue hui= J. of experimental hematology/Chinese Assoc. of Pathophysiol. 2011;19:254–259. - PubMed
Publication types
MeSH terms
Grants and funding
LinkOut - more resources
Full Text Sources
Other Literature Sources
Medical
Research Materials
Miscellaneous
