. 2018 May 3;8(1):6971.
doi: 10.1038/s41598-018-25202-4.

Cost-effective rapid prototyping and assembly of poly(methyl methacrylate) microfluidic devices

Affiliations

Cost-effective rapid prototyping and assembly of poly(methyl methacrylate) microfluidic devices

Carlos Matellan et al. Sci Rep. .

Abstract

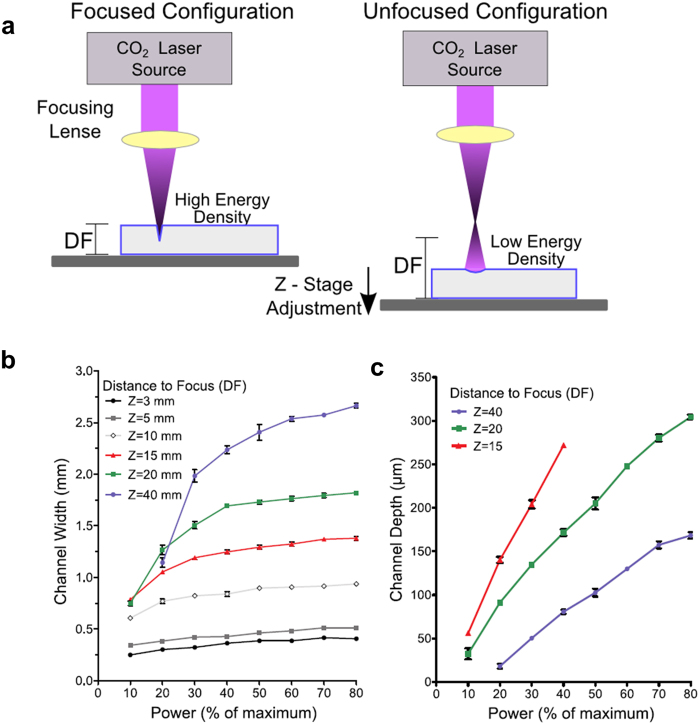
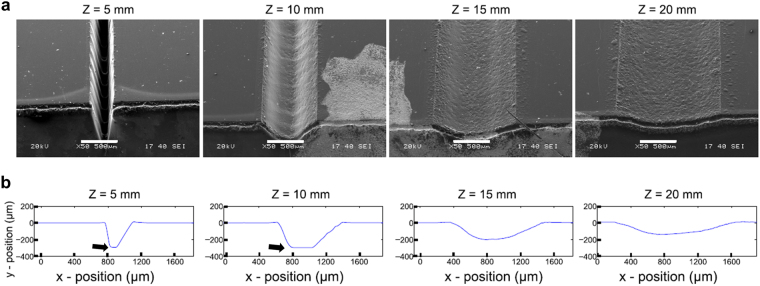
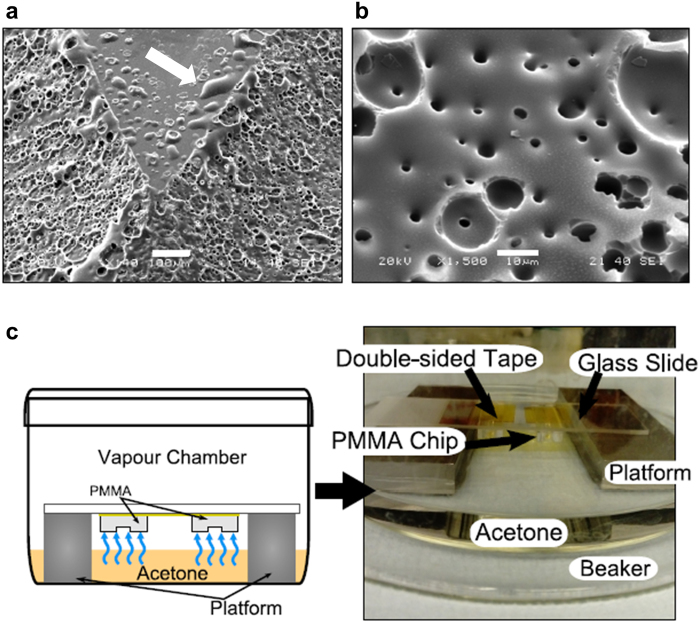
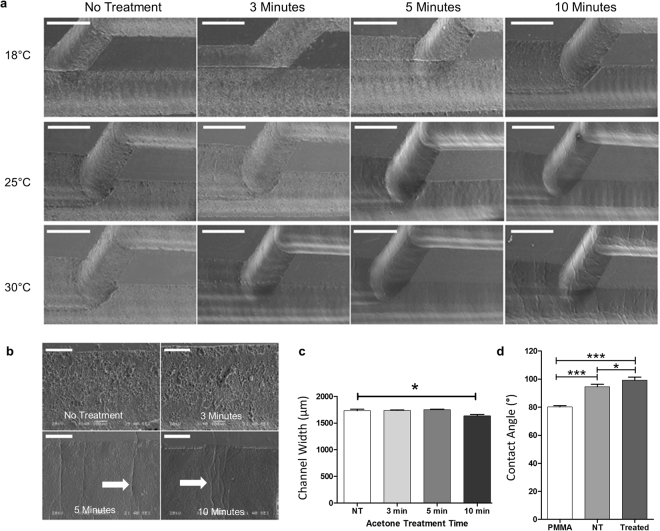
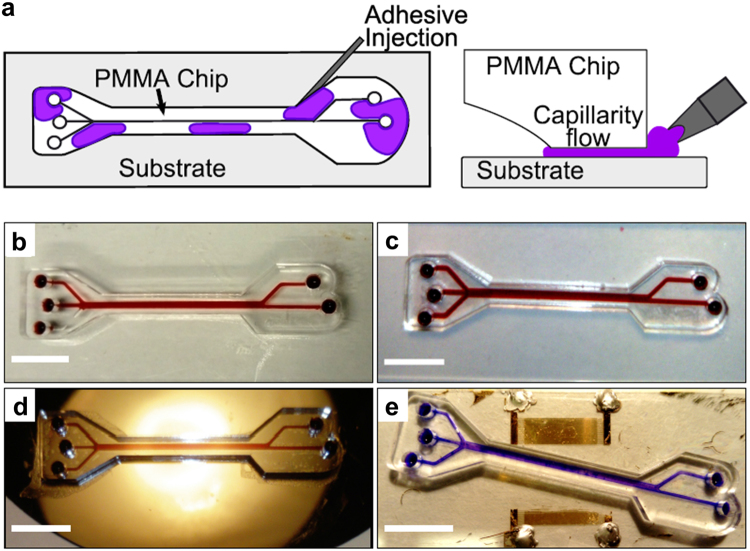
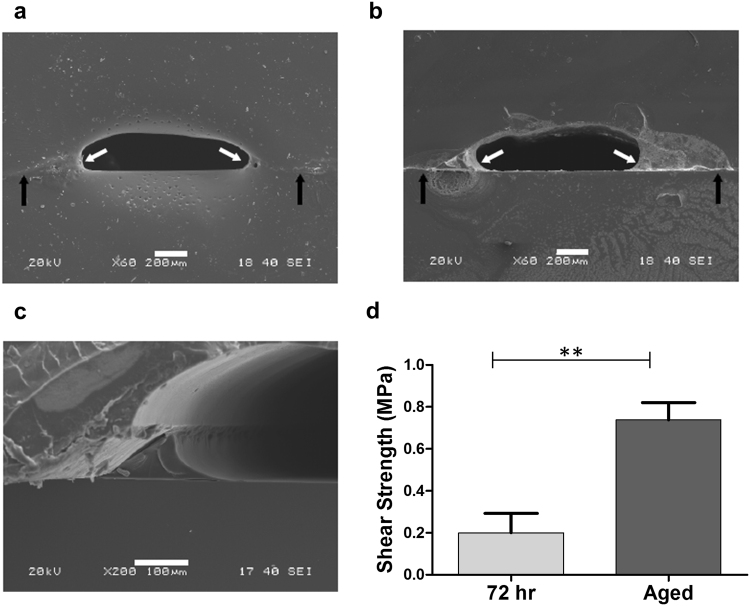
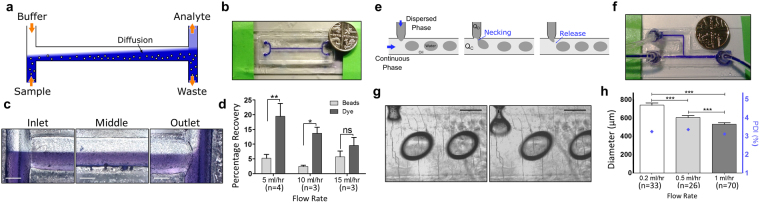
The difficulty in translating conventional microfluidics from laboratory prototypes to commercial products has shifted research efforts towards thermoplastic materials for their higher translational potential and amenability to industrial manufacturing. Here, we present an accessible method to fabricate and assemble polymethyl methacrylate (PMMA) microfluidic devices in a "mask-less" and cost-effective manner that can be applied to manufacture a wide range of designs due to its versatility. Laser micromachining offers high flexibility in channel dimensions and morphology by controlling the laser properties, while our two-step surface treatment based on exposure to acetone vapour and low-temperature annealing enables improvement of the surface quality without deformation of the device. Finally, we demonstrate a capillarity-driven adhesive delivery bonding method that can produce an effective seal between PMMA devices and a variety of substrates, including glass, silicon and LiNbO3. We illustrate the potential of this technique with two microfluidic devices, an H-filter and a droplet generator. The technique proposed here offers a low entry barrier for the rapid prototyping of thermoplastic microfluidics, enabling iterative design for laboratories without access to conventional microfabrication equipment.


Conflict of interest statement

The authors declare no competing interests.

Figures

Figure 1
Figure 1
Characterisation of the laser ablation. (a) Laser ablation process in the focused and unfocused configuration. Increasing the distance between the focal point and the surface of the material causes the laser energy to be spread over a wider area, resulting in lower energy density. Adjustments of the stage and laser source enable control of the laser. Channel width (b) and depth (c) of channels engraved in PMMA resulting from different combinations of laser power (as percentage of the maximum 30 W) and distance-to-focus (3, 5, 10, 15, 20 and 40 mm) as extracted from profilometric analysis (mean ± SD, n = 3).
Figure 2
Figure 2
Effect of distance-to-focus on channel geometry. Cross-section and morphology of microfluidic channels laser-engraved (30% power, 10% speed) at varying distance-to-focus (Z = 5, 10, 15 and 20 mm respectively). (a) Scanning electron microscopy of the engraved channels (tilt 45°) reveals high aspect ratio (deep and narrow) channels at low distances, and low aspect ratio (shallow and wide) channels at higher distances. Scale bar: 500 μm. (b) Profilometer analysis of the microfluidic channels reveals changes in cross-section (from a narrow gaussian morphology to semicircular) with increasing level of laser unfocusing. Axes show real aspect ratio. For the 5 mm and 10 mm FD channels, the stylus profilometer reaches the limit of its measurement range, resulting in a flat profile curve (black arrows).
Figure 3
Figure 3
Surface Roughness and treatment setup. (a) Surface defects appearing on an engraved flow splitter. Material residue from the ablation process deposits on flat surfaces (white arrow) and can cause leaking. Scale bar: 100 μm. (b) Detail of the microcavities and pores formed during ablation of the surface of the channel. Scale bar: 10 μm. (c) Acetone vapour treatment chamber setup. The engraved PPMA channels are exposed to the acetone vapour as it evaporates from a reservoir, while a metal platform prevents direct contact with the liquid solvent.
Figure 4
Figure 4
Surface treatment of engraved channels. (a) Scanning electron microscopy of channel surface for PMMA laser-machined devices treated with acetone vapor for 3, 5 and 10 minutes at 18 °C, 25 °C or 30 °C, followed by thermal treatment at 70 °C for 20 minutes, as compared to samples with no treatment. Scanning electron micrographs reveal changes in the surface roughness and presence of microcavities and other defects. Scale bar: 1000 μm. (b) Detail of channel walls after acetone vapour exposure for 3, 5 and 10 minutes at 25 °C. Cracks can be observed on the surface (white arrow). Scale bar: 200 μm. (c) Changes in channel width after exposure to acetone vapour at 25 °C for different times followed by thermal treatment (20 minutes, 70 °C for all samples). Channel width was analysed from scanning electron micrographs. Data analysed by one-way ANOVA (mean ± s.e.m, n = 3, *p < 0.05). (d) Contact angle measurements for bare PMMA, and laser-cut PMMA without treatment (NT) and after acetone-assisted thermal treatment. (*p < 0.05, ***p < 0.001). Data analysed by one-way ANOVA (mean ± SD, n = 3) with Tukey post-hoc test.
Figure 5
Figure 5
Capillarity-assisted adhesive bonding. (a) Schematic of the adhesive delivery method. The adhesive mix is injected into the interstitial space between the chip and the substrate, and capillarity forces drive the flow of the adhesive throughout the bonding surfaces without flooding the channels. (be) PMMA microfluidic devices adhesively-bonded via capillarity-assisted adhesive delivery on PMMA (b) glass (c) silicon (d) and LiNbO3 (e) substrates. Scale bar: 1 cm.
Figure 6
Figure 6
Characterisation of the adhesive bond. Transverse section PMMA chips bonded to PMMA (a) and glass (b) substrates analysed by scanning electron microscopy. A thin layer of adhesive can be observed at the interface between the two materials (black arrows). An accumulation of adhesive at the edges of the channel, resulting in an oval cross-section, can also be observed (white arrows). Scale bar: 200 μm. (c) Detail of the accumulation of adhesive at the edges of the channel in a PMMA-Glass substrate. Scale bar: 100 μm. (d) Bond shear strength for PMMA-to-PMMA adhesive bonding via capillarity-assisted adhesive delivery. Samples were allowed to cure for 72 hours or 2 months (aged) before tensile testing. **p < 0.01 (Mean ± SD, n = 3).
Figure 7
Figure 7
Example microfluidic devices. (a) Schematic of the operation of an H-filter. Diffusion dominates mass exchange between parallel streams, enabling size fractioning via flow splitting. (b) PMMA microfluidic H-filter fabricated by laser ablation and capillarity-assisted adhesive bonding. Coin (5 pence) for comparison. (c) Operation of the PMMA H-filter under laminar flow. The bottom stream (sample inlet) contains a blue dye and 20 µm polystyrene beads. The sample and buffer streams remain parallel and split at the outlet, with a fraction of the dye that has diffused to the buffer stream exiting through the analyte outlet. Scale bar: 500 μm. (d) Percentage of the dye and beads contents recovered at the analyte outlet of the H filter at different flow rates (5, 10 and 15 ml hr−1 ). Data analysed by two-way mixed ANOVA (*p < 0.05, **p < 0.01 and ns non-significant) with Bonferroni post-test and shown as mean ± s.e.m. (e) Schematic of the droplet generation process in the T-junction. The interaction between the two immiscible phases causes necking and pinching of the dispersed phase and release into the main channel. (f) PMMA T-junction droplet generator with glued tubing. Coin (5 pence) for comparison. (g) Formation and necking of a water-in-oil droplet at the T junction via dripping regime. Scale bar: 500 µm. (h) Mean droplet diameter and polydispersity index (PDI) for the droplets produced in the T-junction droplet generator at different flow rates: 0.2, 0.5 and 1 ml hr−1 (flow rate ratio between continuous and disperse phases QC/QD  = 1.63 in all cases). Droplet diameter data analysed by one-way ANOVA (***p < 0.001) with Tukey post-hoc test, and shown as mean ± SD.

References

    1. Sackmann EK, Fulton AL, Beebe DJ. The present and future role of microfluidics in biomedical research. Nature. 2014;507:181–189. doi: 10.1038/nature13118. - DOI - PubMed
    1. Mao X, Huang TJ. Microfluidic diagnostics for the developing world. Lab Chip. 2012;12:1412–1416. doi: 10.1039/c2lc90022j. - DOI - PMC - PubMed
    1. Li JM, et al. PMMA microfluidic devices with three-dimensional features for blood cell filtration. J. Micromech. Microeng. 2008;18:095021. doi: 10.1088/0960-1317/18/9/095021. - DOI
    1. Illa X, et al. A cyclo olefin polymer microfluidic chip with integrated gold microelectrodes for aqueous and non-aqueous electrochemistry. Lab Chip. 2010;10:1254–1261. doi: 10.1039/b926737a. - DOI - PubMed
    1. Wang Y, He Q, Dong Y, Chen H. In-channel modification of biosensor electrodes integrated on a polycarbonate microfluidic chip for micro flow-injection amperometric determination of glucose. Sens. Actuator B-Chem. 2010;145:553–560. doi: 10.1016/j.snb.2009.11.068. - DOI

Publication types