. 2018 May 3;8(1):6960.
doi: 10.1038/s41598-018-22298-6.

Glycine N-methyltransferase inhibits aristolochic acid nephropathy by increasing CYP3A44 and decreasing NQO1 expression in female mouse hepatocytes

Affiliations

Glycine N-methyltransferase inhibits aristolochic acid nephropathy by increasing CYP3A44 and decreasing NQO1 expression in female mouse hepatocytes

Ming-Min Chang et al. Sci Rep. .

Abstract

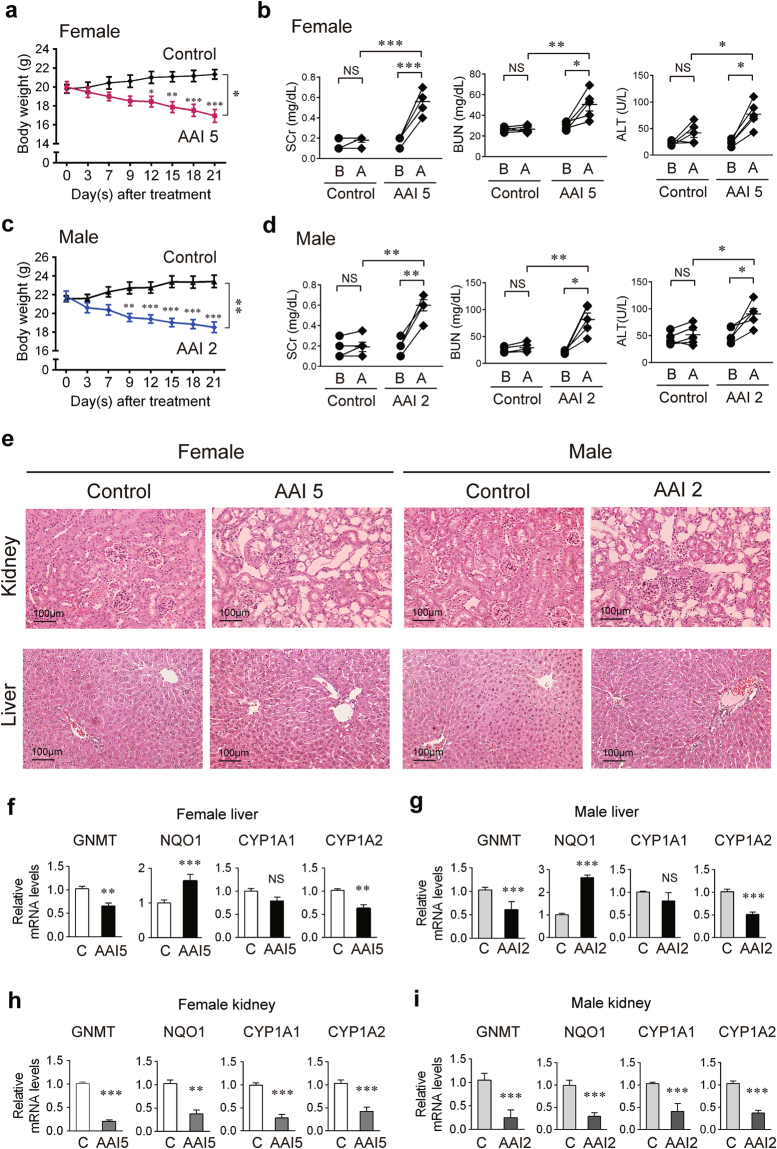
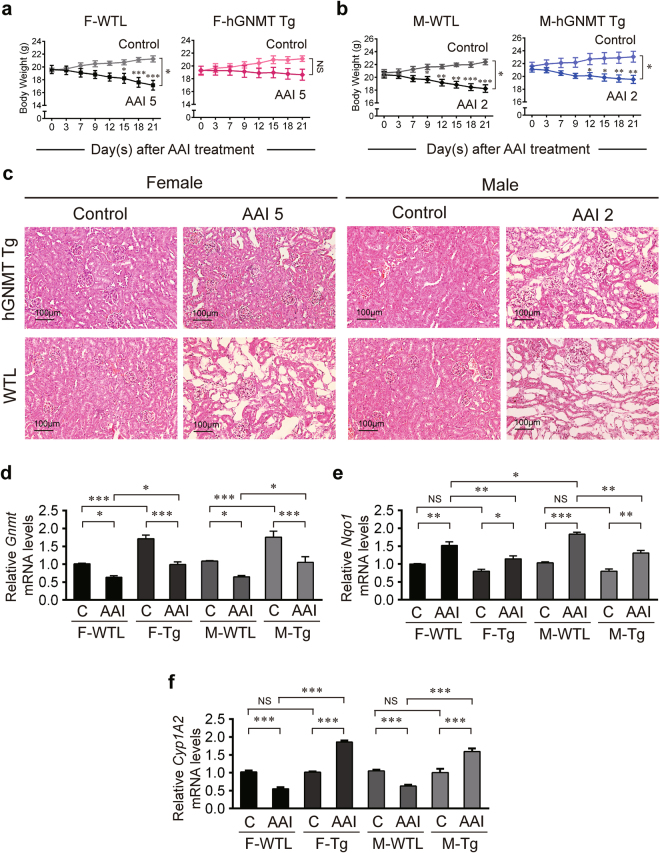
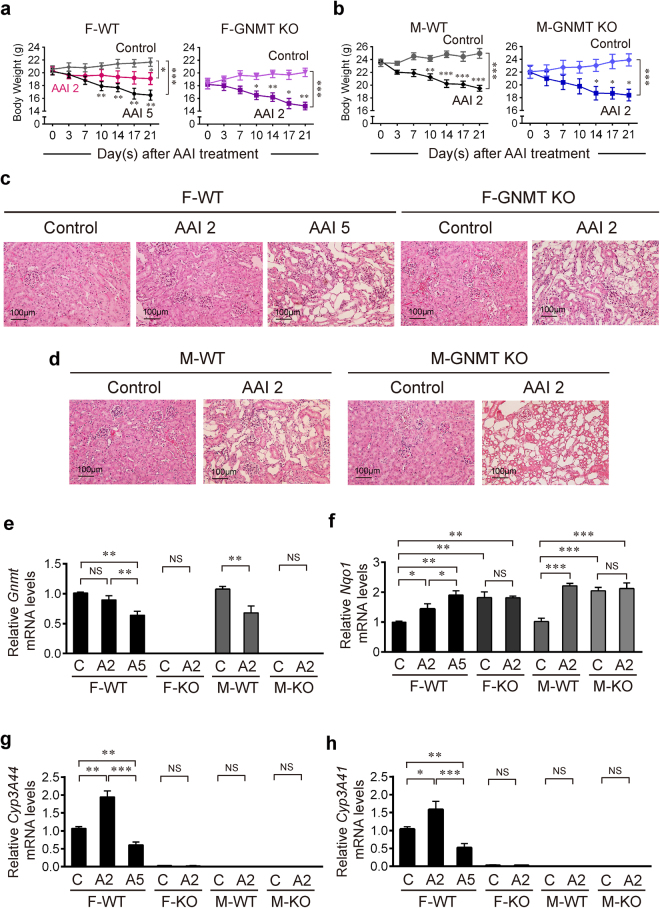
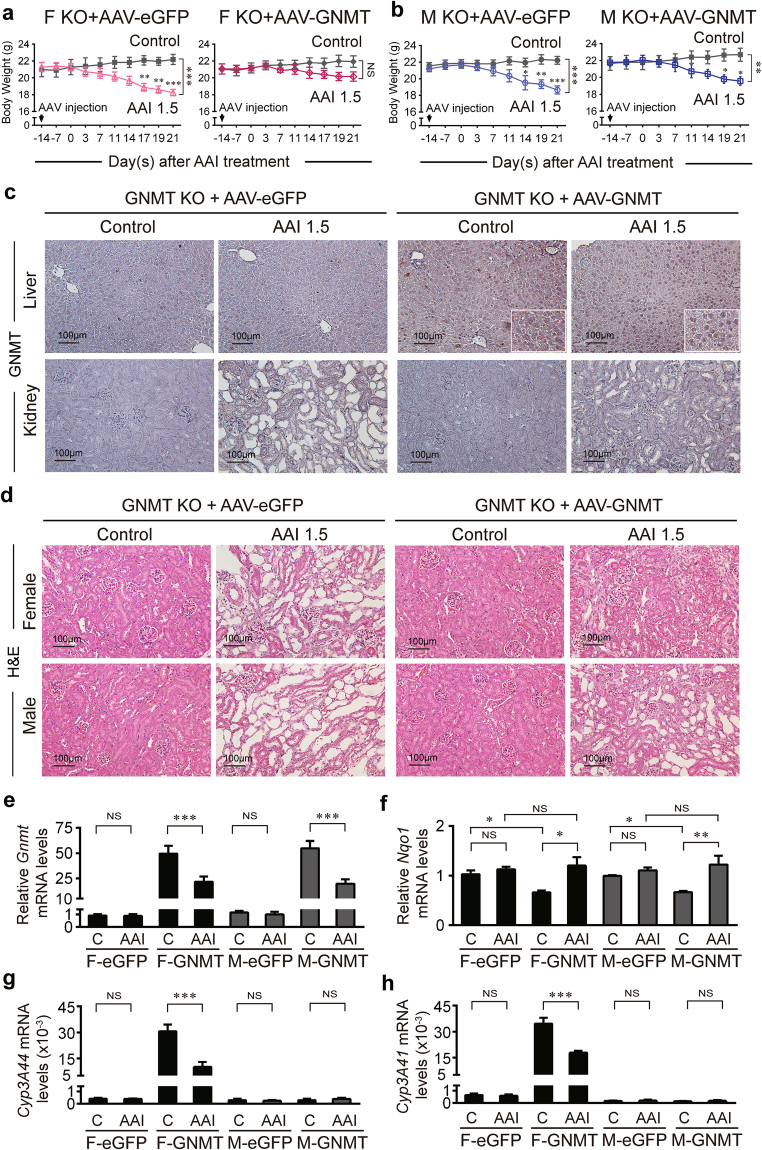
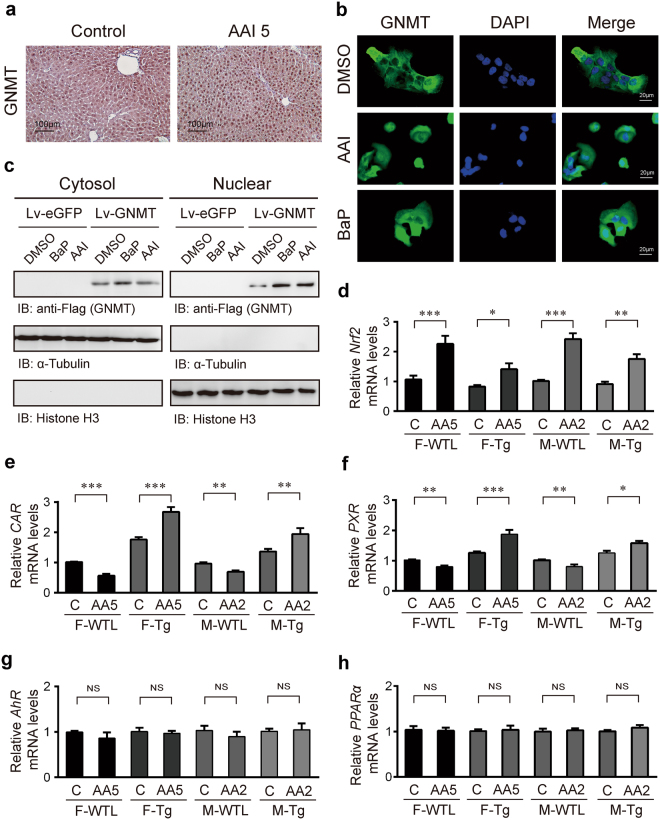
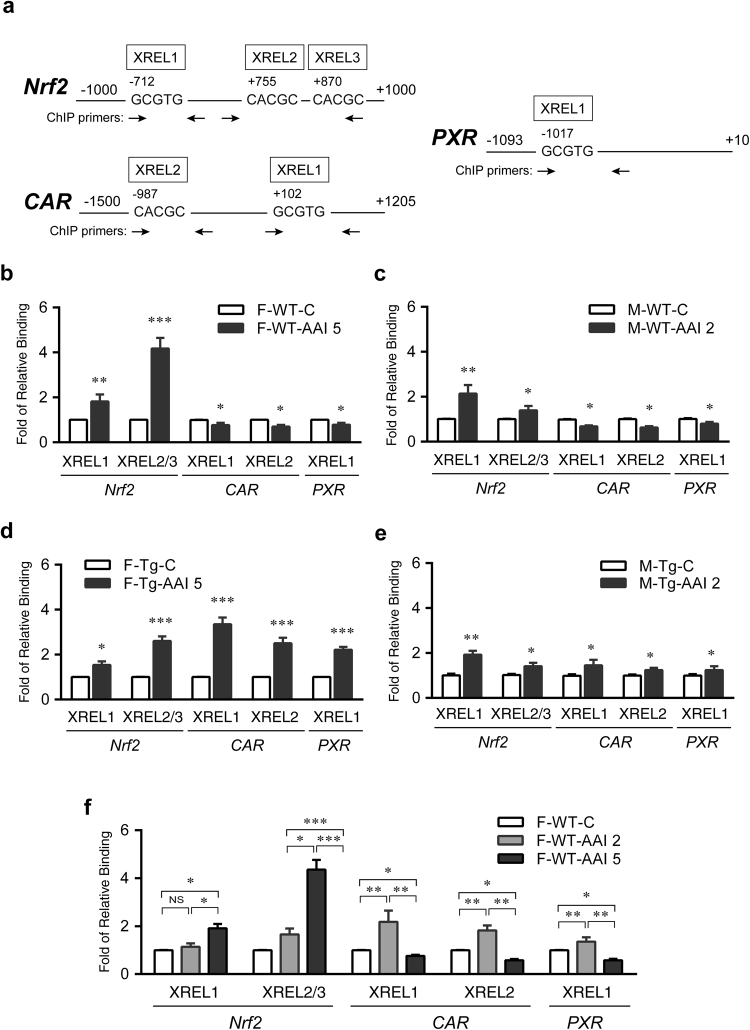
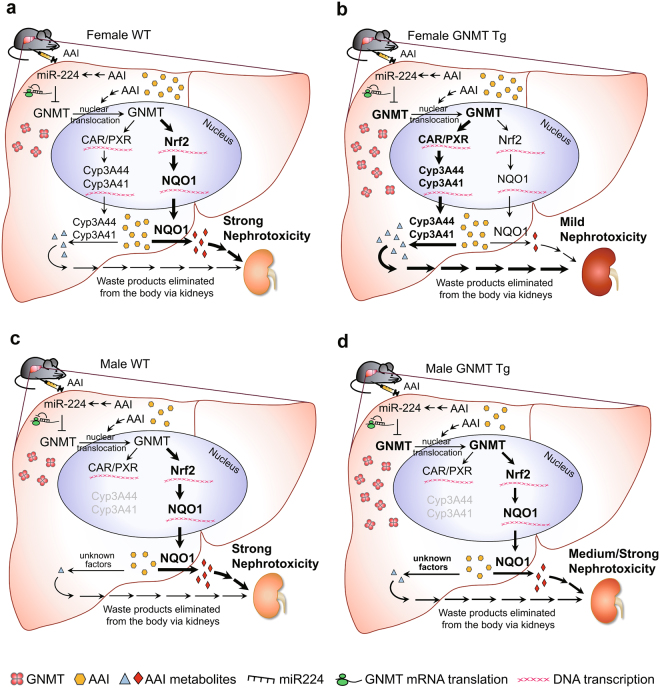
Plants containing aristolochic acids (AA) are nephrotoxins. Glycine N-methyltransferase (GNMT) acts to bind environmental toxins such as benzo(a)pyrene and aflatoxin B1, translocate into nucleus, and alter hepatic metabolism. This study aims to determine the role of GNMT in AA-induced nephropathy. We established an AA nephropathy mouse model and found that AA type I (AAI)-induced nephropathy at a lower concentration in male than in female mice, implying sex differences in AAI resistance. Microarray analysis and AAI-treated mouse models showed that GNMT moderately reduced AAI-induced nephropathy by lowering the upregulated level of NQO1 in male, but significantly improved the nephropathy additionally by increasing Cyp3A44/3A41 in female. The protective effects of GNMT were absent in female GNMT knockout mice, in which re-expression of hepatic GNMT significantly decreased AAI-induced nephropathy. Mechanism-wise, AAI enhanced GNMT nuclear translocation, resulting in GNMT interaction with the promoter region of the genes encoding Nrf2 and CAR/PXR, the transcription factors for NQO1 and CYP3A44/3A41, respectively. Unlike the preference for Nrf2/NQO1 transcriptions at lower levels of GNMT, overexpression of GNMT preferred CAR/PXR/CYP3A44/3A41 transcriptions and alleviated kidney injury upon AAI treatment. In summary, hepatic GNMT protected mice from AAI nephropathy by enhancing CAR/PXR/CYP3A44/3A41 transcriptions and reducing Nrf2/NQO1 transcriptions.


Conflict of interest statement

The authors declare no competing interests.

Figures

Figure 1
Figure 1
GNMT participates in the metabolism of AAI. (a,c) Body weight (BW) of wild-type (WT) C57BL/6 mice intraperitoneally injected with 2 or 5 mg/kg BW/day AAI (AAI 2 or AAI 5) or corn oil (vehicle control), 5 days/week for 3 weeks. Values presented are mean ± SEM, n = 5. p-values were calculated by two-way ANOVA and Sidak’s multiple comparisons test. (b,d) The serum levels of alanine aminotransferase (ALT), creatinine (SCr) and blood urea nitrogen (BUN) were measured from mice at the day before (B) and after (A) the 3-week AAI treatment. The biochemistry parameters from the same mouse before and after AAI-treatment were analyzed by Paired t-test. p-values for the comparison of biochemistry parameters from AAI- and corn oil-treated mice were calculated by Student’s t-test. (e) Histological examination of the kidney and liver tissue in AAI- and corn oil-treated WT mice (hematoxylin and eosin stain, original magnification ×200). (f–i) mRNA levels of Gnmt, Nqo1, Cyp1A1, Cyp1A2 genes in the livers (f, female liver; g, male liver) and kidneys (h, female kidney; i, male kidney) from AAI- or corn oil-treated WT mice were determined by qPCR. Data were normalized to β-actin. All values are presented as the mean ± SEM, n = 5. p-values were calculated by Student’s t-test. *p < 0.05, **p < 0.001, ***p ≤ 0.0001.
Figure 2
Figure 2
GNMT plays a protective role in AAI-induced renal damage. (a,b) Body weight of hGNMT transgenic (hGNMT Tg) mice and their wild-type littermates (WTL) intraperitoneally injected with 2 or 5 mg/kg BW/day AAI (AAI 2 or AAI 5) or corn oil (vehicle control), 5 days a week for 3 weeks. F: female; M: male. Values are presented as the mean ± SEM, n = 4. p-values were calculated by two-way ANOVA and Sidak’s multiple comparisons test. (c) Histological examination of the kidney morphology after AAI administration in GNMT Tg and WTL mice (hematoxylin and eosin stain, original magnification ×200). (d–f) mRNA level of Gnmt, Nqo1 and Cyp1A2 genes in the liver of AAI- or corn oil-treated GNMT Tg and WTL mice were determined by qPCR. Data were normalized to β-actin. C: vehicle control. Values are presented as the mean ± SEM, n = 5. p-values were calculated using Student’s t-test. *p < 0.05, **p < 0.001, ***p ≤ 0.0001.
Figure 3
Figure 3
GNMT prevented AAI-induced kidney injury by regulating cytochrome p450 enzymes in female mouse hepatocytes. RNA microarray analysis of the livers from AAI- or corn oil (vehicle control)-treated WT mice, as described in Fig. 1a and c. (a) The numbers of signature genes in liver in response to AAI treatment. Genes were identified as significantly changed if the fold change was greater than 2 (up or down) and the p-value was less than 0.01 in comparison to the control group. (b) Heat map from hierarchical clustering of xenobiotic metabolism genes. Red and green colors indicate an upregulation and downregulation of gene expression, respectively. Trees on the left of the heat map shows the gene clusters. (c–e) mRNA level of Cyp3A44, Cyp3A41and Cyp2B10 genes in the liver of AAI- or corn oil-treated hGNMT Tg (Tg) and WTL mice, as described in Fig. 2a and b, were determined by qPCR. Data were normalized to β-actin. (C: vehicle control, F: female, M: male). Values are presented as the mean ± SEM, n = 5. p-values were calculated using Student’s t-test. *p < 0.05, **p < 0.001, ***p ≤ 0.0001.
Figure 4
Figure 4
GNMT knockout female mice lose tolerance to AAI. (a,b) Body weight of GNMT knockout (GNMT KO) or wild-type (WT) mice intraperitoneally injected with 2 or 5 mg/kg/day AAI (AAI 2 or AAI 5) or corn oil (vehicle control), 5 days/week for 3 weeks. Values are presented as the mean ± SEM, n = 4. p-values were calculated by two-way ANOVA and Sidak’s multiple comparisons test. (c,d) Histological analysis of renal morphology in corn oil- or AAI-treated mice, as described in (a,b) (hematoxylin and eosin stain, original magnification ×200). (e–h) mRNA level of Gnmt, Nqo1, Cyp3A4, and Cyp3A41 genes in the liver of AAI- or corn oil-treated WT or GNMT KO mice, as described in (a,b), were determined by qPCR. Data were normalized to β-actin. (A2, A5: 2 or 5 mg/kg BW/day AAI administration, C: vehicle control) Values are presented as the mean ± SEM, n = 5. p-values were calculated using Student’s t-test. *p < 0.05, **p < 0.001, ***p ≤ 0.0001.
Figure 5
Figure 5
Re-expression hepatic GNMT reduces the AAI-induced nephropathy. GNMT knockout (KO) mice were intravenously injected with AAV-GNMT or AAV-eGFP. At 14 days after AAV injection, all mice were challenged with AAI at a dose of 1.5 mg/kg/day (AAI 1.5), 5 days/week for 3 weeks. (a,b) Body weight of AAV-GNMT or AAV-eGFP-treated KO mice intraperitoneally injected with AAI or corn oil (vehicle control). Values are presented as the mean ± SEM, n = 4. p-values were calculated by two-way ANOVA and Sidak’s multiple comparisons test. (c) Representative micrographs of GNMT expression in the liver and kidneys of the AAV-treated KO mice (original magnification ×200). (d) Hematoxylin and eosin staining of kidneys in AAV-treated KO mice after 3-week AAI exposure (original magnification ×200). (e–h) mRNA level of (e) Gnmt, (f) Nqo1, (g) Cyp3A44, and (h) Cyp3A41 genes from the livers of AAV-treated KO mice after 3-week AAI exposure, as described in (a,b), were determined by qPCR. Data were normalized by β-actin. (F-eGFP: female KO mice treated with AAV-eGFP, F-GNMT: female GNMT KO mice treated with AAV-GNMT, M: Male) Values are presented as the mean ± SEM, n = 5. p-values were calculated using Student’s t -test. *p < 0.05, **p < 0.001, ***p ≤ 0.0001.
Figure 6
Figure 6
AAI promotes the nuclear localization of GNMT in the liver. (a) Immunohistochemical staining for GNMT expression in the liver of the female C57BL/6 mouse intraperitoneally injected with 5 mg/kg bw/day AAI (AAI 5) or corn oil (vehicle control) for 3 weeks (original magnification ×200). (b) Immunofluorescent microscopy of fixed Huh7 Lv-GNMT cells stained for GNMT (green, Alexa 488) and DAPI. Huh7 Lv-GNMT cells were treated with 250 μM AAI, 10 μM BaP (positive control) or vehicle (0.01% DMSO, negative vehicle control) for 16 hours (original magnification, ×200). (c) Western blot analysis of nuclear and cytoplasmic (non-nuclear) fractions from AAI-, BaP- and DMSO-treated Huh7 Lv-GNMT cells. Histone H3 and α-tubulin were used as loading and purity controls for the nuclear and cytoplasmic fractions, respectively. The full-length blots are presented in Supplementary Fig. S7. (d–h) mRNA levels of (d) Nrf2, (e) CAR, (f) PXR (g) AhR, (h) PPARα in the liver from AAI- or corn oil-treated hGNMT Tg mice, as described in Fig. 2a and b, were determined by qPCR. (C: mice treated with corn oil; AA2 orAA5: 2 or 5 mg/kg BW/day AAI administration; F: female; M: male; Tg: hGNMT transgenic mice; WTL: wild-type littermates of Tg mice) All qPCR data were normalized to β-actin. Values are presented as the mean ± SEM; n = 4 in each group. p-values were calculated using Student’s t-test. *p < 0.05, **p < 0.001, ***p ≤ 0.0001.
Figure 7
Figure 7
GNMT interacts with the promoters of the genes encoding Nrf2, CAR and PXR, nuclear transcription factors. (a) The chromatin was immunoprecipitated with mouse anti-GNMT antibody (14-1) or mouse IgG (negative control). ChIP-enriched DNA was amplified with the primers for XREL1, XREL2 and XREL3 regions on the promoter of Nrf2, PXR, and CAR genes. Schematic represents the upstream promoter binding regions of XREL1, XREL2 and XREL3 in the Nrf2 (XREL1: −712 to −708; XREL2: +755 to +759; XREL3: +870 to +874), CAR (XREL1: +102 to +106; XREL2: −987 to −983) and PXR (XREL1: −1017 to −1013) genes. Horizontal arrows indicate the location of primers used for qPCR in site-specific ChIP assays. Note that the figure is not drawn to scale. (b–e) ChIP-qPCR analyses were performed with the liver lysates from AAI- or corn oil (C)-treated WT (b, female, F; c, male, M) and hGNMT Tg mice (d, female, F; e, male, M), as described in Figs 1 and 2. (f) ChIP-qPCR analyses were performed with the liver lysates from 3-week AAI- and corn oil (C)-treated WT female mice, as described in Fig. 4a (AAI 2 or AAI 5: 2 or 5 mg/kg BW/day AAI administration). The quantity of DNA in the precipitation with GNMT antibody was normalized to the IgG control. Values are presented as the mean ± SEM, n = 4. p-values were analyzed using the one-way ANOVA or Student’s t-test. *p < 0.05, **p < 0.001, ***p ≤ 0.0001.
Figure 8
Figure 8
Schematic representation of the role of GNMT in AAI metabolism. The proposed metabolic pathways of AAI regulated by GNMT in liver of 5 mg/kg/day AAI-treated female WT mice (a) and GNMT Tg mice (b); and in 2 mg/kg/day AAI-treated male WT mice (c) and GNMT Tg mice (d).

References

    1. IARC Working Group W. A review of human carcinogens. Part A: Pharmaceuticals. Plants containing aristolochic acid.. IARC Monogr. Eval. Carcinog. Risks Hum. 2012;100A:347–361.
    1. Nortier JL, et al. Urothelial carcinoma associated with the use of a Chinese herb (Aristolochia fangchi) N. Engl. J. Med. 2000;342:1686–1692. doi: 10.1056/NEJM200006083422301. - DOI - PubMed
    1. Grollman AP, et al. Aristolochic acid and the etiology of endemic (Balkan) nephropathy. Proc. Natl. Acad. Sci. USA. 2007;104:12129–12134. doi: 10.1073/pnas.0701248104. - DOI - PMC - PubMed
    1. Vanherweghem JL, et al. Rapidly progressive interstitial renal fibrosis in young women: association with slimming regimen including Chinese herbs. Lancet. 1993;341:387–391. doi: 10.1016/0140-6736(93)92984-2. - DOI - PubMed
    1. Vanhaelen M, Vanhaelen-Fastre R, But P, Vanherweghem JL. Identification of aristolochic acid in Chinese herbs. Lancet. 1994;343:174. doi: 10.1016/S0140-6736(94)90964-4. - DOI - PubMed

Publication types

MeSH terms