. 2018 Apr 19:12:106.
doi: 10.3389/fncel.2018.00106. eCollection 2018.

Automated Morphological Analysis of Microglia After Stroke

Affiliations

Automated Morphological Analysis of Microglia After Stroke

Steffanie Heindl et al. Front Cell Neurosci. .

Abstract

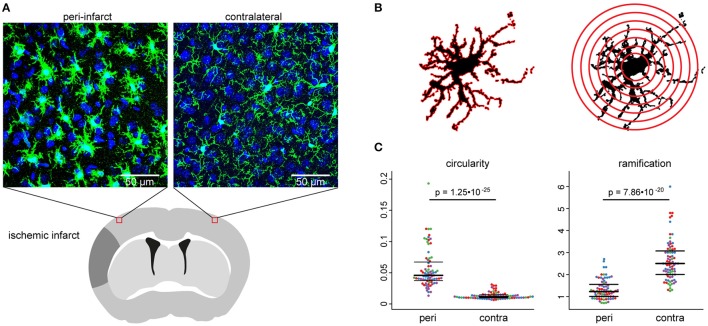
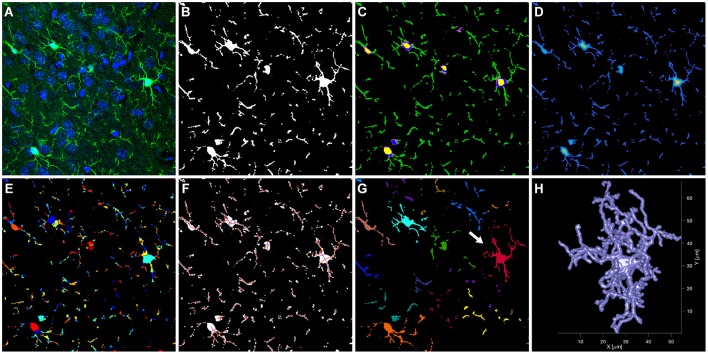
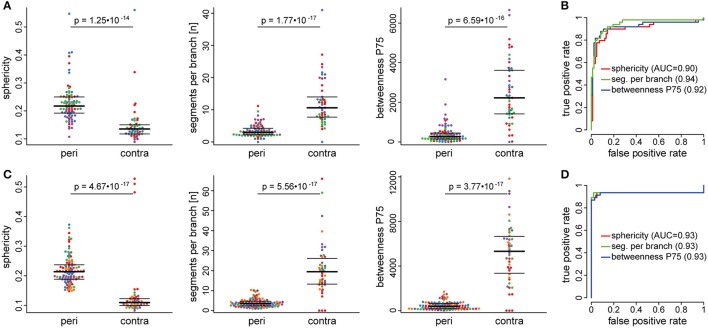
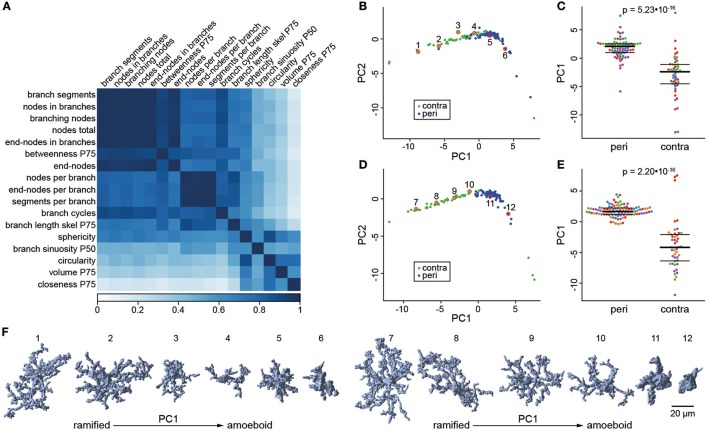
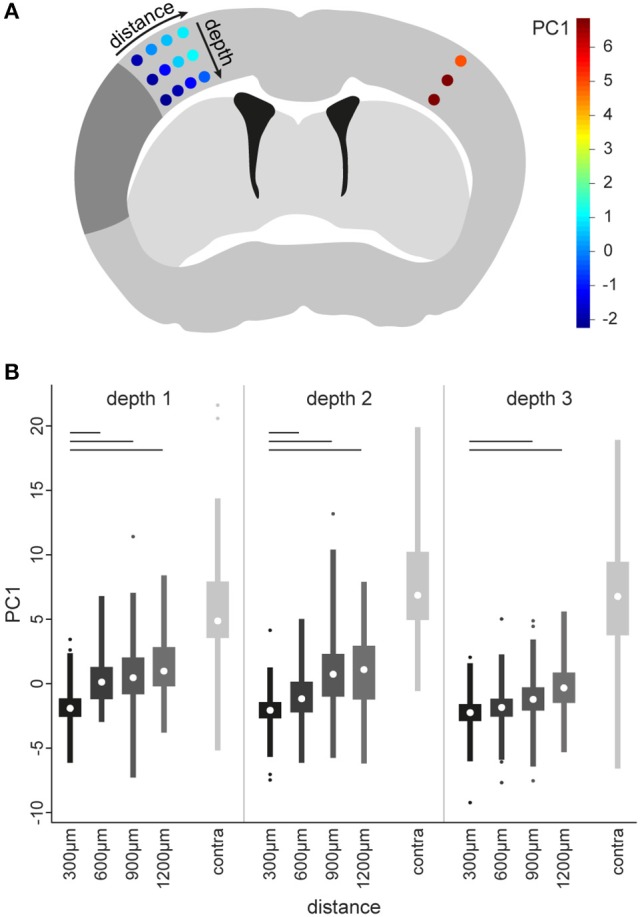
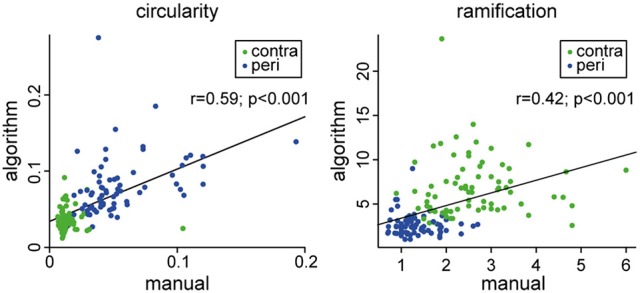
Microglia are the resident immune cells of the brain and react quickly to changes in their environment with transcriptional regulation and morphological changes. Brain tissue injury such as ischemic stroke induces a local inflammatory response encompassing microglial activation. The change in activation status of a microglia is reflected in its gradual morphological transformation from a highly ramified into a less ramified or amoeboid cell shape. For this reason, the morphological changes of microglia are widely utilized to quantify microglial activation and studying their involvement in virtually all brain diseases. However, the currently available methods, which are mainly based on manual rating of immunofluorescent microscopic images, are often inaccurate, rater biased, and highly time consuming. To address these issues, we created a fully automated image analysis tool, which enables the analysis of microglia morphology from a confocal Z-stack and providing up to 59 morphological features. We developed the algorithm on an exploratory dataset of microglial cells from a stroke mouse model and validated the findings on an independent data set. In both datasets, we could demonstrate the ability of the algorithm to sensitively discriminate between the microglia morphology in the peri-infarct and the contralateral, unaffected cortex. Dimensionality reduction by principal component analysis allowed to generate a highly sensitive compound score for microglial shape analysis. Finally, we tested for concordance of results between the novel automated analysis tool and the conventional manual analysis and found a high degree of correlation. In conclusion, our novel method for the fully automatized analysis of microglia morphology shows excellent accuracy and time efficacy compared to traditional analysis methods. This tool, which we make openly available, could find application to study microglia morphology using fluorescence imaging in a wide range of brain disease models.

Keywords: image analysis; microglia; morphology; neuroinflammation; stroke.


Figures

Figure 1
Figure 1
Experimental paradigm. The stroke model (A), used for the development of the automated algorithm, was first analyzed manually (B), to evaluate the impact of the infarct on microglia morphology (C). (A) The scheme depicts the regions of interest for confocal imaging in the peri-infarct area and the homotypic area in the contralateral cortex 3 days after stroke. Images show representative maximum intensity projections of image stacks at both positions from Iba1-stained brain sections. (B) The schemes illustrate graphically the calculation base for the circularity index (left) and Shoenen ramification index (right) for the manual analysis. (C) Swarm plots show individual cells in the peri-infarct area (peri) and in the contralateral hemisphere (contra) for the manually analyzed circularity index (left) and Shoenen ramification index (right). Seventy-five to seventy-nine cells per region of n = 4 mice, colors correspond to individual mice.
Figure 2
Figure 2
Main steps of the automated analysis of microglial cells. The raw confocal image (A, shown as single slice of the Z stack) was segmented into microglial cells and background (B). Cells were further segmented (C) into nucleus (yellow), soma (blue/purple), and branches (green). Subsequently, a skeleton was created in three steps. A distance map was calculated, indicating for each voxel the distance to the cell surface (D, distance increases from blue to yellow). This distance map was then used as input to a watershed segmentation (E, colors were chosen at random for each segment). The resulting segments were connected to create the skeleton (F). For visualization, a simplified skeleton in 2D is shown. The skeleton was then used to segregate individual cells (G, each color represents a different cell). The surface model of the red cell in (G) (arrow) is shown in (H).
Figure 3
Figure 3
Automatically extracted morphological features in peri-infarct and contralateral cortex. Automated analysis of microglia morphology was performed in an exploratory dataset (A,B) and an independent validation cohort (C,D). Swarm plots in (A,C) show individual cells in the peri-infarct area (peri) and in the contralateral hemisphere (contra) for three representative features: sphericity, segments per branch, and betweenness. Colors in the swarm plots correspond to individual mice. The receiver operating characteristic (ROC) curves indicate very good discrimination performance for all three features, both in the exploratory (B) and the validation (D) dataset.
Figure 4
Figure 4
Dimensionality reduction by principal component analysis. The correlation matrix (A) was calculated for the 17 selected features with an AUC > 0.85 in the ROC analysis. This matrix indicates a high degree of multicollinearity among features and hence suggests that principle component analysis (PCA) is suited to reduce the dimensionality of this feature set. (B) Scores for the first and second principle component (PC1/PC2) of cells in the exploratory dataset. Cells are colored according to their location in the contralateral hemisphere (contra; green) or the peri-infarct area (peri; blue). (C) Swarm plots for PC1, with the same plotting conventions as used in Figure 3. (D,E) The same plots for the validation dataset as shown in panel (B,C). In both datasets, PC1 discriminates very well between cells from peri-infarct and contralateral cortex. (F) Three-dimensional (3D) representation of microglial cells along PC1 in the exploratory (cells 1–6) and validation (cells 7–12) dataset. The plotted cells are indicated by numbered red circles in panel (B,D).
Figure 5
Figure 5
Identification of morphological differences between microglia of the peri-infarct area. To determine microglia morphology in various distances from the infarct area, multiple image stacks were acquired in a grid-like spatial arrangement (A). The grid contained four distances in the ipsilateral cortex (i.e., 300, 600, 900, and 1,200 μm from the infract border) at three different depths (i.e., depth 1, 2, and 3). In addition, a location in the contralateral cortex (contra) homotypic to the 300 μm location was included, at the same 3 depths. The positions of the grid are colored according to the median scores of the first principal component (PC1), calculated as described in the main text for a new set of 5 animals 5 days after stroke (see color bar in A). These colors show increasing scores for PC1 with increasing distance from the infarct. Boxplots (B) of PC1 scores for all microglia at each imaging position in the grid. A Kruskal–Wallis test was applied to all positions in the grid. Significant post-hoc comparisons of ipsilateral positions to the 300 μm position at the same depth are indicated by bars (p < 0.001, corrected for multiple comparisons).
Figure 6
Figure 6
Comparison between human rater (manual) and the automated analysis (algorithm). Circularity was calculated in the same manner for both procedures. Ramification was calculated by the Shoenen ramification index for the manual procedure and as the “end-nodes per branch” feature for the automated procedure.

References

    1. Aloisi F. (2001). Immune function of microglia. Glia 36, 165–179. 10.1002/glia.1106 - DOI - PubMed
    1. Anttila J. E., Whitaker K. W., Wires E. S., Harvey B. K., Airavaara M. (2016). Role of microglia in ischemic focal stroke and recovery: focus on toll-like receptors. Prog Neuropsychopharmacol Biol Psychiatry 79(Pt A), 3–14. 10.1016/j.pnpbp.2016.07.003 - DOI - PMC - PubMed
    1. Brites D., Vaz A. R. (2014). Microglia centered pathogenesis in ALS: insights in cell interconnectivity. Front. Cell. Neurosci. 8:117. 10.3389/fncel.2014.00117 - DOI - PMC - PubMed
    1. Butovsky O., Jedrychowski M. P., Moore C. S., Cialic R., Lanser A. J., Gabriely G., et al. . (2014). Identification of a unique TGF-beta-dependent molecular and functional signature in microglia. Nat. Neurosci. 17, 131–143. 10.1038/nn.3599 - DOI - PMC - PubMed
    1. Colonna M., Butovsky O. (2017). Microglia function in the central nervous system during health and neurodegeneration. Annu. Rev. Immunol. 35, 441–468. 10.1146/annurev-immunol-051116-052358 - DOI - PMC - PubMed

LinkOut - more resources