. 2018 Jan 11;3(2):464-475.
doi: 10.1016/j.ekir.2017.11.002. eCollection 2018 Mar.

Association of Pathological Fibrosis With Renal Survival Using Deep Neural Networks

Affiliations

Association of Pathological Fibrosis With Renal Survival Using Deep Neural Networks

Vijaya B Kolachalama et al. Kidney Int Rep. .

Abstract

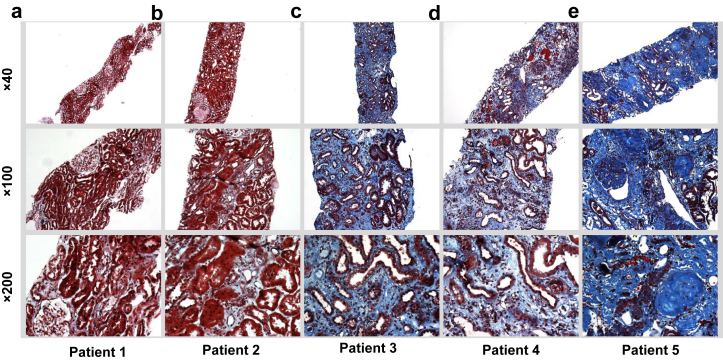
Introduction: Chronic kidney damage is routinely assessed semiquantitatively by scoring the amount of fibrosis and tubular atrophy in a renal biopsy sample. Although image digitization and morphometric techniques can better quantify the extent of histologic damage, we need more widely applicable ways to stratify kidney disease severity.

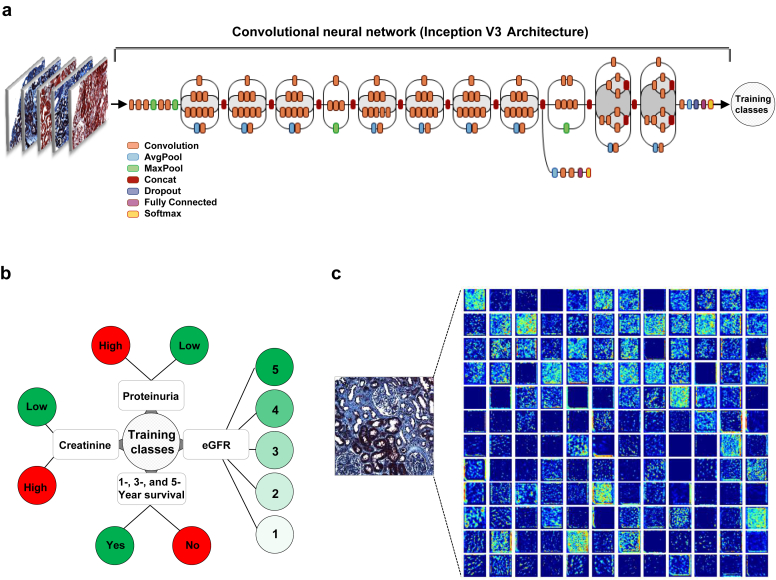
Methods: We leveraged a deep learning architecture to better associate patient-specific histologic images with clinical phenotypes (training classes) including chronic kidney disease (CKD) stage, serum creatinine, and nephrotic-range proteinuria at the time of biopsy, and 1-, 3-, and 5-year renal survival. Trichrome-stained images processed from renal biopsy samples were collected on 171 patients treated at the Boston Medical Center from 2009 to 2012. Six convolutional neural network (CNN) models were trained using these images as inputs and the training classes as outputs, respectively. For comparison, we also trained separate classifiers using the pathologist-estimated fibrosis score (PEFS) as input and the training classes as outputs, respectively.

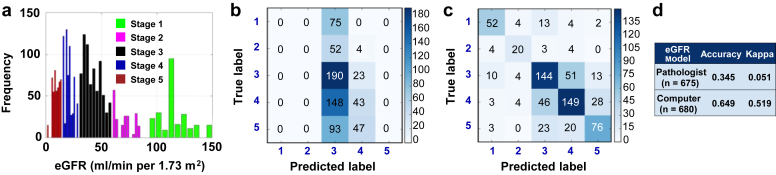
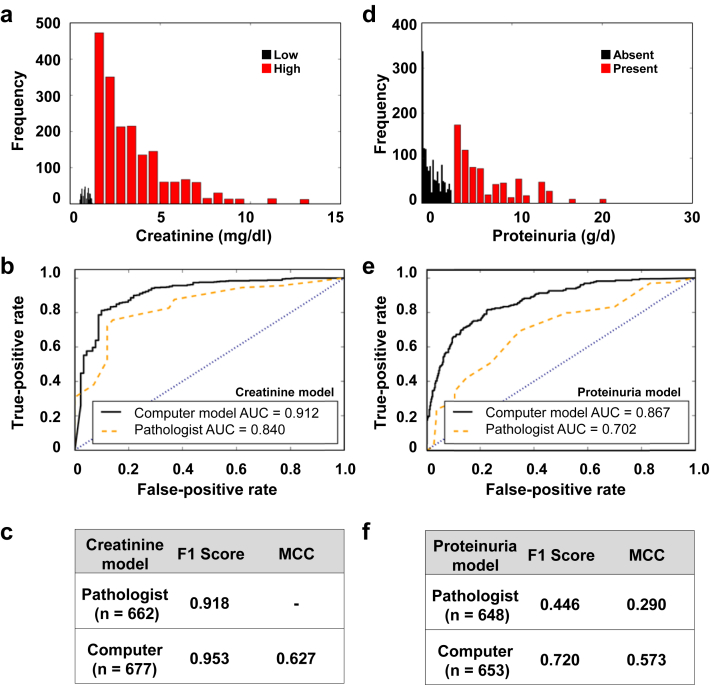
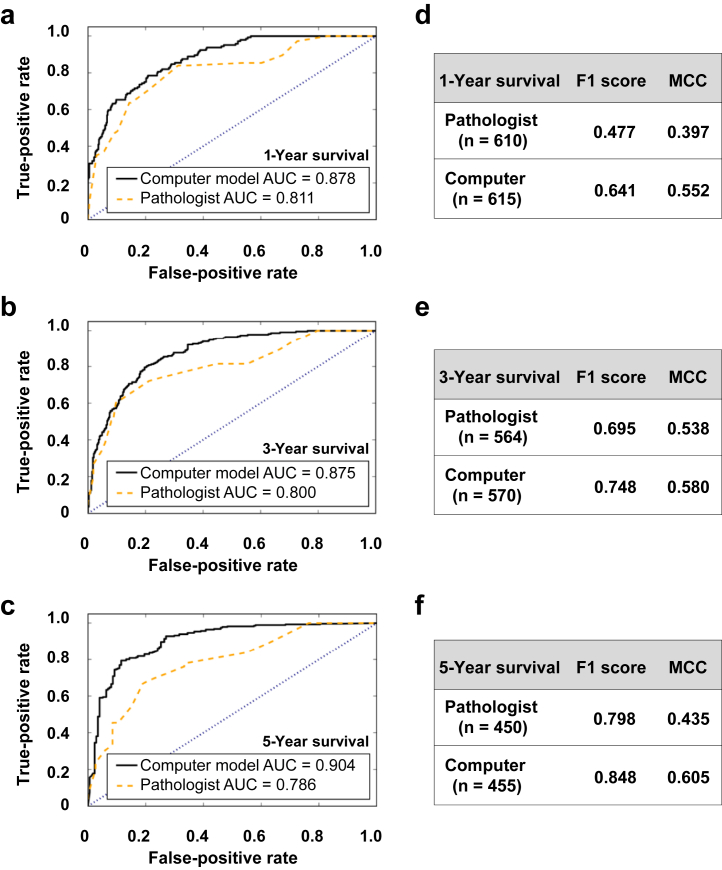
Results: CNN models outperformed PEFS across the classification tasks. Specifically, the CNN model predicted the CKD stage more accurately than the PEFS model (κ = 0.519 vs. 0.051). For creatinine models, the area under curve (AUC) was 0.912 (CNN) versus 0.840 (PEFS). For proteinuria models, AUC was 0.867 (CNN) versus 0.702 (PEFS). AUC values for the CNN models for 1-, 3-, and 5-year renal survival were 0.878, 0.875, and 0.904, respectively, whereas the AUC values for PEFS model were 0.811, 0.800, and 0.786, respectively.

Conclusion: The study demonstrates a proof of principle that deep learning can be applied to routine renal biopsy images.

Keywords: histology; machine learning; renal fibrosis; renal survival.


Figures

Figure 1
Figure 1
Sample interstitial fibrosis cases from the patient cohort. The trichrome-stained images demonstrate the variability and extent of interstitial fibrosis observed within renal biopsy samples at different magnifications. The in-house nephropathologist−derived fibrosis score was 5% to 10% for (a), 20% for (b), 30% for (c), 50% for (d), and 85% for (e).
Figure 2
Figure 2
Deep neural network model. (a) Our classification technique is based on using a transfer learning approach on Google Inception V3 convolutional neural network (CNN) architecture pretrained on the ImageNet dataset (1.28 million images over 1000 generic object classes) and fine-tuned on our dataset (see Methods). Inception v3 CNN architecture reprinted with permission from the Google blog “Train Your Own Image Classifier With Inception in TensorFlow” (https://research.googleblog.com/2016/03/train-your-own-image-classifier-with.html). (b) Using the dataset containing trichrome-stained images from the patients as inputs, several models were constructed with different output classes (chronic kidney disease stage based on estimated glomerular filtration rate [eGFR], binarized serum creatinine and proteinuria, as well as 1-, 3-, and 5-year renal survival). (c) Visualization of filters generated during training. Only 144 of the 256 filters used at the first pooling layer are shown.
Figure 3
Figure 3
Predictive model of estimated glomerular filtration rate (eGFR) at the time of biopsy. (a) Distribution of eGFR values across the patient cohort. The histogram frequency corresponds to the number of images. (b) A multilabel linear discriminant classifier was trained on the data with pathologist-derived fibrosis as the input and eGFR-based chronic kidney disease (CKD) stage (stages 1−5) at the time of biopsy as the output. Image data were randomly split such that 70% of the data (n = 1512) were reserved for model training and the remaining for testing (n = 648). “True label” denotes the CKD stage derived from calculated eGFR values at the time of biopsy, whereas “Predicted label” indicates the model assessment of the CKD stage. (c) Fine-tuned convolutional neural network (CNN) model was used to predict on test image data (n = 677) not used for training. Performances of the pathologist (b) and the CNN (c) models are shown in the form of confusion matrices. (d) A κ score was computed by comparing model-derived output values with the clinically reported values of eGFR. The CNN model accuracy and κ score indicate the superior performance of the CNN model in comparison to the pathologist model.
Figure 4
Figure 4
Predictive models of creatinine and nephrotic-range proteinuria at the time of biopsy. (a) Distribution of creatinine values across the patient cohort. The histogram frequency corresponds to the number of images. Color to a set of bars within the histogram was assigned based on the Kidney Disease Outcomes Quality Initiative (KDOQI) guideline−driven cutoff values for high and low creatinine. (b) A binary linear discriminant (BLD) classifier was trained using 70% of the image data (n = 1545), with pathologist-derived fibrosis value as the input and baseline creatinine value at the time of biopsy as the output. Model predictions were performed on the remaining 30% of the data (n = 662), and a receiver operating characteristic (ROC) curve was generated. (c) Both F1 score and Matthews correlation coefficient (MCC) computed using models’ performances on test data indicate superior performance of the convolutional neural network (CNN) model. (d) Distribution of proteinuria values across the patient cohort. Color to a set of bars within the histogram was assigned based on the KDOQI guideline−driven cutoff value for nephrotic-range proteinuria (g/d). (e) A similar BLD classifier was trained using 70% of the image data (n = 1512), with the pathologist-derived fibrosis value as the input and the clinical indication of proteinuria as the output. Model predictions were performed on the remaining 30% of the data (n = 648), and an ROC curve was generated. (f) Both the F1 score and the MCC computed using models’ performances on test data indicate superior performance of the CNN model in comparison to the pathologist model.
Figure 5
Figure 5
Predictive models of 1-, 3-, and 5-year renal survival. Three separate binary linear discriminant classifiers were trained using 70% of the image data, with pathologist-derived fibrosis value as the input and 1-, 3-, and 5-year renal survival values computed from the clinical reports as the outputs, respectively. The convolutional neural network (CNN) framework was also used to train separate models with the 3 outputs. Predictions of the models were performed on the remaining 30% of the data, denoted as “n” for each case. Receiver operating characteristic curves comparing the pathologist model with the CNN model were generated for each case ([a] 1-year, [b] 3-year, and [c] 5-year renal survival) respectively. F1 score and Matthews correlation coefficient (MCC) values computed for each case ([d] 1-year, [e] 3-year, and [f] 5-year renal survival) on the test data also indicate superior performance of the CNN model.

References

    1. Darcy A.M., Louie A.K., Roberts L.W. Machine learning and the profession of medicine. JAMA. 2016;315:551–552. - PubMed
    1. Deo R.C. Machine learning in medicine. Circulation. 2015;132:1920–1930. - PMC - PubMed
    1. Kang J., Schwartz R., Flickinger J., Beriwal S. Machine learning approaches for predicting radiation therapy outcomes: a clinician's perspective. Int J Radiat Oncol Biol Phys. 2015;93:1127–1135. - PubMed
    1. Obermeyer Z., Emanuel E.J. Predicting the future—big data, machine learning, and clinical medicine. N Engl J Med. 2016;375:1216–1219. - PMC - PubMed
    1. Waljee A.K., Higgins P.D. Machine learning in medicine: a primer for physicians. Am J Gastroenterol. 2010;105:1224–1226. - PubMed