

Increased Ca++ uptake by erythrocytes infected with malaria parasites: Evidence for exported proteins and novel inhibitors
- PMID: 29726084
- PMCID: PMC6113089
- DOI: 10.1111/cmi.12853
Increased Ca++ uptake by erythrocytes infected with malaria parasites: Evidence for exported proteins and novel inhibitors
Abstract
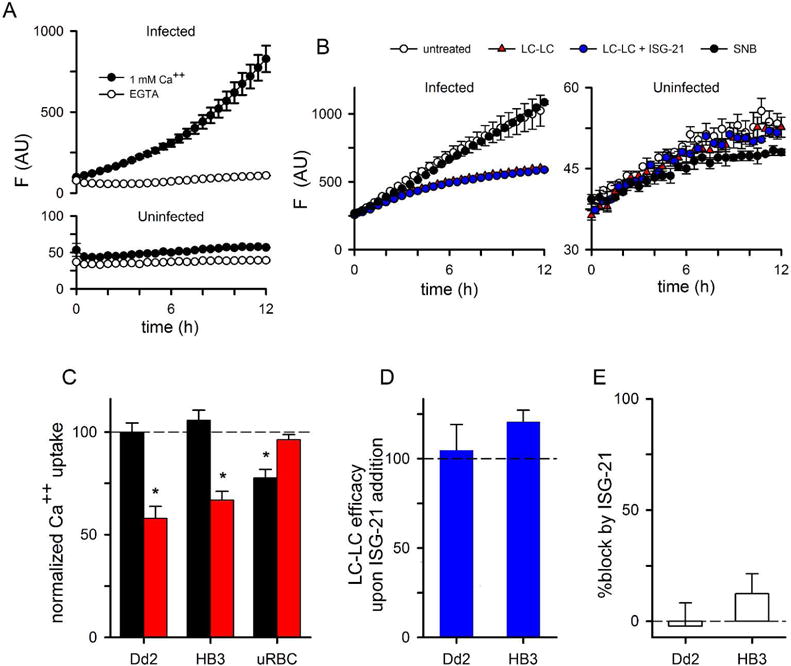
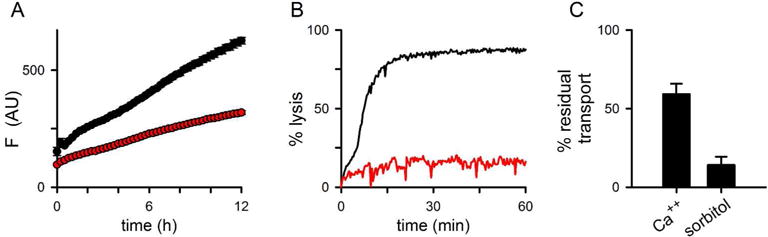
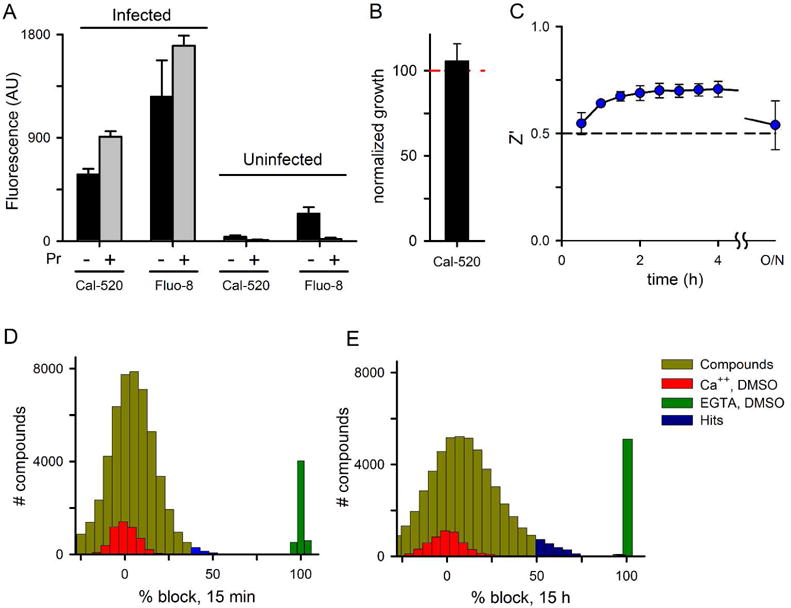
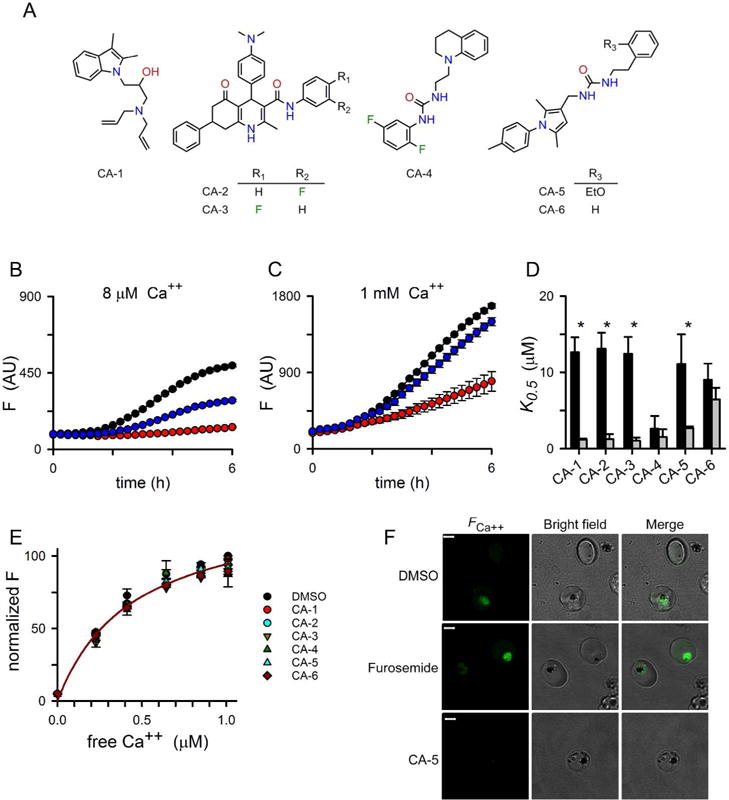
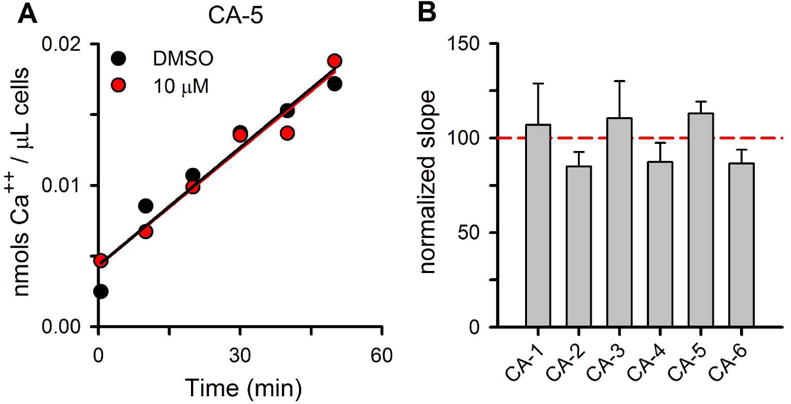
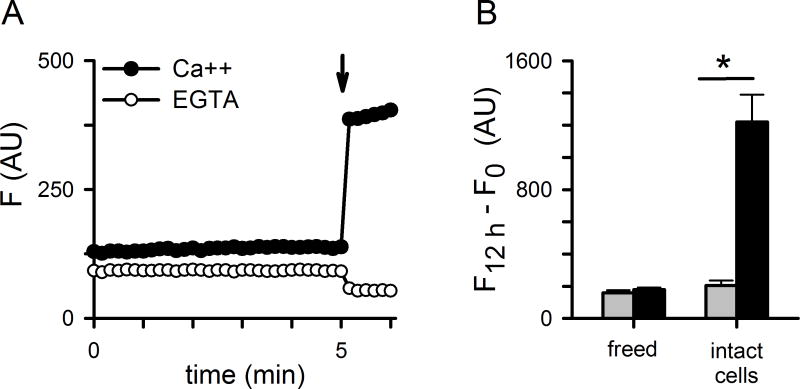
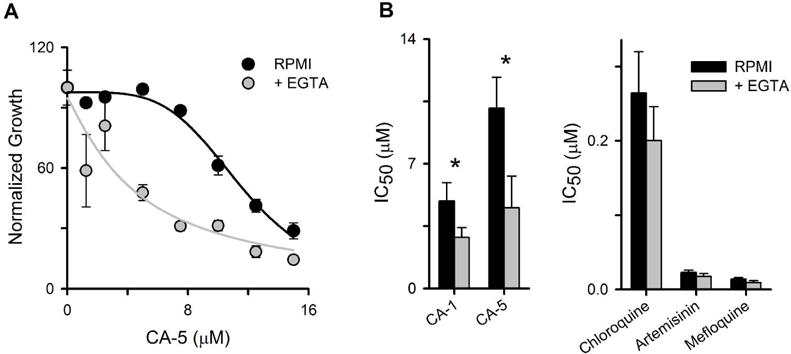
Malaria parasites export many proteins into their host erythrocytes and increase membrane permeability to diverse solutes. Although most solutes use a broad-selectivity channel known as the plasmodial surface anion channel, increased Ca++ uptake is mediated by a distinct, poorly characterised mechanism that appears to be essential for the intracellular parasite. Here, we examined infected cell Ca++ uptake with a kinetic fluorescence assay and the virulent human pathogen, Plasmodium falciparum. Cell surface labelling with N-hydroxysulfosuccinimide esters revealed differing effects on transport into infected and uninfected cells, indicating that Ca++ uptake at the infected cell surface is mediated by new or altered proteins at the host membrane. Conditional knockdown of PTEX, a translocon for export of parasite proteins into the host cell, significantly reduced infected cell Ca++ permeability, suggesting involvement of parasite-encoded proteins trafficked to the host membrane. A high-throughput chemical screen identified the first Ca++ transport inhibitors active against Plasmodium-infected cells. These novel chemical scaffolds inhibit both uptake and parasite growth; improved in vitro potency at reduced free [Ca++ ] is consistent with parasite killing specifically via action on one or more Ca++ transporters. These inhibitors should provide mechanistic insights into malaria parasite Ca++ transport and may be starting points for new antimalarial drugs.
Keywords: Plasmodium falciparum; calcium transport; high-throughput screen; inhibitors; malaria.
Published 2018. This article is a U.S. Government work and is in the public domain in the USA.
Figures
Similar articles
-
A High-Throughput Inhibitor Screen Targeting CLAG3 Export and Membrane Insertion on Human Erythrocytes Infected with Malaria Parasites.Pathogens. 2025 May 23;14(6):520. doi: 10.3390/pathogens14060520. Pathogens. 2025. PMID: 40559528 Free PMC article.
-
A kinetic fluorescence assay reveals unusual features of Ca⁺⁺ uptake in Plasmodium falciparum-infected erythrocytes.Malar J. 2014 May 18;13:184. doi: 10.1186/1475-2875-13-184. Malar J. 2014. PMID: 24885754 Free PMC article.
-
Live-Cell FRET Reveals that Malaria Nutrient Channel Proteins CLAG3 and RhopH2 Remain Associated throughout Their Tortuous Trafficking.mBio. 2020 Sep 8;11(5):e01354-20. doi: 10.1128/mBio.01354-20. mBio. 2020. PMID: 32900800 Free PMC article.
-
Plasmodium species: master renovators of their host cells.Nat Rev Microbiol. 2016 Aug;14(8):494-507. doi: 10.1038/nrmicro.2016.79. Epub 2016 Jul 4. Nat Rev Microbiol. 2016. PMID: 27374802 Review.
-
Vesicle-mediated trafficking of parasite proteins to the host cell cytosol and erythrocyte surface membrane in Plasmodium falciparum infected erythrocytes.Int J Parasitol. 2001 Oct;31(12):1381-91. doi: 10.1016/s0020-7519(01)00256-9. Int J Parasitol. 2001. PMID: 11566305 Review.
Cited by
-
ATPe Dynamics in Protozoan Parasites. Adapt or Perish.Genes (Basel). 2018 Dec 27;10(1):16. doi: 10.3390/genes10010016. Genes (Basel). 2018. PMID: 30591699 Free PMC article. Review.
-
Human plasma plasminogen internalization route in Plasmodium falciparum-infected erythrocytes.Malar J. 2020 Aug 26;19(1):302. doi: 10.1186/s12936-020-03377-4. Malar J. 2020. PMID: 32847585 Free PMC article.
-
Breakdown in membrane asymmetry regulation leads to monocyte recognition of P. falciparum-infected red blood cells.PLoS Pathog. 2021 Feb 18;17(2):e1009259. doi: 10.1371/journal.ppat.1009259. eCollection 2021 Feb. PLoS Pathog. 2021. PMID: 33600495 Free PMC article.
-
Promises and Pitfalls of Parasite Patch-clamp.Trends Parasitol. 2021 May;37(5):414-429. doi: 10.1016/j.pt.2021.02.002. Epub 2021 Feb 24. Trends Parasitol. 2021. PMID: 33640269 Free PMC article. Review.
-
Conditional permeabilization of the P. falciparum plasma membrane in infected cells links cation influx to reduced membrane integrity.PLoS One. 2023 Apr 4;18(4):e0283776. doi: 10.1371/journal.pone.0283776. eCollection 2023. PLoS One. 2023. PMID: 37014920 Free PMC article.
References
-
- Alkhalil A, Cohn JV, Wagner MA, Cabrera JS, Rajapandi T, Desai SA. Plasmodium falciparum likely encodes the principal anion channel on infected human erythrocytes. Blood. 2004;104:4279–4286. - PubMed
-
- Anjaneyulu PS, Staros JV. Reactions of N-hydroxysulfosuccinimide active esters. Int J Pept Protein Res. 1987;30:117–124. - PubMed
-
- Benjamini Y, Krieger AM, Yekutieli D. Adaptive linear step-up procedures that control the false discovery rate. Biometrika. 2006;93:491–507.
Publication types
MeSH terms
Substances
Grants and funding
LinkOut - more resources
Full Text Sources
Other Literature Sources
