. 2018 Sep;57(9):459-470.
doi: 10.1002/gcc.5. Epub 2018 Jul 30.

Copy number variant analysis using genome-wide mate-pair sequencing

Affiliations

Copy number variant analysis using genome-wide mate-pair sequencing

James B Smadbeck et al. Genes Chromosomes Cancer. 2018 Sep.

Abstract

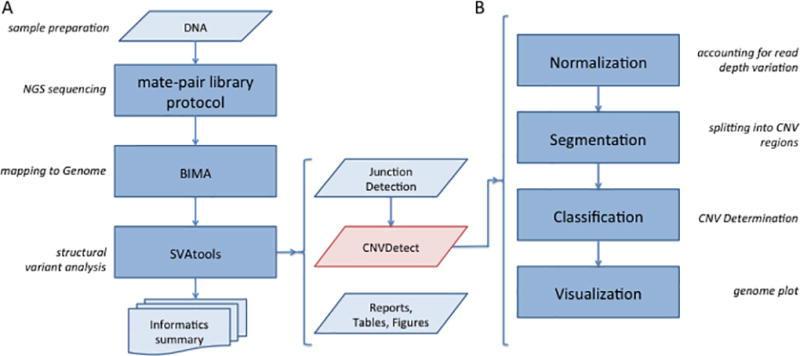
Copy number variation (CNV) is a common form of structural variation detected in human genomes, occurring as both constitutional and somatic events. Cytogenetic techniques like chromosomal microarray (CMA) are widely used in analyzing CNVs. However, CMA techniques cannot resolve the full nature of these structural variations (i.e. the orientation and location of associated breakpoint junctions) and must be combined with other cytogenetic techniques, such as karyotyping or FISH, to do so. This makes the development of a next-generation sequencing (NGS) approach capable of resolving both CNVs and breakpoint junctions desirable. Mate-pair sequencing (MPseq) is a NGS technology designed to find large structural rearrangements across the entire genome. Here we present an algorithm capable of performing copy number analysis from mate-pair sequencing data. The algorithm uses a step-wise procedure involving normalization, segmentation, and classification of the sequencing data. The segmentation technique combines both read depth and discordant mate-pair reads to increase the sensitivity and resolution of CNV calls. The method is particularly suited to MPseq, which is designed to detect breakpoint junctions at high resolution. This allows for the classification step to accurately calculate copy number levels at the relatively low read depth of MPseq. Here we compare results for a series of hematological cancer samples that were tested with CMA and MPseq. We demonstrate comparable sensitivity to the state-of-the-art CMA technology, with the benefit of improved breakpoint resolution. The algorithm provides a powerful analytical tool for the analysis of MPseq results in cancer.

Keywords: bioinformatics; cancer genetics; chromosomal rearrangements; copy number variant analysis; next-generation sequencing.


Figures

Figure 1
Figure 1. Flow diagram for CNVDetect detection algorithm
1A) The BMD SV Pipeline is presented in four stages: Library Protocol, NGS Sequencing, Mapping, and SV Analysis. CNVDetect’s place in the overall pipeline is highlighted in red. 1B) The CNVDetect algorithm proceeds in four stages: Normalization, Segmentation, Classification, and Visualization. It depends on output from the previous stages in the BMD SV Pipeline as well as from the Junction Detection algorithm within SVAtools.
Figure 2
Figure 2. Visualization of BMD SV Pipeline results for MPseq data
2A) The output of the BMD SV Pipeline for case EV88086 is presented as a genome plot. This plot depicts the read depth of the sequencing data as dots along a chromosome’s length. A magenta line is drawn where there is evidence of a chromosomal junction between two disparate locations in the genome. Regions where CNVs have been detected by the CNVDetect algorithm are colored red to indicate a loss in genomic material and blue to indicate a gain in genetic material. 2B) For comparison the CMA data for EV88086 is provided as visualized by ChAS.
Figure 3
Figure 3. CNV edge location comparison
3A) The genome plot for EV88090 is depicted, which contains a Philadelphia chromosome t(9;22) (q34;q11) (magenta line connecting chromosomes 9 and 22). This event is balanced, but results in small regions of loss in both chromosome 9 and chromosome 22 (colored red in both locations). 3B) A junction plot for one of the junctions is provided. The orange dots indicate where CMA determined the CNV edges resulting from this translocation to be. The green dots indicate where CNVDetect determined the CNV edges to be. The blue dots indicate where a split read found sequence evidence for the exact location of the junction locations.
Figure 4
Figure 4. Complex case elucidated by SVAtools
4A) A complex rearrangement between chromosomes 5 and 6 is depicted. Two junctions connecting the chromosomes are shown as magenta lines. We identify two breakpoint locations without junctions in CNVDetect (green arrows) using traditional statistical CNV segmentation techniques. 4B) A junction plot depicting the two regions around the green arrows is provided. Supporting fragments for the missing junction are shown as two black lines that span the two regions.

References

    1. Kandoth C, McLellan MD, Vandin F, et al. Mutational landscape and significance across 12 major cancer types. Nature. 2013;502(7471):333–339. - PMC - PubMed
    1. Killcoyne S, del Sol A. Identification of large-scale genomic variation in cancer genomes using in silico reference models. Nucleic Acids Research. 2016;44(1):e5–e5. - PMC - PubMed
    1. Moncunill V, Gonzalez S, Bea S, et al. Comprehensive characterization of complex structural variations in cancer by directly comparing genome sequence reads. Nat Biotech. 2014;32(11):1106–1112. - PubMed
    1. Tubio JMC. Somatic structural variation and cancer. Briefings in Functional Genomics. 2015;14(5):339–351. - PubMed
    1. Yang L, Luquette LJ, Gehlenborg N, et al. Diverse mechanisms of somatic structural variations in human cancer genomes. Cell. 2013;153(4):919–929. - PMC - PubMed

Publication types

LinkOut - more resources