. 2018 Jul 1;103(7):2601-2612.
doi: 10.1210/jc.2018-00258.

Melanocortin 4 Receptor Pathway Dysfunction in Obesity: Patient Stratification Aimed at MC4R Agonist Treatment

Affiliations

Melanocortin 4 Receptor Pathway Dysfunction in Obesity: Patient Stratification Aimed at MC4R Agonist Treatment

Kristin L Ayers et al. J Clin Endocrinol Metab. .

Abstract

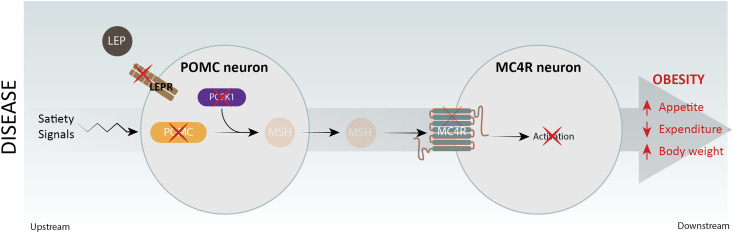
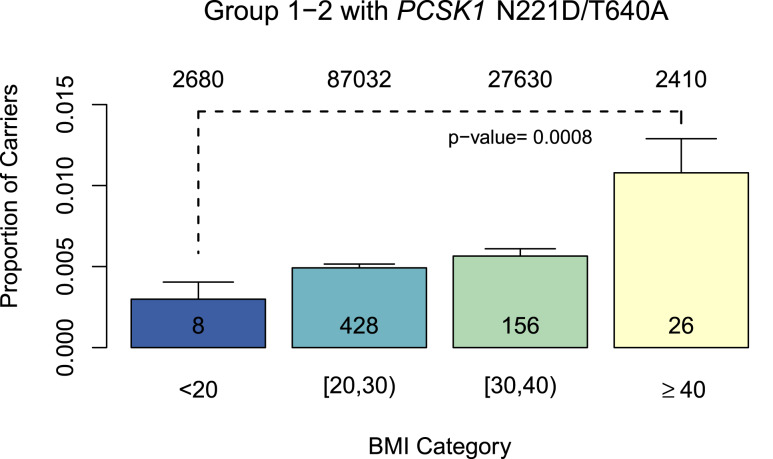
Context: The hypothalamic melanocortin 4 receptor (MC4R) pathway serves a critical role in regulating body weight. Loss of function (LoF) mutations in the MC4R pathway, including mutations in the pro-opiomelanocortin (POMC), prohormone convertase 1 (PCSK1), leptin receptor (LEPR), or MC4R genes, have been shown to cause early-onset severe obesity.

Methods: Through a comprehensive epidemiological analysis of known and predicted LoF variants in the POMC, PCSK1, and LEPR genes, we sought to estimate the number of US individuals with biallelic MC4R pathway LoF variants.

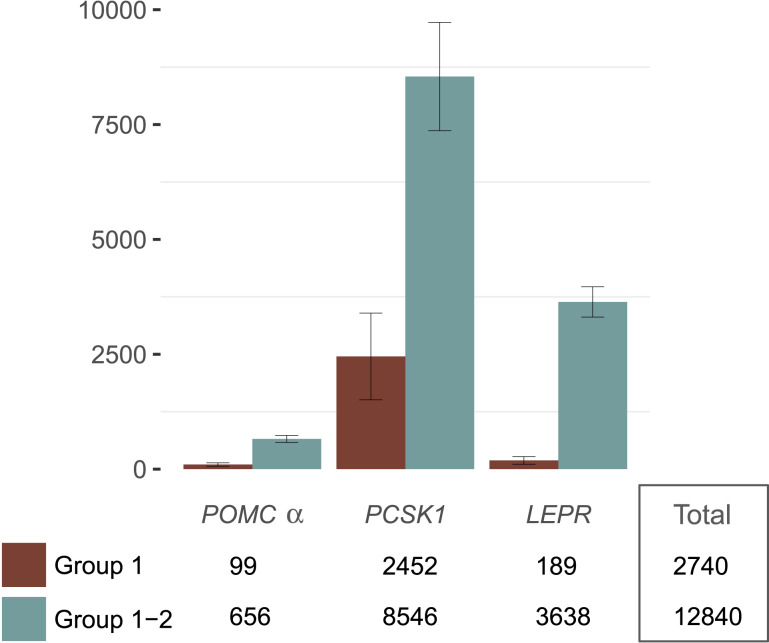
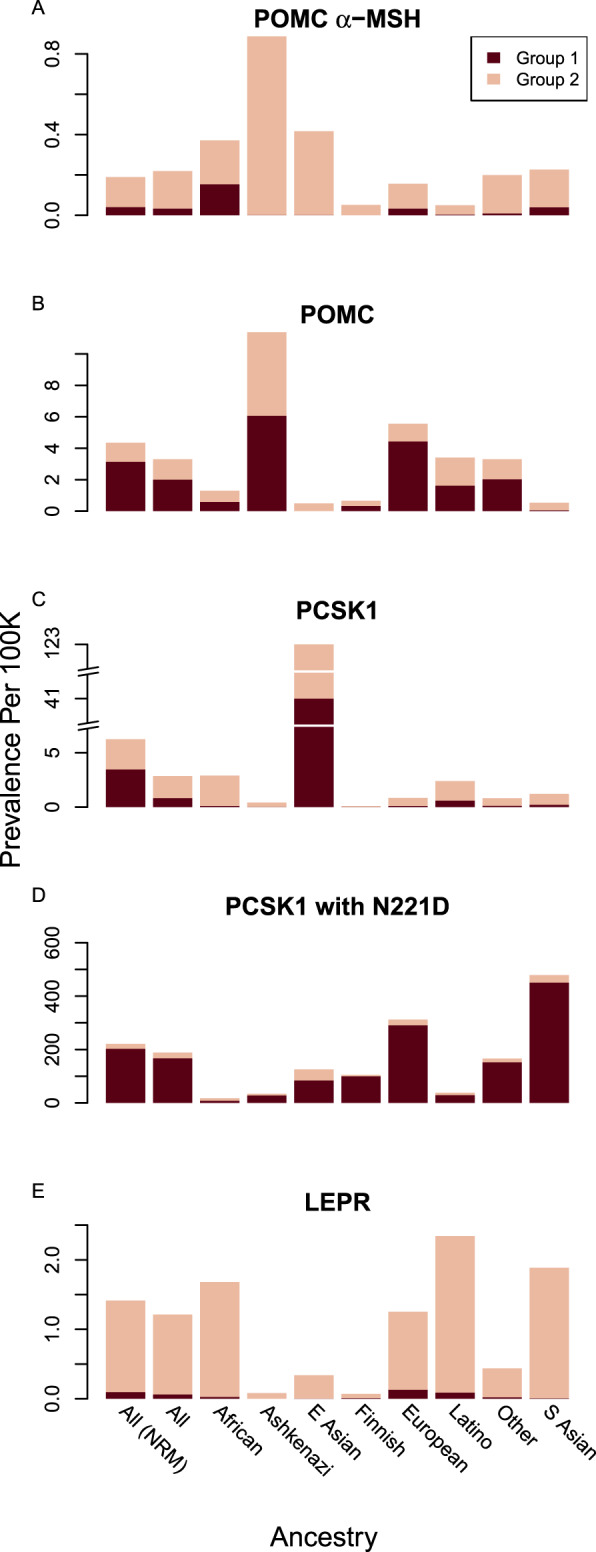
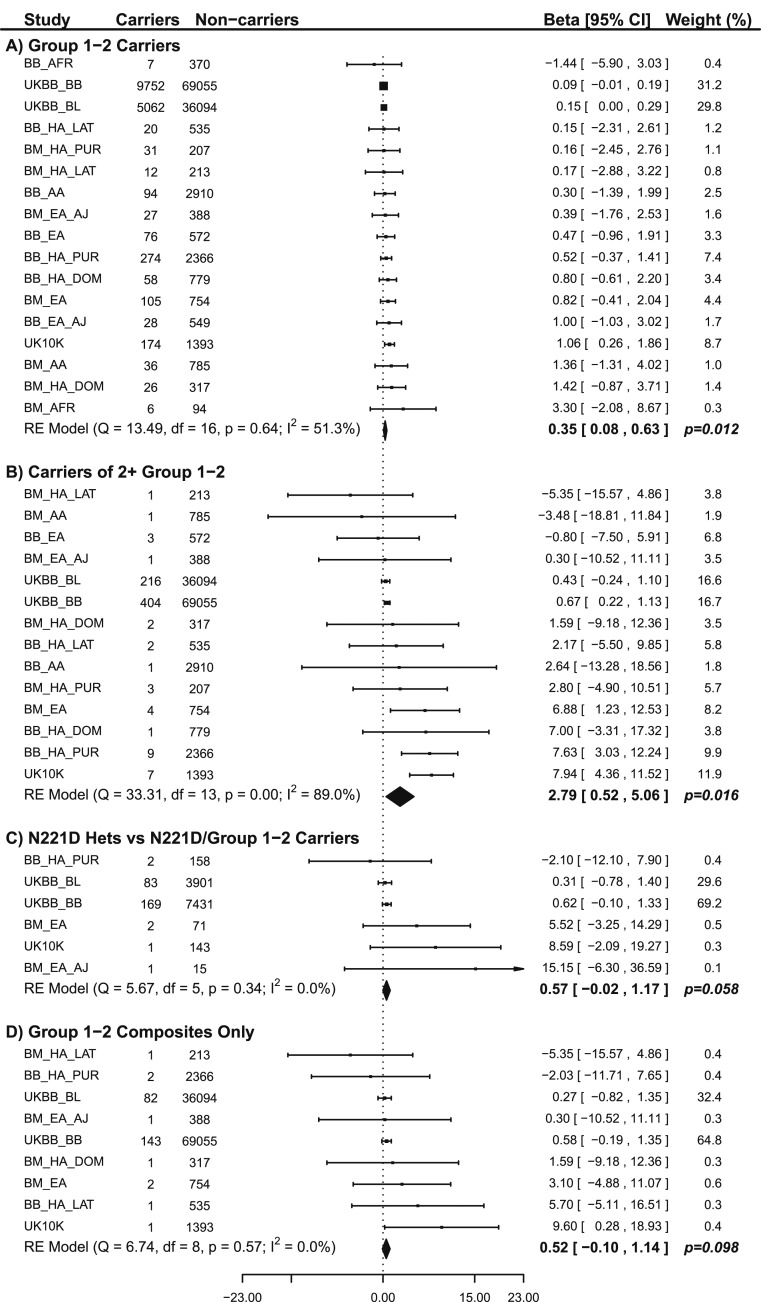
Results: We predict ~650 α-melanocyte-stimulating hormone (MSH)/POMC, 8500 PCSK1, and 3600 LEPR homozygous and compound heterozygous individuals in the United States, cumulatively enumerating >12,800 MC4R pathway-deficient obese patients. Few of these variants have been genetically diagnosed to date. These estimates increase when we include a small subset of less rare variants: β-MSH/POMC,PCSK1 N221D, and a PCSK1 LoF variant (T640A). To further define the MC4R pathway and its potential impact on obesity, we tested associations between body mass index (BMI) and LoF mutation burden in the POMC, PCSK1, and LEPR genes in various populations. We show that the cumulative allele burden in individuals with two or more LoF alleles in one or more genes in the MC4R pathway are predisposed to a higher BMI than noncarriers or heterozygous LoF carriers with a defect in only one gene.

Conclusions: Our analysis represents a genetically rationalized study of the hypothalamic MC4R pathway aimed at genetic patient stratification to determine which obese subpopulations should be studied to elucidate MC4R agonist (e.g., setmelanotide) treatment responsiveness.


Figures

Figure 1.
Figure 1.
Schematic outline of the hypothalamic MC4R pathway with POMC, PCSK1, LEPR, Leptin (LEP), and the MC4R as critical mediators of appetite, energy expenditure, and body weight. Red crosses on each gene indicate that genetic evidence is available linking a genetic deficiency in each gene with severe early-onset childhood obesity and hyperphagia.
Figure 2.
Figure 2.
Prevalence estimations of group 1 and 2 predicted patient populations in the United States. Based on a US population of ~300 million, the estimated numbers of homozygotes and compound heterozygotes (error bars represent 95% CIs).
Figure 3.
Figure 3.
Stacked barplots for prevalence estimates of homozygous and compound heterozygous carriers of group 1 and 2 variants, listed separately, in (A)POMCα-MSH, (B)POMC, (C)PCSK1 without N221D, (D)PCSK1 with N221D, and (E)LEPR, based on the gnomAD database, which includes estimated ancestry data on a number of US races and ethnicities. Prevalence is reported as the number of homozygous and compound heterozygous LoF genotyped individuals per 100,000 individuals within each group. The “All” group is based on the overall gnomAD allele frequencies, and the “All (NRM)” group is based on nonrandom mating within ethnicities given the estimated percentage of individuals within each ethnic group in the United States. E, East; S, South.
Figure 4.
Figure 4.
Forest plots for (A) effects of carrying one or more group 1 plus group 2 variants vs WT for all group 1 plus group 2 variants; (B) effects of carrying two or more group 1 plus group 2 variants vs WT for all group 1 plus group 2 variants; (C) effects of carrying only one copy ofPCSK1 N221D plus another group 1 or group 2 variant vs N221D heterozygotes; and (D) effects of carrying two group 1 plus group 2 variants from different genes vs WT for all group 1 plus group 2 variants. The forest plots represent the estimated effect sizes and CIs for each dataset and subgroup. Groups that did not have any individuals with the tested variants are not represented in the plots. Each dataset is assigned a weight based on the inverse of the variance in the estimate, and thus larger or more homogenous datasets tend to have larger weights. The overall effect size andP value are a weighted average of these studies. A test of heterogeneity was also performed to determine whether the different studies had significantly different estimated effects (theI2 statistic describes the percentage of variation across studies that is due to heterogeneity rather than chance). Beta reflects the BMI shift. AA, black or African American from the United States; AFR, black or African American not from the United States with high African ancestry; BB, MSH Biobank; BM, MSH BioMe Biobank; EA, white of European descent; EA_AJ, white of Jewish descent; HA_DOM, Hispanic from the Dominican Republic; HA_LAT, Hispanic from Central or South America not identifying as white; HA_PUR, Hispanic from Puerto Rico; UKBB, UK Biobank; UKBB_BB, UK Biobank array; UKBB_BL, BiLEVE array.
Figure 5.
Figure 5.
The proportion of individuals in the UK Biobank carrying two or more group 1 and 2 variants (plusPCSK1 N221D and T640A) across the three genes for BMI category (comparison of BMI <20, 20–30, 30–40, and ≥40 kg/m2). For groups 1 and 2, the carrier frequency tends to increase as BMI increases, and there is a significant difference in the carrier frequencies between the BMI <20 and BMI >40 groups (error bars represent 95% CIs). Analyzing group 1 data only did not reveal a significant difference between the groups, because of the low numbers or absence of group 1 homozygotes, heterozygotes, or composites in the BMI <20 kg/m2 and BMI >40 kg/m2 groups. The total number of noncarriers (top) and carriers (bottom) for each BMI category are shown in the columns.

References

    1. Kühnen P,Clément K,Poitou-Bernert C,Fiedorek F,Van Der Ploeg LH,Connors H,Gottesdiener K,Farooqi S,Wiegand S,Grüters A,Krude H Proof of concept for treatment of a second rare genetic disorder of the leptin-melanocortin pathway: successful therapy of extreme obesity in a leptin-receptor (LepR) deficient patient with setmelanotide. Available at:www.rhythmtx.com/wp-content/uploads/2017/03/2017-11-ObesityWeek-Rhythm-K.... Accessed 16 May 2018.
    1. Kühnen P,Clément K,Wiegand S,Blankenstein O,Gottesdiener K,Martini LL,Mai K,Blume-Peytavi U,Grüters A,Krude H. Proopiomelanocortin deficiency treated with a melanocortin-4 receptor agonist.N Engl J Med.2016;375(3):240–246. - PubMed
    1. Collet T-H,Dubern B,Mokrosinski J,Connors H,Keogh JM,Mendes de Oliveira E,Henning E,Poitou-Bernert C,Oppert J-M,Tounian P,Marchelli F,Alili R,Le Beyec J,Pépin D,Lacorte J-M,Gottesdiener A,Bounds R,Sharma S,Folster C,Henderson B,O’Rahilly S,Stoner E,Gottesdiener K,Panaro BL,Cone RD,Clément K,Farooqi IS,Van der Ploeg LHT. Evaluation of a melanocortin-4 receptor (MC4R) agonist (setmelanotide) in MC4R deficiency.Mol Metab.2017;6(10):1321–1329. - PMC - PubMed
    1. Farooqi IS,O’Rahilly S. Mutations in ligands and receptors of the leptin-melanocortin pathway that lead to obesity.Nat Clin Pract Endocrinol Metab.2008;4(10):569–577. - PubMed
    1. Walley AJ,Asher JE,Froguel P. The genetic contribution to non-syndromic human obesity.Nat Rev Genet.2009;10(7):431–442. - PubMed

Publication types

MeSH terms