. 2018 Aug 1;114(10):1360-1371.
doi: 10.1093/cvr/cvy109.

Immune cell census in murine atherosclerosis: cytometry by time of flight illuminates vascular myeloid cell diversity

Affiliations

Immune cell census in murine atherosclerosis: cytometry by time of flight illuminates vascular myeloid cell diversity

Jennifer E Cole et al. Cardiovasc Res. .

Abstract

Aims: Atherosclerosis is characterized by the abundant infiltration of myeloid cells starting at early stages of disease. Myeloid cells are key players in vascular immunity during atherogenesis. However, the subsets of vascular myeloid cells have eluded resolution due to shared marker expression and atypical heterogeneity in vascular tissues. We applied the high-dimensionality of mass cytometry to the study of myeloid cell subsets in atherosclerosis.

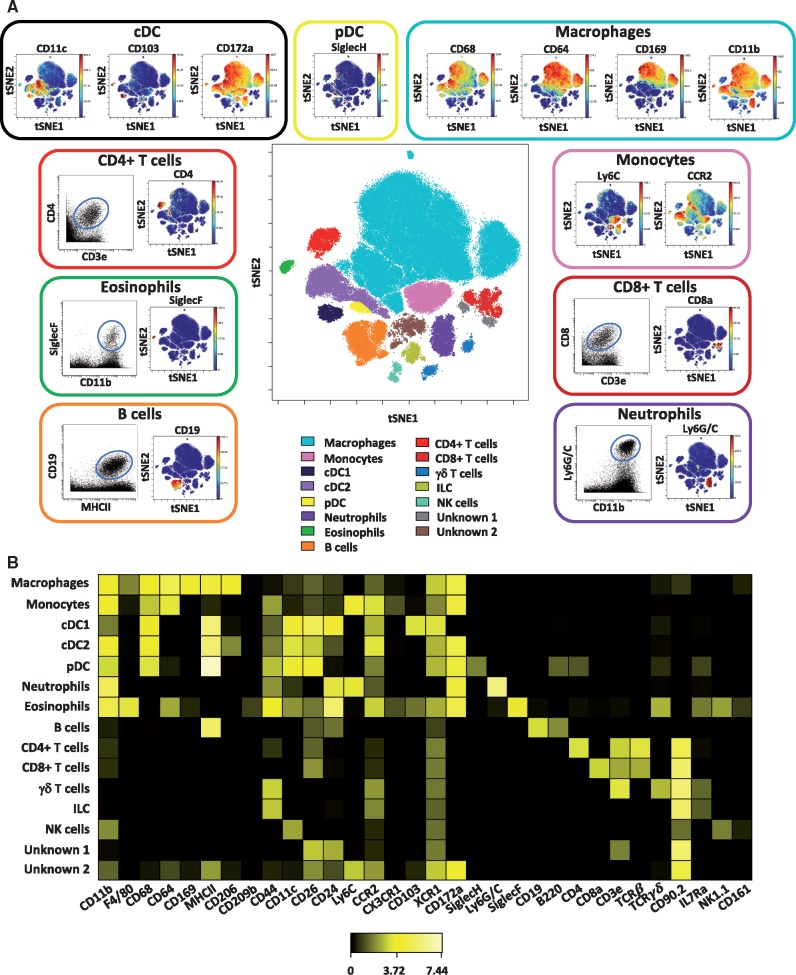
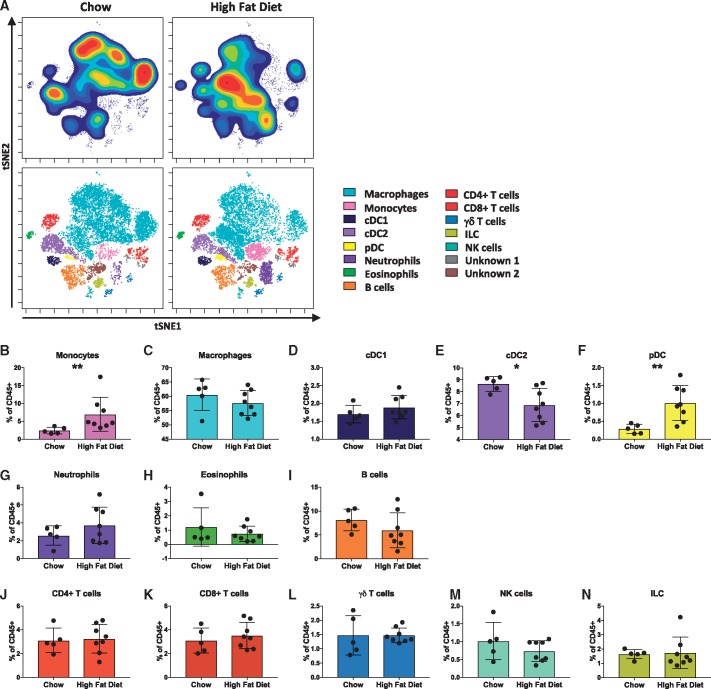
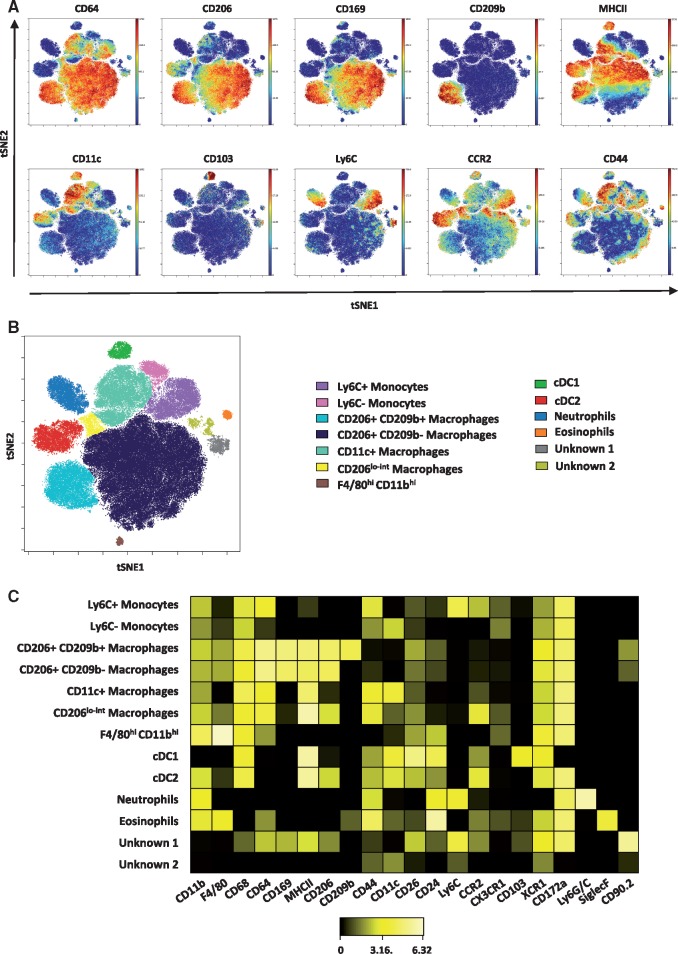
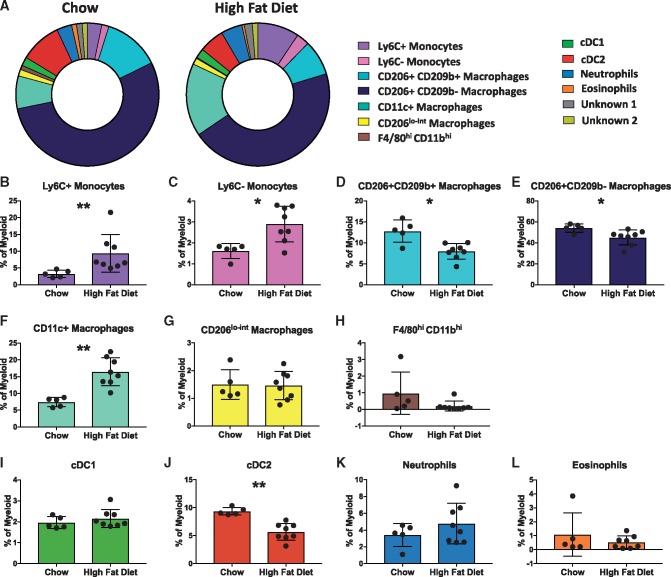
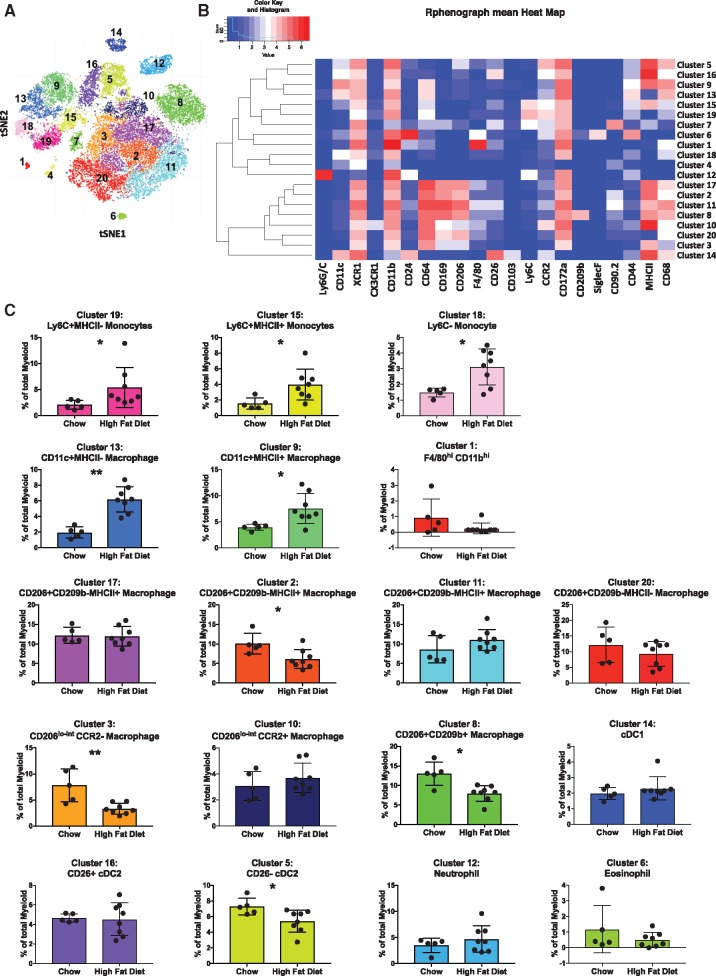
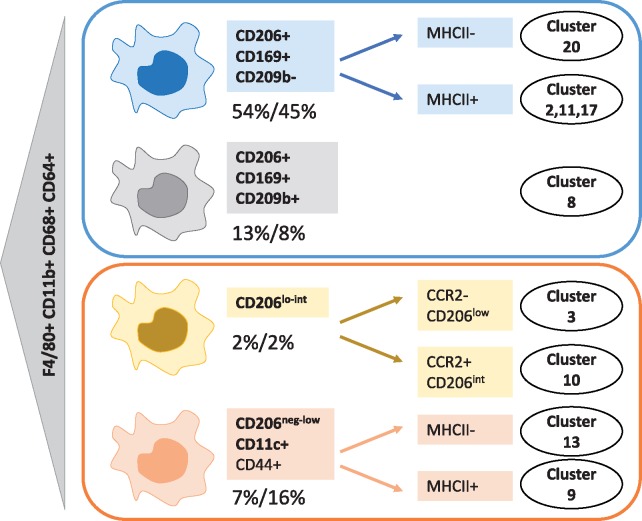
Methods and results: Apolipoprotein E-deficient (ApoE-/-) mice were fed a chow or a high fat (western) diet for 12 weeks. Single-cell aortic preparations were probed with a panel of 35 metal-conjugated antibodies using cytometry by time of flight (CyTOF). Clustering of marker expression on live CD45+ cells from the aortas of ApoE-/- mice identified 13 broad populations of leucocytes. Monocyte, macrophage, type 1 and type 2 conventional dendritic cell (cDC1 and cDC2), plasmacytoid dendritic cell (pDC), neutrophil, eosinophil, B cell, CD4+ and CD8+ T cell, γδ T cell, natural killer (NK) cell, and innate lymphoid cell (ILC) populations accounted for approximately 95% of the live CD45+ aortic cells. Automated clustering algorithms applied to the Lin-CD11blo-hi cells revealed 20 clusters of myeloid cells. Comparison between chow and high fat fed animals revealed increases in monocytes (both Ly6C+ and Ly6C-), pDC, and a CD11c+ macrophage subset with high fat feeding. Concomitantly, the proportions of CD206+ CD169+ subsets of macrophages were significantly reduced as were cDC2.

Conclusions: A CyTOF-based comprehensive mapping of the immune cell subsets within atherosclerotic aortas from ApoE-/- mice offers tools for myeloid cell discrimination within the vascular compartment and it reveals that high fat feeding skews the myeloid cell repertoire toward inflammatory monocyte-macrophage populations rather than resident macrophage phenotypes and cDC2 during atherogenesis.


Figures

Figure 1
Figure 1
High-dimensional characterization of leucocyte populations in murine atherosclerotic aortas by mass cytometry. Single-cell suspensions of aortas from ApoE−/− mice fed either a chow or high fat diet were stained with a panel of 35 antibodies. For each sample, cells from two aortas were pooled. (A) Live CD45+ cells concatenated from the aortas of all ApoE−/− mice studied (both chow and high fat fed) (n = 13) were clustered using viSNE on expression of 35 cell surface and intracellular markers outlined in see Supplementary material online, Table S1. The analysis identifies 15 populations including myeloid, lymphocyte, and unknown subsets (centre plot). The selected populations are displayed in a viSNE dot plot showing the expression level of their major markers with or without a representative dot plot showing two relevant cell population markers (outer plots). (B) Heatmap showing the relative expression level of 32 cell markers within the 15 cell subsets identified by the viSNE clustering shown in (A).
Figure 2
Figure 2
High fat feeding alters the immune cell composition of ApoE−/− mice aortas. Single-cell suspensions of aortas from ApoE−/− mice fed either a chow or high fat diet were stained with a panel of 35 antibodies. For each sample, cells from two aortas were pooled. (A) viSNE plots of clustered CD45+ leucocytes are displayed for representative chow and high fat diet fed ApoE−/− mice, showing cell density of the population clusters. (BN) Bar graphs showing the changes in abundance of the cell populations identified in the viSNE clustering outlined in Figure 1, between chow and high fat diet fed mice: monocytes (B), macrophages (C), conventional type 1 dendritic cells (cDC1) (D), conventional type 2 dendritic cells (cDC2) (E), pDC (F), neutrophils (G), eosinophils (H), B cells (I), CD4+ T cells (J), CD8+ T cells (K), γδ T cells (L), natural killer (NK) cells (M), and ILC) (N) Data are presented as mean± SD. Dots represent individual samples, n = 5–8, *P < 0.05, **P < 0.01.
Figure 3
Figure 3
Mass cytometry reveals five macrophage subsets in the atherosclerotic aorta. (A) Myeloid cells were gated as Lin-CD11blo-hi concatenated from the aortas of all ApoE−/− mice studied (n = 13) and clustered using viSNE on the expression of 21 cell surface and intracellular markers outlined in see Supplementary material online, Table S1. Expression levels of selected myeloid markers in the resulting viSNE clustered cell populations is shown. (B) 13 cell populations consist of monocytes (Ly6C+ and Ly6C), conventional type 1 and type 2 dendritic cells (cDC1 and cDC2), granulocytes (neutrophils and eosinophils), five macrophage subsets and two unidentified populations. (C) Heatmap showing the relative expression level of 21 cell markers within the 13 myeloid cell subsets identified by the viSNE clustering shown in (B).
Figure 4
Figure 4
High fat feeding reshapes the myeloid cell composition of murine atherosclerotic aortas. (A) Doughnut plots show the proportions of the 13 myeloid cell populations from the viSNE analysis in the aortas of chow and high fat diet fed ApoE−/− mice. (B–L) Bar graphs showing the changes in abundance of the cell populations identified in the viSNE clustering outlined in Figure 3, between chow and high fat diet fed mice: Ly6C+ monocytes (B), Ly6C monocytes (C), CD206+ CD169+CD209b+ macrophages (D), CD206+CD169+CD209b macrophages (E), CD11c+ macrophages (F), CD206lo-int macrophages (G), F4/80hi CD11bhi macrophages (H), conventional type 1 dendritic cells (cDC1) (I), conventional type 2 dendritic cells (cDC2) (J), neutrophils (K), and eosinophils (L). Data are presented as mean± SD. Dots represent individual samples, n = 5–8 *P < 0.05, **P < 0.01.
Figure 5
Figure 5
Unbiased multi-dimensional analysis by CyTOFkit Phenograph reveals 20 myeloid cell populations in murine atherosclerotic aortas. (A) Files containing the myeloid-gated cells used for the viSNE clustering in Figure 3 were exported from Cytobank into R. Myeloid cells were clustered on the same cell markers as the viSNE analysis in Figure 3 using Phenograph, an element of the Cytofkit Bioconductor package. Shown is the resulting t-SNE plot highlighting the 20 cell clusters identified by phenograph. (B) Heatmap showing the expression levels of 21 myeloid markers in the 20 identified cell clusters (C). 18 of the 20 cell clusters are identified by their marker expression levels and the changes in abundance of each population between chow and high fat diet fed mice is shown. The analysis sub-divides CD206+ CD169+CD209b MHCII+ macrophages into three clusters by the expression of CD90.2, CD26, F4/80, and CD68. CD11c+ macrophages and Ly6C+ monocytes are separately into two clusters by MHCII expression. Conventional type type 2 dendritic cells (cDC2) are also divided into two clusters by CD26. Data are presented as mean ± SD. Dots represent individual samples, n = 5–8 *P < 0.05, **P < 0.01.
Figure 6
Figure 6
Schematic diagram showing macrophage subsets identified in aortas of ApoE−/− mice. viSNE and phenograph analysis of Lin-CD11blo-hi cells from ApoE−/− mice fed a chow and high fat diet revealed the presence of four subsets of macrophages. Percentages shown represent the average proportion of each subset in aortas of either chow (left number, n = 5) or high fat (right number, n = 8) fed ApoE−/− mice. Where phenograph could identify multiple clusters within a subset the main differences between the clusters is shown. Macrophage cluster numbers assigned by phenograph (Figure 5) are shown against each subset/cluster.

Comment in

References

    1. Collaborators GBDCoD. Global, regional, and national age-sex specific mortality for 264 causes of death, 1980-2016: a systematic analysis for the Global Burden of Disease Study 2016. Lancet 2017;390:1151–1210. - PMC - PubMed
    1. Ridker PM, Everett BM, Thuren T, MacFadyen JG, Chang WH, Ballantyne C, Fonseca F, Nicolau J, Koenig W, Anker SD, Kastelein JJP, Cornel JH, Pais P, Pella D, Genest J, Cifkova R, Lorenzatti A, Forster T, Kobalava Z, Vida-Simiti L, Flather M, Shimokawa H, Ogawa H, Dellborg M, Rossi PRF, Troquay RPT, Libby P, Glynn RJ.. CANTOS Trial Group. Antiinflammatory Therapy with Canakinumab for Atherosclerotic Disease. N Engl J Med 2017;377:1119–1131. - PubMed
    1. Mosser DM, Edwards JP.. Exploring the full spectrum of macrophage activation. Nat Rev Immunol 2008;8:958–969. - PMC - PubMed
    1. Moore KJ, Sheedy FJ, Fisher EA.. Macrophages in atherosclerosis: a dynamic balance. Nat Rev Immunol 2013;13:709–721. - PMC - PubMed
    1. Qiao JH, Tripathi J, Mishra NK, Cai Y, Tripathi S, Wang XP, Imes S, Fishbein MC, Clinton SK, Libby P, Lusis AJ, Rajavashisth TB.. Role of macrophage colony-stimulating factor in atherosclerosis: studies of osteopetrotic mice. Am J Pathol 1997;150:1687–1699. - PMC - PubMed

Publication types

MeSH terms