. 2018 May 3;173(4):1014-1030.e17.
doi: 10.1016/j.cell.2018.03.020.

Spliceosome Profiling Visualizes Operations of a Dynamic RNP at Nucleotide Resolution

Affiliations

Spliceosome Profiling Visualizes Operations of a Dynamic RNP at Nucleotide Resolution

Jordan E Burke et al. Cell. .

Abstract

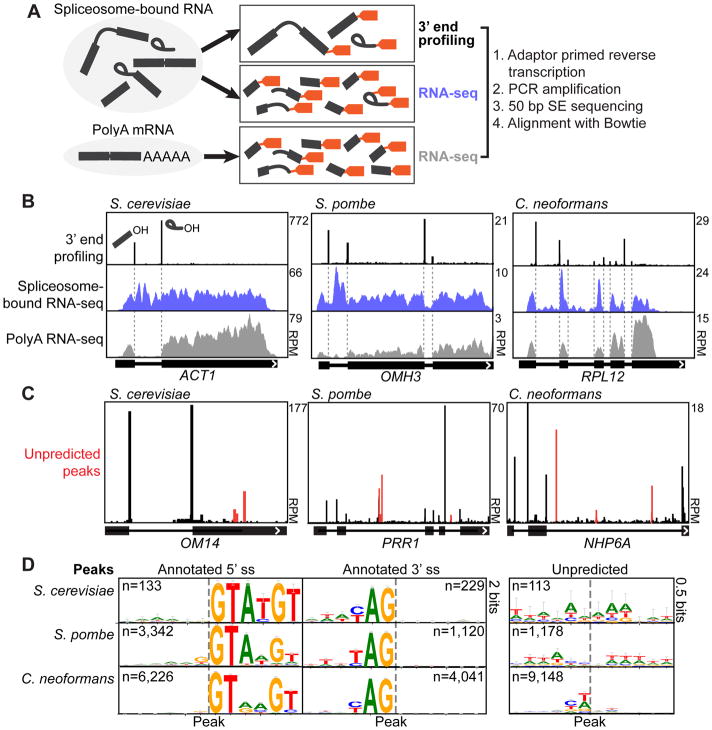
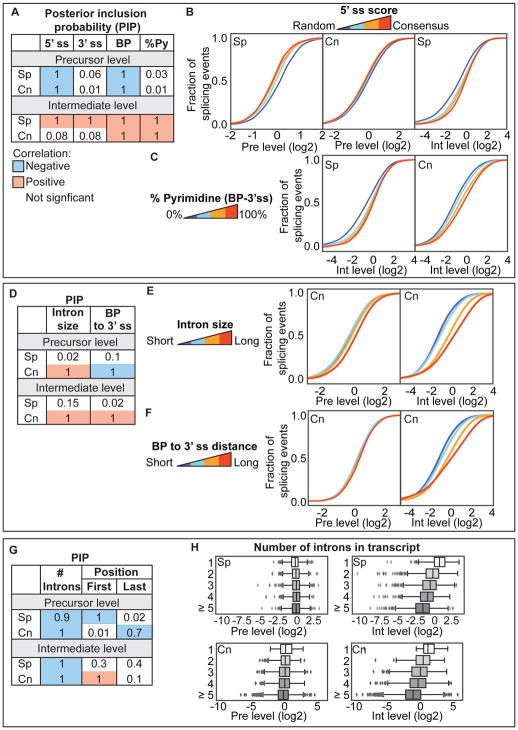
Tools to understand how the spliceosome functions in vivo have lagged behind advances in the structural biology of the spliceosome. Here, methods are described to globally profile spliceosome-bound pre-mRNA, intermediates, and spliced mRNA at nucleotide resolution. These tools are applied to three yeast species that span 600 million years of evolution. The sensitivity of the approach enables the detection of canonical and non-canonical events, including interrupted, recursive, and nested splicing. This application of statistical modeling uncovers independent roles for the size and position of the intron and the number of introns per transcript in substrate progression through the two catalytic stages. These include species-specific inputs suggestive of spliceosome-transcriptome coevolution. Further investigations reveal the ATP-dependent discard of numerous endogenous substrates after spliceosome assembly in vivo and connect this discard to intron retention, a form of splicing regulation. Spliceosome profiling is a quantitative, generalizable global technology used to investigate an RNP central to eukaryotic gene expression.

Keywords: pre-mRNA splicing; spliceosome; splicing catalysis; splicing fidelity.


Conflict of interest statement

Declaration of interests

The authors declare no competing interests.

Figures

Fig. 1
Fig. 1. Purification of active endogenous spliceosomes
A. Spliceosome assembly pathway indicating relevant substrate transformations and complexes. B. SDS-PAGE analysis of spliceosomes purified from C. neoformans extracts using FLAG-tagged Prp19. Proteins visualized using SYPRO Ruby. C. TMT-MS reveals that Prp19 associated splicing factors belong primarily to Bact, C and ILS complexes. Membership of S. cerevisiae orthologs in complexes was used to assign factors (see Fig. S1C). D. RNAs associated with Prp19 spliceosomes are enriched for transcripts containing annotated introns (KS test). E. Uses of Prp19-associated RNA in the spliceosome profiling suite.
Fig. 2
Fig. 2. 3′ end profiling reveals splicing intermediates and products
A. Strategies for 3′ end profiling and RNA-seq of spliceosome-bound and polyA RNA (see Methods for details). B. 3′ end profiling (black traces) reveals splicing intermediates (cleaved 5′ exon) and products (lariat intron) globally in the three indicated organisms. Spliceosome-bound (blue) and polyA (grey) RNA-seq coverage for each transcript are also shown. C. 3′ end profiling also discovers novel 3′ ends (red) that may be spliceosomal cleavages or transcript ends. D. Logos from predicted and unpredicted peaks detected by 3′ end profiling.
Fig. 3
Fig. 3. Branch and junction profiling confirm splicing events discovered by 3′ end profiling
A. Schematic of junction and branch profiling library preparation. Magenta arrows indicate reads that span exon-exon junctions and yellow arrows indicate reads that span branches. B. Overlap of junctions discovered by polyA vs. spliceosome-bound RNA-seq reproducible in two replicates. C. Comparison of RNA levels for transcripts with and without junctions detected only in spliceosome-bound (SB) RNA. Light and dark traces: biological replicate data (log2 transcript per million (TPM)). D. Example of an exon-exon junction and branch detected at an annotated introns in S. pombe and C. neoformans (PRA1: CNAG_04950). Purple and yellow curves are derived from junction BED files (junction profiling) or custom scripts (branch profiling) visualized with corresponding number of reads. E. Examples of junctions and branches that confirmed unannotated alternative 5′ splice sites in S. pombe and C. neoformans (GRB1: CNAG_03281). Peaks that align with other splicing events are black with other signals in grey. F. Likelihood that a given dinucleotide is overrepresented based on its frequency in the genome (displayed as a log(odds ratio)) immediately upstream and downstream of peaks (determined independently) in C. neoformans (see Fig. S3B for S. pombe). Unfiltered unpredicted peaks are enriched for pyrimidine rich dinucleotides (red letters) and splicing signal dinucleotides (black letters) while peaks with a junction or branch are only enriched for splicing signal dinucleotides.
Fig. 4
Fig. 4. Non-canonical splicing events
A. Splicing can be interrupted between the two steps (Kannan et al., 2013; Volanakis et al., 2013). B–D. Examples of interrupted splicing (black: 3′ end profiling, blue: spliceosome-bound RNA-seq, grey: polyA RNA-seq, purple: junction profiling). Number of reads corresponding to each junction (not normalized) is indicated. E. Example of recursive splicing in C. neoformans. Traces colored as above with branch profiling in yellow. Grey peaks correspond to putative 3′ RNA ends based on the profile of the spliceosome-bound RNA-seq. F. Example of a splicing event resulting in exclusion of an exon in C. neoformans. G. Nested intron inside a large (391 nt) intron. Traces colored as above. H. Example of early branches resulting in branch to 3′ss distances are larger than typical range of 15–30 nt.
Fig. 5
Fig. 5. Quantitation of spliceosome-bound precursor and intermediate
A. Quantitating levels of precursor and intermediate at each splice site. Precursor is determined by counting reads that start downstream of the splice site and end upstream. Intermediate is determined by counting reads that begin at the splice site. Each read begins with a barcode (rainbow colors). B. Reproducibility and distribution of precursor and intermediate levels in S. pombe (see Fig. S5A–B for other yeast). Points represent splicing events. Annotated introns in any transcript with at least one detected high-confidence splicing event are included to avoid bias against splicing events with low intermediate accumulation. C. Correlation of precursor, intermediate and spliceosome-bound transcript levels with the abundance of the mature transcript as determined by polyA RNA-seq (log2 transform). D. Correlation of polyA RNA-seq with intermediate levels in S. cerevisiae. Grey indicates 95% confidence interval from linear regression. E. Correlation of precursor and intermediate levels with spliceosome-bound transcript levels (log2 transforms).
Fig. 6
Fig. 6. Relationship between intron features and splicing efficiency
A. Posterior inclusion probabilities (PIPs) for Bayesian Model Averaging of the relationship between 5′ss, 3′ss and BP scores and % pyrimidine between the BP and 3′ss and precursor/intermediate levels. Intron features with a PIP higher than 0.5 are highlighted (see also Fig. S6A). B. Relationship between precursor and intermediate levels and 5′ss scores. Introns were split into quartiles based on 5′ss score (blue=random, red=consensus) and the distribution of each metric is plotted as a CDF (See Fig. S6B–C for BP and 3′ss scores, Sp=S. pombe and Cn=C. neoformans). C. Same as B but for the % pyrimidine between the BP and the 3′ ss. D. PIPs for intron size and the distance between the BP and 3′ss. E. Relationship between precursor and intermediate levels and intron length in C. neoformans. Introns were split into quartiles based on length (blue=short, red=long). F. Same as E but for BP to 3′ss distance. G. PIPs for the number of introns in the transcript and the relative position of the intron in the transcript. H. Difference in precursor and intermediate levels based on the number of introns in the transcript (See Fig. S6F–G for alternative splicing and position in transcript).
Fig. 7
Fig. 7. Spliceosomal discard in vivo
A. Intron retention correlates with precursor level in S. pombe and C. neoformans but not S. cerevisiae. Introns were split into quartiles based on intron retention in polyA RNA-seq. Distribution of precursor level in each quartile is plotted as a CDF (See Fig. S7E for intermediate level). B. Simplified model of Prp43 mediated discard from the spliceosome, which predicts that disabling the ATPase activity of Prp43 will cause precursor and intermediates to accumulate on spliceosomes. C. Growth of strains expressing prp43-Q435E or prp43DN from the URA5 locus in glucose or galactose media and number of reads corresponding to prp43-DN (compared to the wild type sequence) in each condition in polyA RNA-seq. D. Heatmap of the log2 ratio of precursor and intermediate in the prp43DN strains vs. wild type grown in glucose (K-means clustering, see Methods). E. CDF plots of precursor and intermediate in prp43DN (red) and wild type (black) in glucose for cluster 1 (top panel) and cluster 2 (bottom panel) where intermediate or precursor, respectively, is increased in the prp43DN strains. P-values: KS test. F. Intron size and BP to 3′ss distance for each cluster compared to all introns for cluster 1 (top panel) and cluster 2 (bottom panel). P-values: Mann-Whitney U test.

Comment in

  • Scrutinizing spliceosomes.
    Furlong R. Furlong R. Nat Rev Genet. 2018 Jul;19(7):401. doi: 10.1038/s41576-018-0019-9. Nat Rev Genet. 2018. PMID: 29765162 No abstract available.

References

    1. Akiyama M, Nakashima H. Molecular cloning of thi-4, a gene necessary for the biosynthesis of thiamine in Neurospora crassa. Curr Genet. 1996;30:62–67. - PubMed
    1. Anders S, Pyl PT, Huber W. HTSeq--a Python framework to work with high-throughput sequencing data. Bioinformatics. 2015;31:166–169. - PMC - PubMed
    1. Aslanzadeh V, Huang Y, Sanguinetti G, Beggs JD. Transcription Rate Strongly Affects Splicing Fidelity and Co-transcriptionality in Budding Yeast. Genome Res. 2017;28:203–213. - PMC - PubMed
    1. Awan AR, Manfredo A, Pleiss JA. Lariat sequencing in a unicellular yeast identifies regulated alternative splicing of exons that are evolutionarily conserved with humans. Proc Natl Acad Sci U S A. 2013;110:12762–12767. - PMC - PubMed
    1. Bejar R. Splicing Factor Mutations in Cancer. Advances in experimental medicine and biology. 2016;907:215–228. - PubMed

Publication types

MeSH terms