. 2018 May 3;102(5):874-889.
doi: 10.1016/j.ajhg.2018.03.012.

Profiling and Leveraging Relatedness in a Precision Medicine Cohort of 92,455 Exomes

Affiliations

Profiling and Leveraging Relatedness in a Precision Medicine Cohort of 92,455 Exomes

Jeffrey Staples et al. Am J Hum Genet. .

Abstract

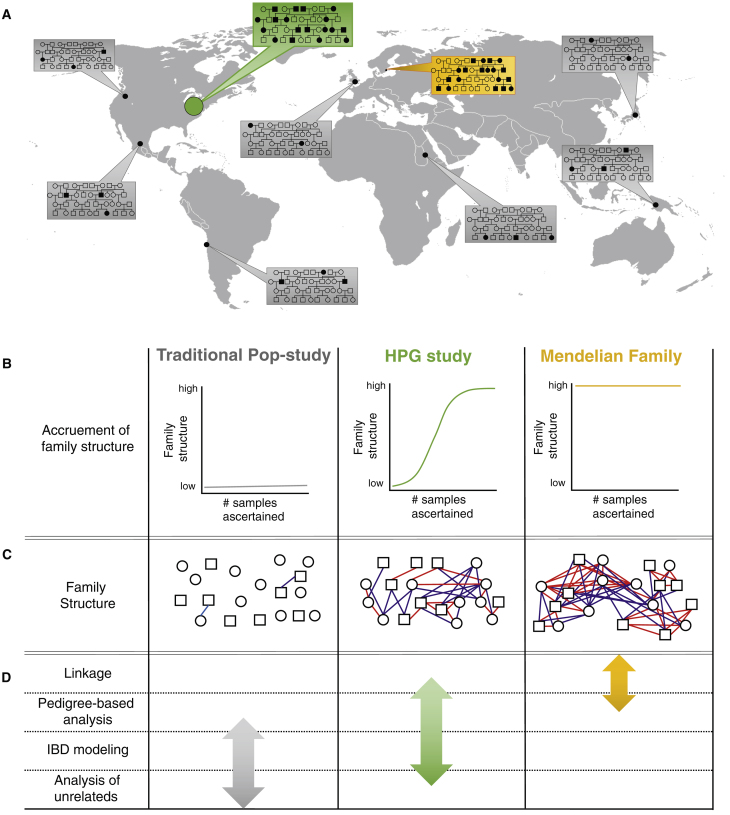
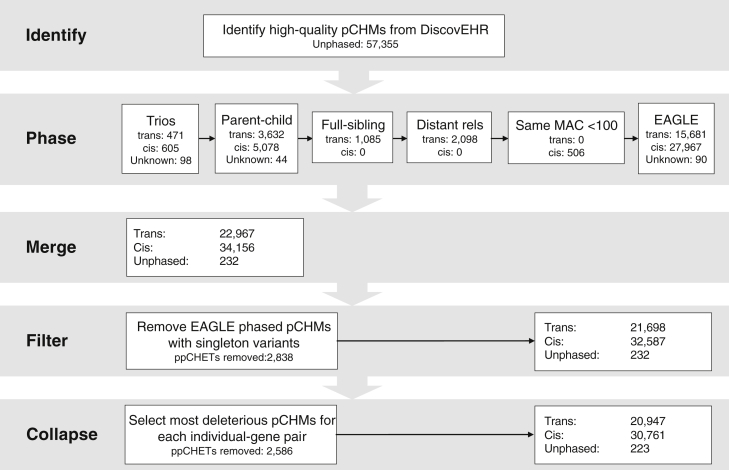
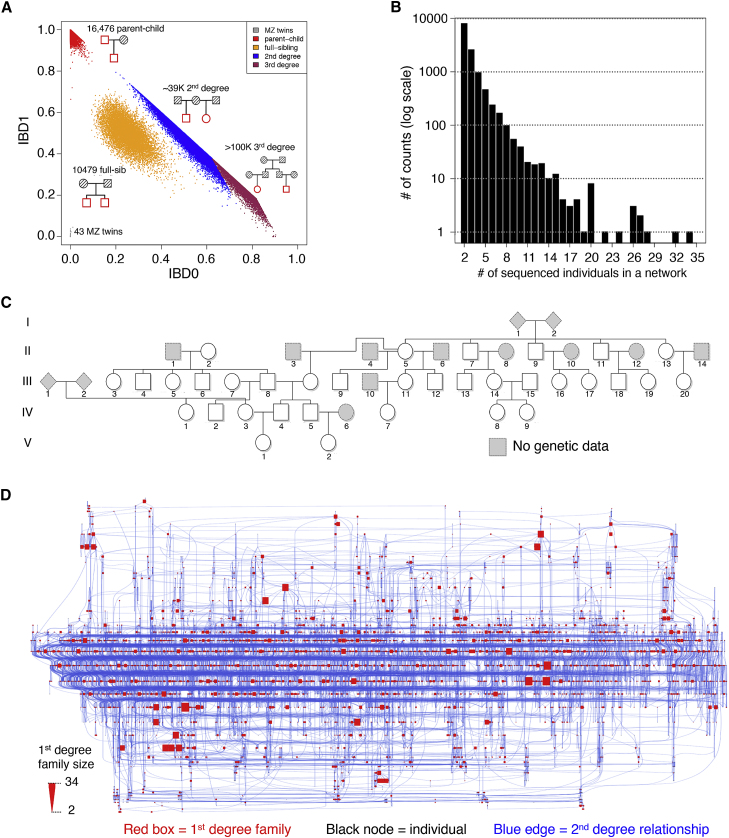
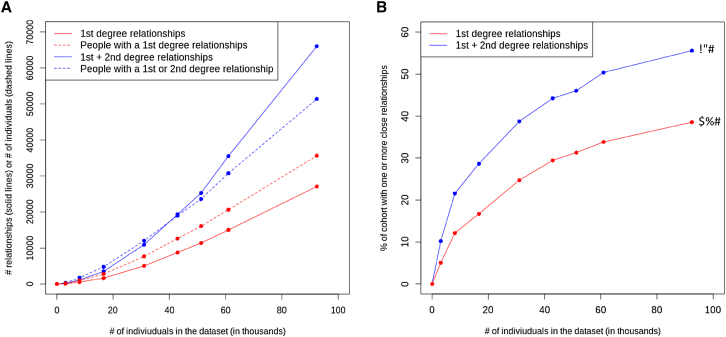
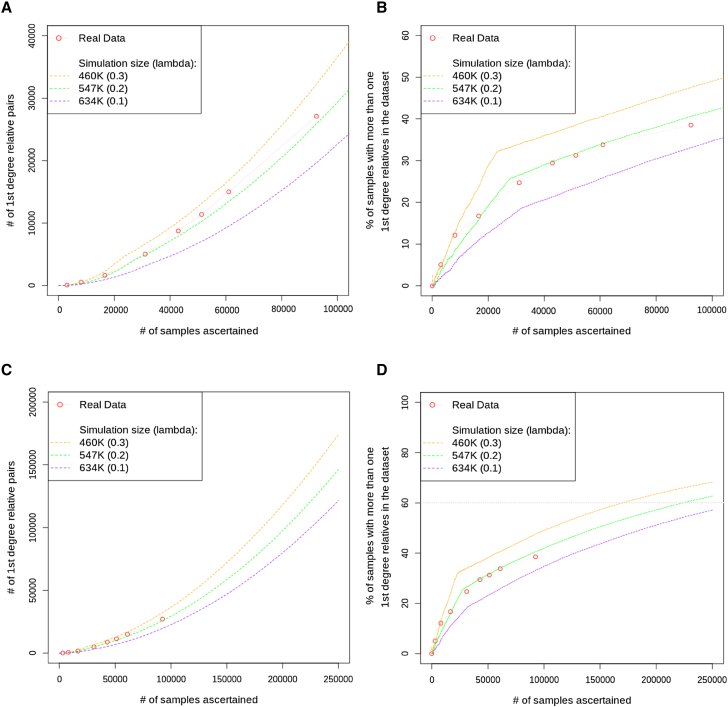
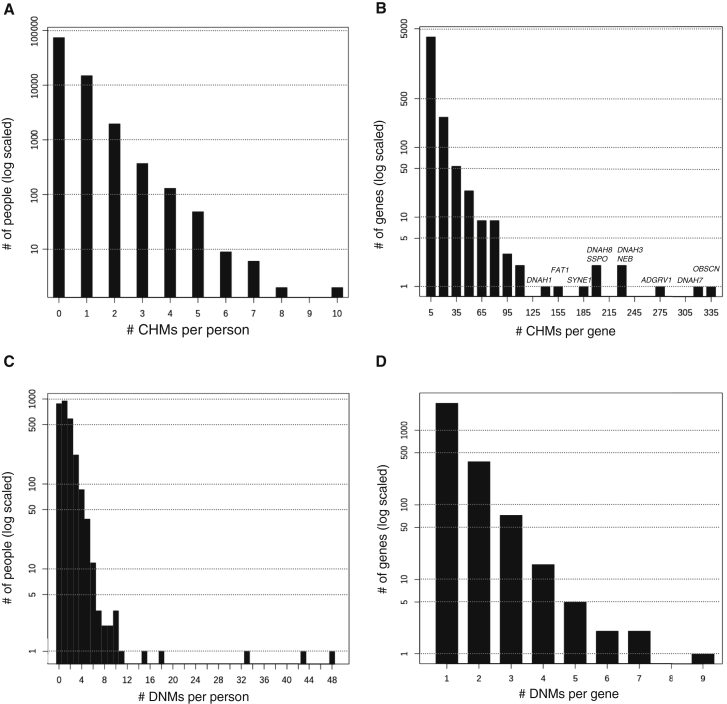
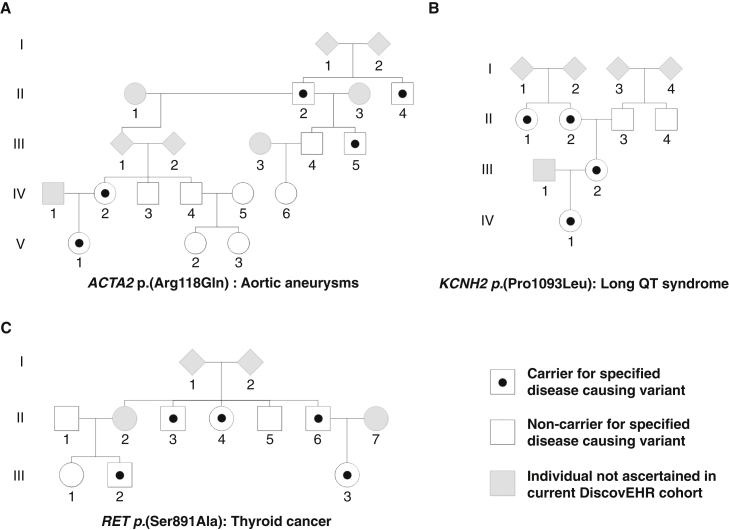
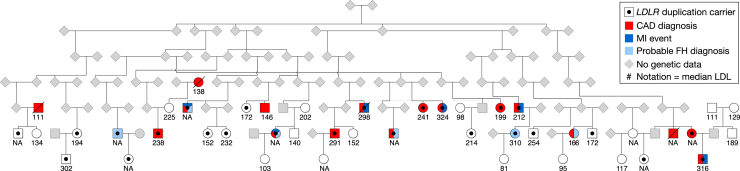
Large-scale human genetics studies are ascertaining increasing proportions of populations as they continue growing in both number and scale. As a result, the amount of cryptic relatedness within these study cohorts is growing rapidly and has significant implications on downstream analyses. We demonstrate this growth empirically among the first 92,455 exomes from the DiscovEHR cohort and, via a custom simulation framework we developed called SimProgeny, show that these measures are in line with expectations given the underlying population and ascertainment approach. For example, within DiscovEHR we identified ∼66,000 close (first- and second-degree) relationships, involving 55.6% of study participants. Our simulation results project that >70% of the cohort will be involved in these close relationships, given that DiscovEHR scales to 250,000 recruited individuals. We reconstructed 12,574 pedigrees by using these relationships (including 2,192 nuclear families) and leveraged them for multiple applications. The pedigrees substantially improved the phasing accuracy of 20,947 rare, deleterious compound heterozygous mutations. Reconstructed nuclear families were critical for identifying 3,415 de novo mutations in ∼1,783 genes. Finally, we demonstrate the segregation of known and suspected disease-causing mutations, including a tandem duplication that occurs in LDLR and causes familial hypercholesterolemia, through reconstructed pedigrees. In summary, this work highlights the prevalence of cryptic relatedness expected among large healthcare population-genomic studies and demonstrates several analyses that are uniquely enabled by large amounts of cryptic relatedness.

Keywords: compound heterozygous mutation phasing; cryptic relatedness; de novo mutations; exome sequencing; familial hypercholesterolemia; family structure; healthcare population-based genetic study; identity by decent; pedigree reconstruction; precision medicine; relationship inference.


Figures

Figure 1
Figure 1
Ascertaining a High Proportion of the Population in a Geographical Area Increases Family Structure and Impacts What Statistical-Analysis Approaches Should Be Used (A) Traditional population-based studies (gray boxes) typically sample a small portion of individuals from several populations. HPG studies (green box) more densely sample individuals from one or more populations. Family-based studies (yellow box) heavily sample within extended families but do not sample nearly as many individuals as the other two study designs. (B) The three study designs result in very different proportions of individuals in the cohort with one or more close relatives in the dataset. (C) The three ascertainment approaches also result in very different amounts of family structure. Red and blue lines indicate first- and second-degree pairwise relationships, respectively. HPG studies are expected to contain a level of family structure between the other two designs. (D) For this study, statistical-analysis approaches were binned into four categories on the basis of the level of family structure required to effectively use the approach. First column: “linkage” refers to traditional linkage analyses using one or more informative pedigrees; “pedigree-based analysis” refers to statistical methods beyond linkage that use pedigree structures within a larger cohort that includes unrelated individuals; “IBD modeling” refers to analyses that model the pairwise relationships between individuals without using the entire pedigree structure; “analysis of unrelateds” refers to analyses that assume all individuals in the cohort are unrelated. The amount of family structure impacts the approaches that can be used, and the arrows indicate the analysis ranges for which the three study designs are best suited.
Figure 2
Figure 2
Decision Cascade for Determining the Phase of Potential Compound Heterozygous Mutations (pCHMs) among the 92K DiscovEHR Participants 25.1% of pCHMs and 33.8% of the CHMs (trans) were phased with trio or relationship data.
Figure 3
Figure 3
First 92K Sequenced Individuals from the DiscovEHR Cohort Contain an Extensive Amount of Relatedness (A) A plot of IBD0 versus IBD1 shows pairwise relationships segregating into different familial relationship classes. The IBD sharing distributions of second- and third-degree relationships overlap with each other, so a hard cutoff halfway between the two expected means was selected. Third-degree relationships are challenging to accurately estimate because of the technical limitations of exome data as well as the widening and overlapping variation around the expected mean IBD proportions of more distant relationship classes (e.g., fourth degree and fifth degree). We provided a lower-bound estimate of the number of third-degree relationships. (B) The distribution of size of first-degree family networks ranges between 2 and 34 sequenced individuals, and the vast majority are smaller family networks. (C) The largest reconsturcted first-degree family network consisting of 34 sequenced individuals; more than 99.98% of the first-degree family networks’ pedigree structures were reconstructed from the genetic data. (D) The largest second-degree family network, consisting of 19,968 individuals (∼22% of the dataset), shows 4,062 first-degree family networks (represented as red boxes that are proportionally sized to the number of individuals in the network, including the network corresponding to the pedigree shown in [C]), and 5,584 additional individuals (black nodes) connected by 11,430 second-degree relationships (blue edges).
Figure 4
Figure 4
Accumulation of Relatedness within the DiscovEHR Cohort at Consecutive Data Freezes (A) The number of pairwise relationships has grown rapidly. (B) The proportion of individuals with a first- or second-degree relative identified in the cohort.
Figure 5
Figure 5
Simulated Population and Ascertainment Fit to the Accumulation of First-Degree Relatedness in the DiscovEHR Cohort The real data were calculated at periodic “freezes” indicated by punctuation points connected by the faint red line. Most simulation parameters were set on the basis of information about the real population demographics and the DiscovEHR ascertainment approach. However, two parameters were unknown and selected on the basis of their fit to the real data: (1) the effective population size from which samples were ascertained and (2) the increased chance that someone is ascertained given that a first-degree relative was previously ascertained, which we call “clustered ascertainment.” All panels show the same three simulated population sizes spanning the estimated effective population size. We simulated clustered ascertainment by randomly ascertaining an individual along with a Poisson-distributed random number of first-degree relatives (distributions’ lambdas are indicated in the legends). (A) The accumulation of pairs of first-degree relatives as additional samples are ascertained. (B) The proportion of the ascertained participants that have one or more first-degree relatives that have also been ascertained. (C) Simulated ascertainment projections with upper and lower bounds of the number of first-degree relationships we expect with our current DiscovEHR ascertainment approach as we scale to our goal of 250K participants. (D) Simulated projections with upper and lower bounds of the proportion of the ascertained participants that have one or more first-degree relatives that have also been ascertained.
Figure 6
Figure 6
DiscovEHR Results for Compound Heterozygous Mutations and De Novo Mutations (A) Distribution of the number of CHMs per individual in the DiscovEHR cohort. (B) Distribution of the number of CHMs per gene. Names of genes with more than 125 CHMs are listed. (C) Distribution of 3,415 exonic high- and moderate-confidence DNMs among the children of trios in the DiscovEHR cohort. (D) The distribution of non-synonymous DNMs across the 2,802 genes with one or more DNM carriers.
Figure 7
Figure 7
Reconstructed Pedigree from DiscovEHR Demonstrates the Segregation of Known Disease-Causing Variants Segregating variants include variants for (A) aortic aneurysms (ACTA2 [MIM: 102620], c.353G>A [p.Arg118Gln]; GenBank: NM_001613.2; Ensembl: ENST00000224784), (B) long QT syndrome (KCNH2 [MIM: 152427], c.3278C>T [p.Pro1093Leu]; GenBank: NM_000238.3; Ensembl: ENST00000262186), and (C) thyroid cancer (RET [MIM: 164761], c.2671T>G [p.Ser891Ala]; GenBank: NM_020630.4; Ensembl: ENST00000340058).
Figure 8
Figure 8
Reconstructed Pedigree Prediction Containing 25/37 Carriers of the FH-Causing Tandem Duplication in LDLR The pedigree also contains 20 non-carrier, related (first- or second-degree) individuals from the sequenced cohort. Carrier and non-carrier status was determined from the exome data from each individual. Elevated maximum LDL measurements (value under symbols) as well as increased prevalence of coronary artery disease (CAD, red fill) and pure hypercholesterolemia (ICD 272.0; blue) segregate with duplication carriers. Five additional carriers (not drawn) were found to be distant relatives (seventh- to ninth-degree relatives) of individuals in this pedigree.

References

    1. Dewey F.E., Murray M.F., Overton J.D., Habegger L., Leader J.B., Fetterolf S.N., O’Dushlaine C., Van Hout C.V., Staples J., Gonzaga-Jauregui C. Distribution and clinical impact of functional variants in 50,726 whole-exome sequences from the DiscovEHR study. Science. 2016;354:aaf6814. - PubMed
    1. Sudlow C., Gallacher J., Allen N., Beral V., Burton P., Danesh J., Downey P., Elliott P., Green J., Landray M. UK biobank: an open access resource for identifying the causes of a wide range of complex diseases of middle and old age. PLoS Med. 2015;12:e1001779. - PMC - PubMed
    1. Collins F.S., Varmus H. A new initiative on precision medicine. N. Engl. J. Med. 2015;372:793–795. - PMC - PubMed
    1. Lek M., Karczewski K.J., Minikel E.V., Samocha K.E., Banks E., Fennell T., O’Donnell-Luria A.H., Ware J.S., Hill A.J., Cummings B.B., Exome Aggregation Consortium Analysis of protein-coding genetic variation in 60,706 humans. Nature. 2016;536:285–291. - PMC - PubMed
    1. Henn B.M., Hon L., Macpherson J.M., Eriksson N., Saxonov S., Pe’er I., Mountain J.L. Cryptic distant relatives are common in both isolated and cosmopolitan genetic samples. PLoS ONE. 2012;7:e34267. - PMC - PubMed

Publication types