. 2018 May 5;18(1):533.
doi: 10.1186/s12885-018-4446-y.

Neuropilin-1 promotes the oncogenic Tenascin-C/integrin β3 pathway and modulates chemoresistance in breast cancer cells

Affiliations

Neuropilin-1 promotes the oncogenic Tenascin-C/integrin β3 pathway and modulates chemoresistance in breast cancer cells

Adviti Naik et al. BMC Cancer. .

Abstract

Background: Neuropilin-1 (NRP-1), a non-tyrosine kinase glycoprotein receptor, is associated with poor prognosis breast cancer, however transcriptomic changes triggered by NRP-1 overexpression and its association with chemoresistance in breast cancer have not yet been explored.

Methods: BT-474 NRP-1 variant cells were generated by stable overexpression of NRP-1 in the BT-474 breast cancer cell line. RNA sequencing and qRT-PCR were conducted to identify differentially expressed genes. The role of an upregulated oncogene, Tenascin C (TNC) and its associated pathway was investigated by siRNA-mediated knockdown. Resistant variants of the control and BT-474 NRP-1 cells were generated by sequential treatment with four cycles of Adriamycin/Cyclophosphamide (4xAC) followed by four cycles of Paclitaxel (4xAC + 4xPAC).

Results: NRP-1 overexpression increased cellular tumorigenic behavior. RNA sequencing identified upregulation of an oncogene, Tenascin-C (TNC) and downregulation of several tumor suppressors in BT-474 NRP-1 cells. Additionally, protein analysis indicated activation of the TNC-associated integrin β3 (ITGB3) pathway via focal adhesion kinase (FAK), Akt (Ser473) and nuclear factor kappa B (NF-kB) p65. siRNA-mediated TNC knockdown ablated the migratory capacity of BT-474 NRP-1 cells and inactivated FAK/Akt473 signaling. NRP-1 overexpressing cells downregulated breast cancer resistance protein (BCRP/ABCG2). Consequently, sequential treatment with Adriamycin/Cyclophosphamide (AC) cytotoxic drugs to generate resistant cells indicated that BT-474 NRP-1 cells increased sensitivity to treatment by inactivating NRP-1/ITGB3/FAK/Akt/NF-kB p65 signaling compared to wild-type BT-474 resistant cells.

Conclusions: We thus report a novel mechanism correlating high baseline NRP-1 with upregulated TNC/ITGB3 signaling, but decreased ABCG2 expression, which sensitizes BT-474 NRP-1 cells to Adriamycin/Cyclophosphamide. The study emphasizes on the targetability of the NRP-1/ITGB3 axis and its potential as a predictive biomarker for chemotherapy response.

Keywords: ABCG2; Adriamycin; Breast cancer; Chemoresistance; Cyclophosphamide; Integrin beta 3; NRP-1; TNC.


Conflict of interest statement

Ethics approval and consent to participate

Not applicable.

Competing interests

The authors declare that they have no competing interests.

Publisher’s Note

Springer Nature remains neutral with regard to jurisdictional claims in published maps and institutional affiliations.

Figures
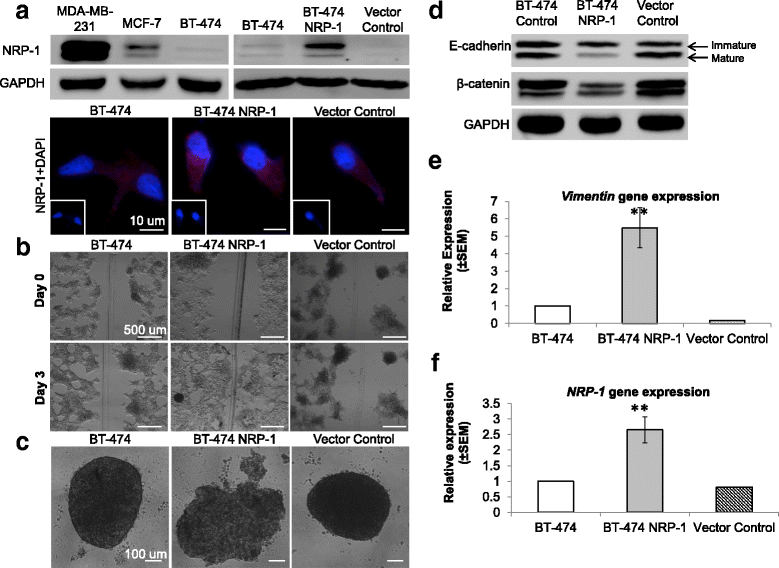
Fig. 1
Fig. 1
NRP-1 overexpression in BT-474 cell line triggers tumorigenic features. a. Comparison of NRP-1 expression in three breast cancer cell lines MDA-MB-231, MCF-7 and BT-474. NRP-1 was stably overexpressed in the BT-474 cell line and confirmed at the level of protein expression by western blotting and immunofluorescence staining (40× magnification, scale bar 10 μm). b. Wound healing assay images (5× magnification, scale bar 500 μm) taken on day 0 and day 3 indicate increased migration in BT-474 NRP-1 cells compared to control cells 3 days post wound generation. c. NRP-1 overexpression reduced spheroid formation (20× magnification, scale bar 100 μm). d. Western blotting indicated decreased expression of mature form of E-cadherin (lower band) and β-catenin along with e, significantly increased vimentin and f, NRP-1 gene expression. Gene expression is relative to the control BT-474 and normalized to β-Actin and GUSB reference genes expression. The graph represents the mean ± SEM of three independent experiments. Statistical analysis using independent samples t-test, p-value < 0.05 considered as statistically significant ** p < 0.01
Fig. 2
Fig. 2
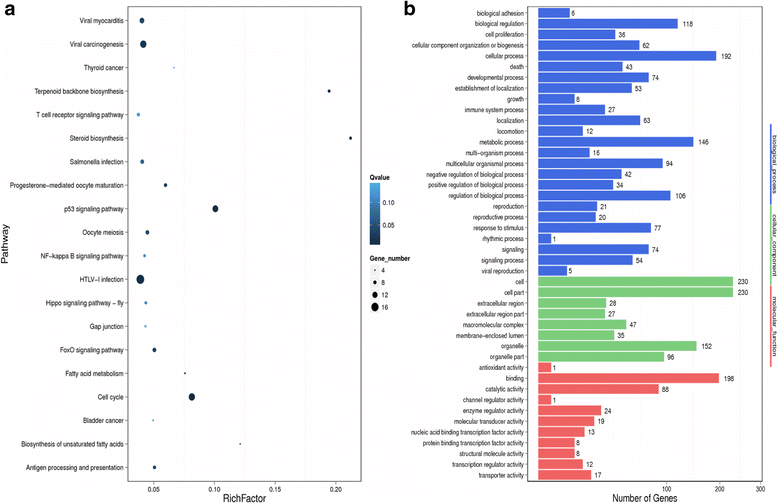
Enrichment of cancer-related pathways from transcriptome-wide analysis. a. Pathway enrichment and b. Gene Ontology analysis of differentially expressed genes (DEGs) between the BT-474 and BT-474 NRP-1 cells from RNA sequencing based on a Log2 ratio cutoff ≥2 and concurrence in 2 replicates
Fig. 3
Fig. 3
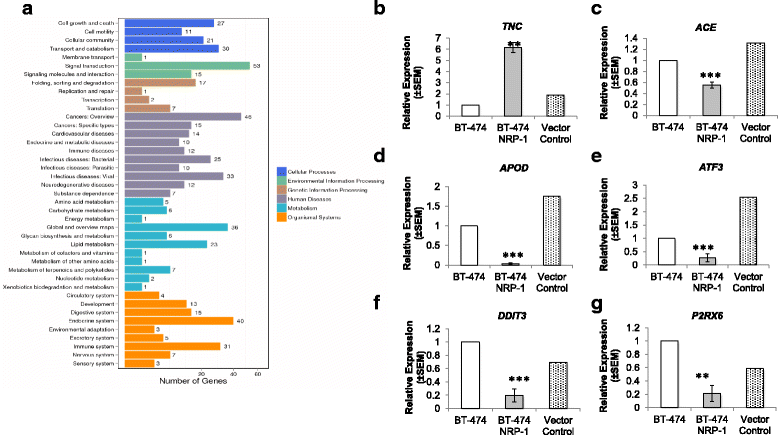
Confirmation of DEGs from transcriptome analysis. a. KEGG pathway analysis of DEGs between BT-474 and BT-474 NRP-1 cells identified from RNA sequencing. Real-time qPCR was implemented on shortlisted DEGs obtained from RNA sequencing to confirm their differential expression. BT-474 NRP-1 cells significantly upregulated b. TNC expression and downregulated c, ACE, d, APOD, e, ATF3, f, DDIT3 and g, P2RX6 expression. Cells transfected with the empty plasmid indicated similar expression to the BT-474 cells. Graphs represent the mean ± SEM of 3 independent experiments. Statistical analysis using independent samples t-test, p value < 0.05 considered as statistically significant ** p < 0.01, ***p < 0.001
Fig. 4
Fig. 4
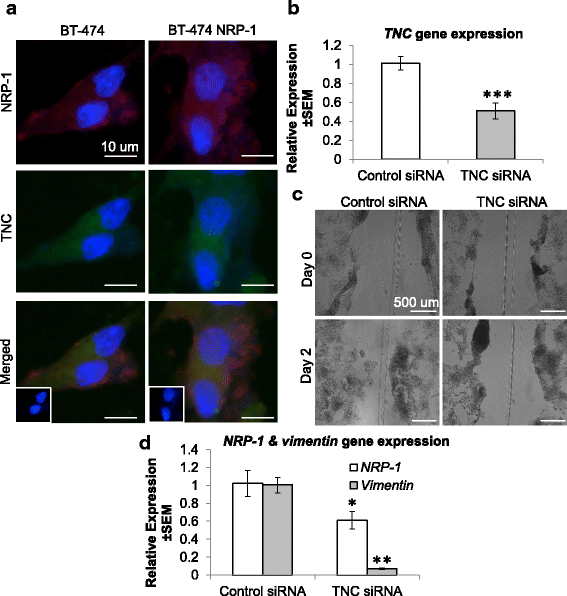
Tenascin C contributes to NRP-1 associated migration. a. Dual immunofluorescence staining (40× magnification scale bar 10 μm) of NRP-1 and TNC on BT-474 and BT-474 NRP-1 cells indicates their colocalization in the cytoplasm. Treatment of BT-474 NRP-1 cells with TNC targeted siRNA molecules, b, reduced TNC gene expression, c, reduced migratory capacity and d, downregulated NRP-1 and vimentin expression. (TNC protein was not detected on western blot due to the lack of specific antibody for this application.) The gene expression fold change was measured by comparing the basal levels detected in the empty plasmid transfected BT-474 or in the case of the siRNA experiment, to the control siRNA treated BT-474 and normalized to β-Actin and GUSB reference gene expression. Wound healing assay images (panel d, 5× magnification, scale bar 500 μm) taken on day 0 and day 2 after siRNA transfection. Graphs represent the mean ± SEM of three independent experiments. Statistical analysis using independent samples t-test, p-value < 0.05 considered as statistically significant. *p < 0.05, ** p < 0.01, *** p < 0.001
Fig. 5
Fig. 5
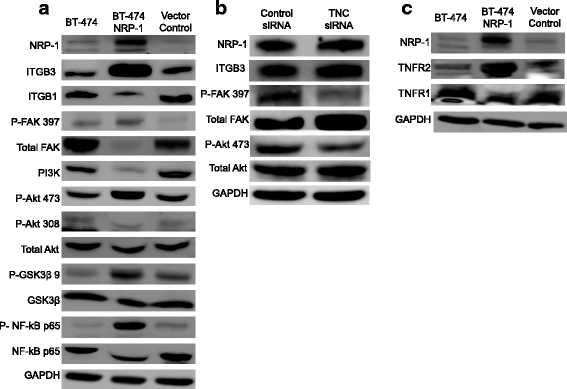
NRP-1 overexpression activates integrin β3 and TNFR2 pathways. Representative western blot images of protein lysates from untransfected BT-474, BT-474 NRP-1 and empty vector control cells blotted with indicated antibodies involved in a. Integrin signaling, and downstream signaling targets FAK, Akt, GSK3-β and NF-kB b. siRNA-mediated TNC downregulation decreased phosphorylation of FAK and Akt-473. c. Blots show levels of tumor necrosis factor receptors (TNFRs). GAPDH protein expression is indicated as a loading control. (The prefix P beside the antibody names indicates the phosphorylated form)
Fig. 6
Fig. 6
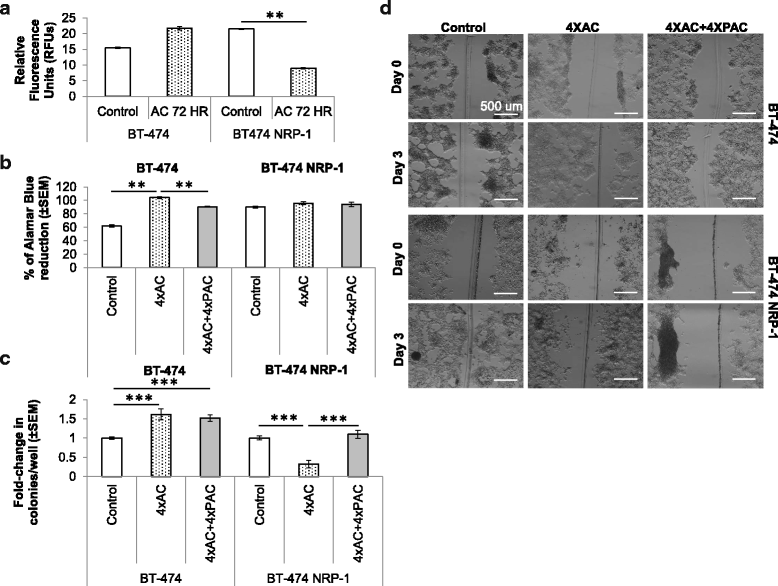
Overexpression of NRP-1 caused differential cellular responses to cytotoxic treatment. a. Treatment with 0.5 uM Adriamycin + 300 nM Cyclophosphamide (AC) for 72 h significantly decreased the invasive capacity of the BT-474 NRP-1 cells but indicated an increasing trend in the invasion ability of BT-474 cells. Resistant BT-474 and BT-474 NRP-1 cells were generated by long-term treatment (eight months) with either four cycles of AC alone (4xAC) or a combination of four cycles of AC and four cycles of 20 nM Paclitaxel (4xAC + 4xPAC), and cellular responses were assessed based on their b, proliferation and c, clonogenic ability, whereby BT-474 4xAC cells indicated significantly increased proliferation and clonogenic capacity compared to BT-474 NRP-1 4xAC cells. d. Wound healing assay images (5× magnification, scale bar 500 μm) to determine the migratory capacity of chemoresistant cells 72 h post generation of the wound indicated decreased migration in BT-474 NRP-1 overexpressing 4xAC and 4xAC + 4xPAC resistant cells compared to BT-474 resistant cells. Fold change in colonies/well (panel c) is compared to the respective untreated BT-474 or BT-474 NRP-1 cells. Graphs represent the mean ± SEM of three independent experiments. Statistical analysis using ANOVA and Tukey post hoc test, p-value < 0.05 considered as statistically significant. ** p < 0.01, ***p < 0.001
Fig. 7
Fig. 7
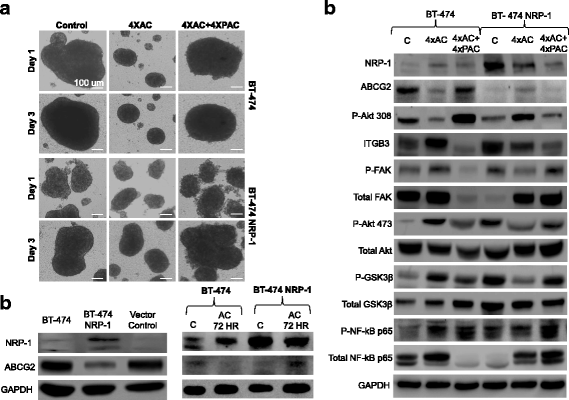
Differential spheroid formation capacity and molecular profiles in NRP-1 overexpressing chemoresistant cells. a. Spheroid formation (20× magnification, scale bar 100 μm) assessed after 24 and 72 h in BT-474 and BT-474 NRP-1 resistant cells indicated multiple smaller spheroids in 4xAC resistant cells but similar phenotypes between the 4xAC + 4xPAC and their respective untreated controls. b. Representative western blots to indicate NRP-1 overexpression inversely correlates with a downregulation of breast cancer resistant protein (BCRP/ABCG2) in untreated cells and on short term AC treatment for 72 h. GAPDH protein expression is indicated as a loading control. c. Representative images from western blot analysis of BT-474 and BT-474 NRP-1 untreated, 4xAC and 4xPAC cell lysates blotted with the indicated antibodies. NRP-1 and integrin β3 pathway molecules indicate a similar expression profile of significantly upregulated expression in BT-474 4xAC cells but a downregulation in BT-474 NRP-1 4xAC cells compared to their respective untreated controls. Images are representative of independent experiments with comparable outcomes. GAPDH protein expression is indicated as a loading control. (The prefix P beside the antibody names indicates the phosphorylated form)
Fig. 8
Fig. 8
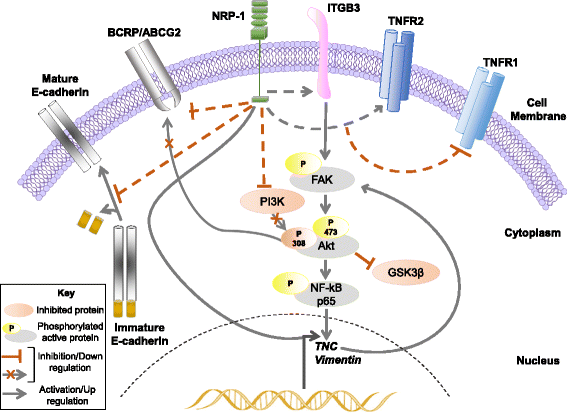
NRP-1/TNC/Integrin β3/FAK/Akt/NF-kB schematic signaling pathway. Schema to illustrate the identified mechanism by which NRP-1 activates TNC-dependent integrin β3 signaling via phosphorylation of FAK/Akt-473/NF-κB p65. In addition, NRP-1 upregulates TNFR2 expression and downregulates BCRP/ABCG2, TNFR1, and PI3K/Akt-308. Solid black lines indicate identified direct interactions in the pathway whereas dashed lines indicate indirect effects of NRP-1 overexpression via unidentified mechanisms. The key denotes the arrows and colors used in the illustration

Similar articles

Cited by

References

    1. Siegel RL, Miller KD, Jemal A. Cancer statistics, 2017. CA Cancer J Clin. 2017;67(1):7–30. doi: 10.3322/caac.21387. - DOI - PubMed
    1. Adham SA, Al Harrasi I, Al Haddabi I, Al Rashdi A, Al Sinawi S, Al Maniri A, Ba-Omar T, Coomber BL. Immunohistological insight into the correlation between neuropilin-1 and epithelial-mesenchymal transition markers in epithelial ovarian cancer. J Histochem Cytochem. 2014;62(9):619–631. doi: 10.1369/0022155414538821. - DOI - PubMed
    1. Adham SA, Al Rawahi H, Habib S, Al Moundhri MS, Viloria-Petit A, Coomber BL. Modeling of hypo/hyperglycemia and their impact on breast cancer progression related molecules. PLoS One. 2014;9(11):e113103. doi: 10.1371/journal.pone.0113103. - DOI - PMC - PubMed
    1. Naik A, Al-Zeheimi N, Bakheit CS, Al Riyami M, Al Jarrah A, Al Moundhri MS, Al Habsi Z, Basheer M, Adham SA. Neuropilin-1 associated molecules in the blood distinguish poor prognosis breast Cancer: a cross-sectional study. Sci Rep. 2017;7(1):3301. doi: 10.1038/s41598-017-03280-0. - DOI - PMC - PubMed
    1. Ellis LM. The role of neuropilins in cancer. Mol Cancer Ther. 2006;5(5):1099–1107. doi: 10.1158/1535-7163.MCT-05-0538. - DOI - PubMed

MeSH terms