. 2018 May 4;3(23):eaao1392.
doi: 10.1126/sciimmunol.aao1392.

MicroRNA-146a controls functional plasticity in γδ T cells by targeting NOD1

Affiliations

MicroRNA-146a controls functional plasticity in γδ T cells by targeting NOD1

Nina Schmolka et al. Sci Immunol. .

Abstract

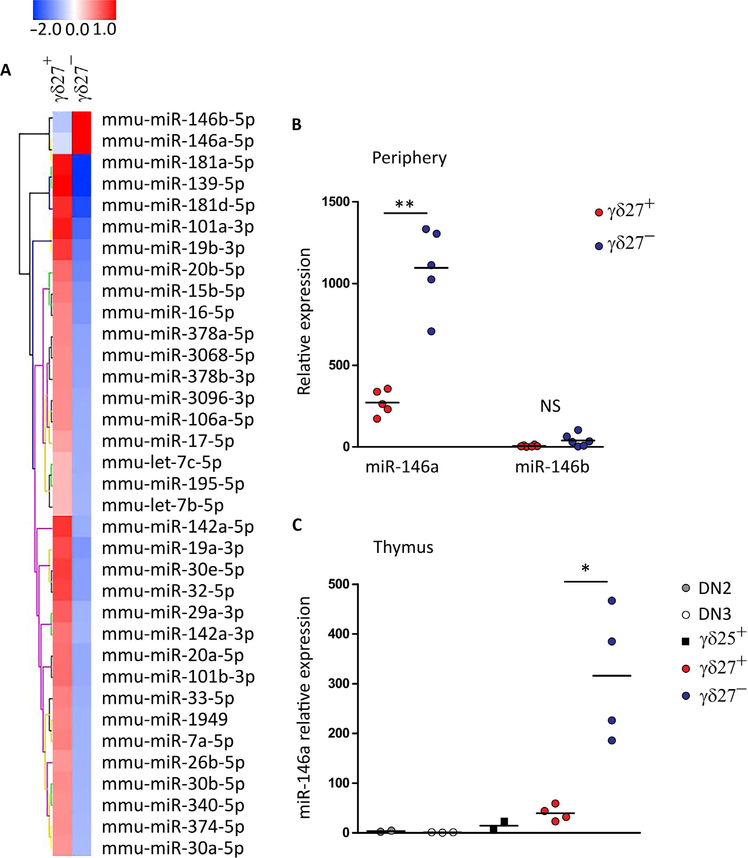
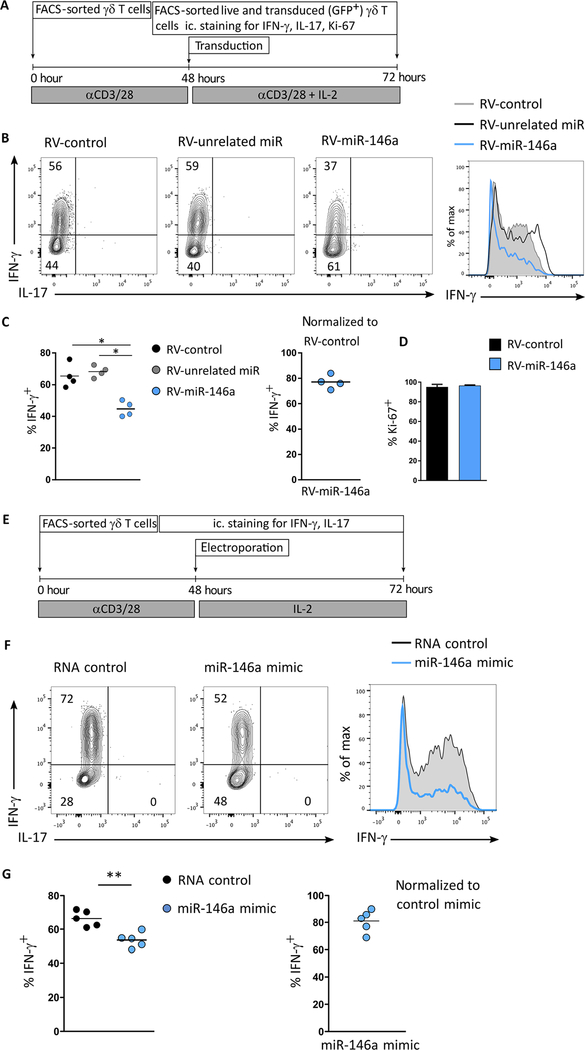
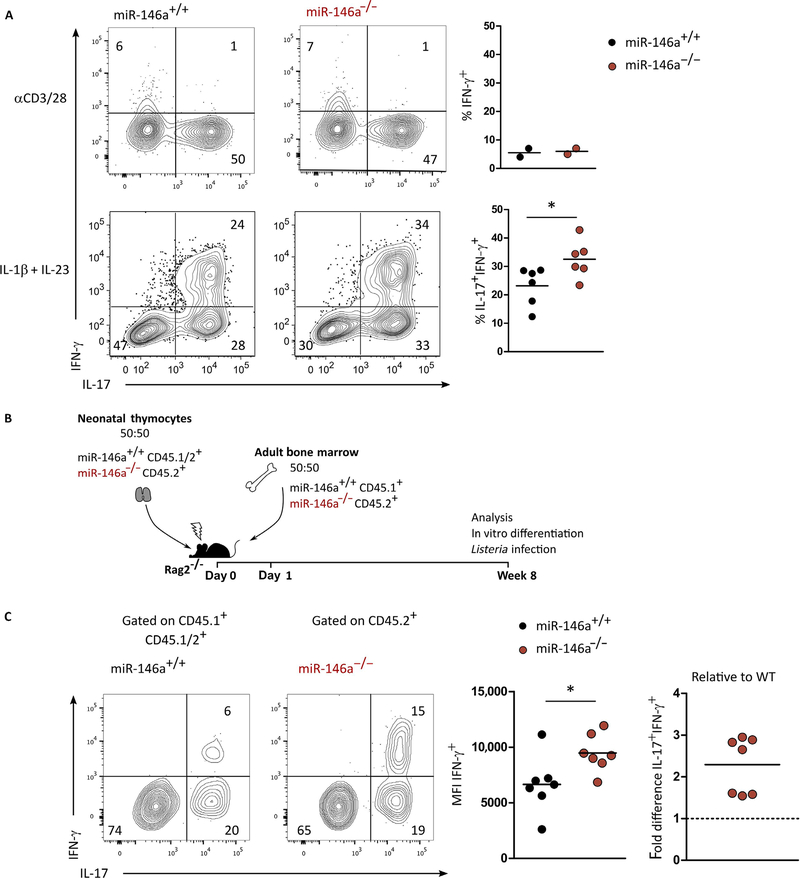
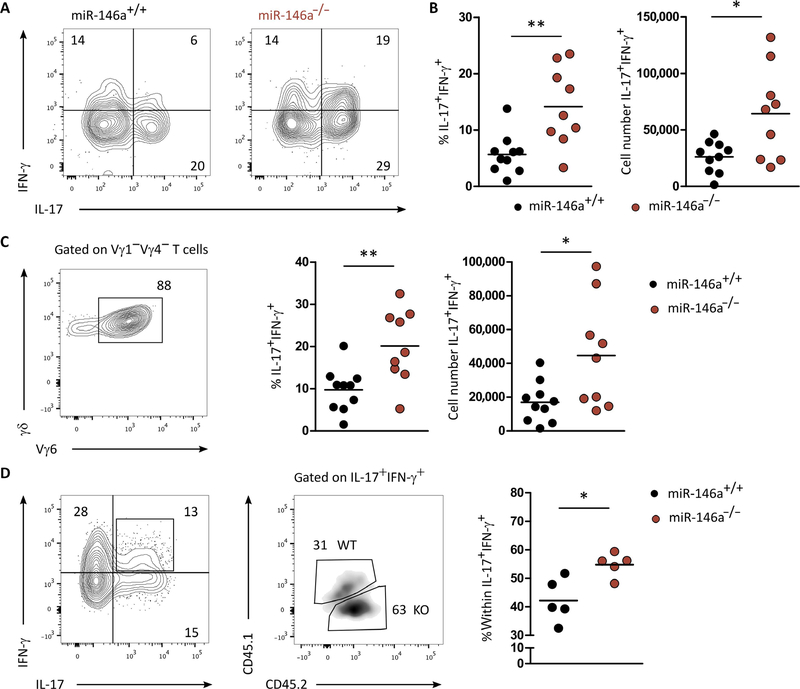
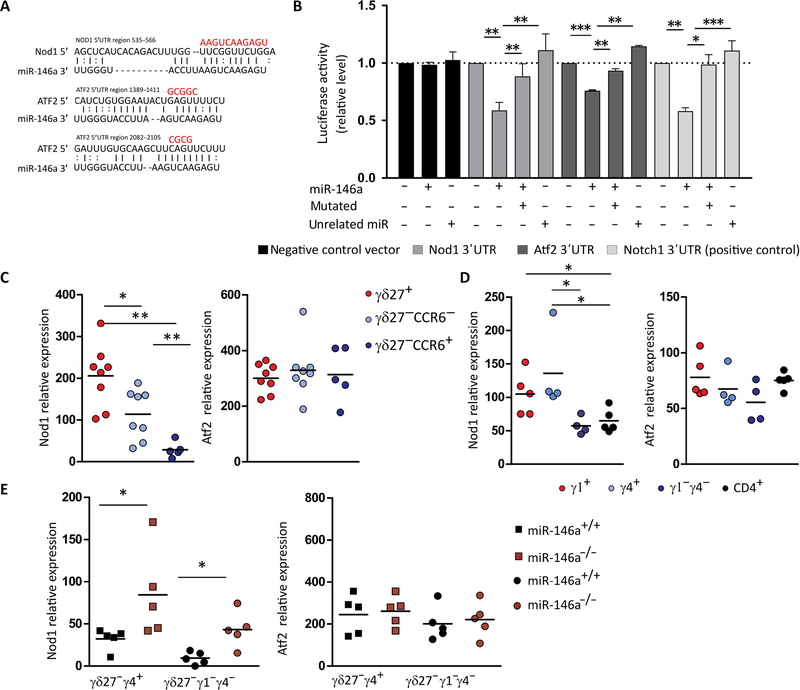
γδ T cells are major providers of proinflammatory cytokines. They are preprogrammed in the mouse thymus into distinct subsets producing either interleukin-17 (IL-17) or interferon-γ (IFN-γ), which segregate with CD27 expression. In the periphery, CD27- γδ (γδ27-) T cells can be induced under inflammatory conditions to coexpress IL-17 and IFN-γ; the molecular basis of this functional plasticity remains to be determined. On the basis of differential microRNA (miRNA) expression analysis and modulation in γδ T cell subsets, we identified miR-146a as a thymically imprinted post-transcriptional brake to limit IFN-γ expression in γδ27- T cells in vitro and in vivo. On the basis of biochemical purification of Argonaute 2-bound miR-146a targets, we identified Nod1 to be a relevant mRNA target that regulates γδ T cell plasticity. In line with this, Nod1-deficient mice lacked multifunctional IL-17+ IFN-γ+ γδ27- cells and were more susceptible to Listeria monocytogenes infection. Our studies establish the miR-146a/NOD1 axis as a key determinant of γδ T cell effector functions and plasticity.


Conflict of interest statement

Competing interests: The authors declare that they have no competing interests.

Figures

Fig. 1.
Fig. 1.. miR-146a is highly expressed selectively on γδ27 T cells.
(A) Microarray heat map of differentially expressed miRNAs in duplicate samples of γδ27+ (n = 4 mice per sample) and γδ27CCR6+ T cells (n = 8 mice per sample) isolated from pooled lymph nodes and spleen of C57BL/6 mice (more than twofold enrichment). (B) RT-qPCR analysis of miR-146a and miR-146b expression in sorted γδ27+ and γδ27 T cells from pooled peripheral organs (lymph node and spleen) of C57BL/6 mice. NS, not significant. (C) RT-qPCR analysis of miR-146a expression in sorted DN2 (CD4CD8CD44+CD25+), DN3 (CD4CD8CD44CD25+), γδ25+ (CD25+CD27+), γδ27+, and γδ27 thymocytes of C57BL/6 mice. Results are presented relative to miR-423–3p or RNU5G (reference small RNA) expression. Each symbol in (B) and (C) represents an individual mouse. *P < 0.05 and **P < 0.01 (Mann-Whitney two-tailed test).
Fig. 2.
Fig. 2.. miR-146a inhibits IFN-γ production in γδ T cells.
Workflow and results of (A to D) retroviral (RV) overexpression of miR-146a and (E to G) electroporation of miR-146a mimics in sorted peripheral γδ T cells. (B) Flow cytometry analysis of intracellular IFN-γ and IL-17 expression; and frequency of (C) IFN-γ+ and (D) Ki-67+ cells in sorted GFP+ retrovirally transduced γδ T cells expressing either an unrelated miR (RV-unrelated miR), a control vector (RV-control), or miR-146a (RV-146a). (F) Flow cytometry analysis of intracellular IFN-γ and IL-17 expression and (G) frequency of IFN-γ+ in electroporated γδ T cells with either RNA control or miR-146a mimic. Numbers in quadrants of flow cytometry plots indicate percentages of cells. Data are representative of five independent experiments. *P < 0.05 and **P < 0.01 (Mann-Whitney two-tailed test).
Fig. 3.
Fig. 3.. miR-146a limits IFN-γ production and the functional plasticity of γδ27 T cells.
(A) Flow cytometry analysis of intracellular IFN-γ and IL-17 and frequency of IFN-γ+ and IL-17+ IFN-γ+ in γδ27 T cells isolated from peripheral organs and stimulated in vitro overnight with αCD3/28 or for 72 hours in the presence of IL-1β plus IL-23. (B) Schematic for 1:1 mixed miR-146a+/+ and miR-146a−/− adult BM and neonatal thymocyte chimeras in Rag2−/− hosts. (C) Flow cytometry analysis of intracellular IFN-γ and IL-17, mean fluorescence intensity (MFI) of IFN-γ+, and fold difference of IFN-γ+ IL-17+ in γδ27 T cells isolated from peripheral organs of above-introduced chimeras after in vitro stimulation for 72 hours with IL-1β plus IL-23. Numbers in quadrants of flow cytometry plots indicate percentages of cells. Each symbol in (A) and (C) represents an individual experiment. *P < 0.05 (Mann-Whitney two-tailed test).
Fig. 4.
Fig. 4.. miR-146a restricts functional plasticity of γδ27 T cells in Listeria infection.
(A) Flow cytometry analysis of intracellular IFN-γ and IL-17 expression in γδ T cells isolated from spleens of miR-146a+/+ or miR-146a−/− mice, 7 days after infection with L. monocytogenes. (B) Frequency and total cell numbers of IL-17+ IFN-γ+ in γδ T cells isolated from spleens of miR-146a+/+ and miR-146a−/− mice, 7 days after infection with L. monocytogenes. (C) Representative flow cytometry analysis of Vγ6 chain usage (left), frequency of IFN-γ+ IL-17+ (middle), and total cell numbers of IFN-γ+ IL-17+ (right) of Vγ1Vγ4 γδ T cells isolated from spleen of miR-146a+/+ or miR-146a−/− mice, 7 days after infection with L. monocytogenes. (D) Representative flow cytometry analysis of IL-17+ IFN-γ+ γδ T cells isolated from the chimeras established in Fig. 3B. (Right) frequency within IFN-γ+ IL-17+ γδ T cells of either miR-146a+/+ or miR-146a−/− origin. Numbers in quadrants of flow cytometry plots indicate percentages of cells. Each symbol in (B) to (D) represents an individual mouse. *P < 0.05 and **P < 0.01 (Mann-Whitney two-tailed test). WT, wild-type; KO, knockout.
Fig. 5.
Fig. 5.. miR-146a targets Nod1 mRNA that is depleted in γδ27 T cells.
(A) Putative binding sites of miR-146a-5p in the 3′UTR region of Nod1 and Atf2. The line represents canonical Watson-Crick base pairing, whereas the dot represents noncanonical base pairing between miR-146a and Nod1 or Atf2 mRNAs. The red bases above illustrated the mutated sites in the region of Nod1 and Atf2 3′UTRs. (B) Dual luciferase reporter assay was performed to verify binding between miR-146a and Nod1 or Atf2 mRNAs. HEK293 T cells were cotransfected with a pmirGLO Dual-Luciferase miRNA Target Expression Vector (Promega) containing either the WT or mutated 3′UTR target sites plus miR-146a, an unrelated miRNA, or GFP control expression vector. A negative construct (without miR-146a binding sites) and a positive construct (3′UTR of Notch1) were included. Data are from three to four independent experiments with technical replicates. *P < 0.05, **P < 0.005, ***P < 0.001, Student’s t test. RT-qPCR analysis of Nod1 and Atf2 and expression in (C) sorted γδ27+, γδ27CCR6, and γδ27CCR6+ T cells from pooled peripheral organs (lymph node and spleen) of C57BL/6 mice; (D) sorted Vγ1+, Vγ4+, and Vγ1γ4 γδ T cells and CD4+ T cells from pooled peripheral organs (lymph node and spleen) of C57BL/6 mice; and (E) sorted Vγ4+CD27 and Vγ1γ4 CD27-γδ T cells from pooled lymph nodes of either miR-146a+/+ or miR-146a−/− mice. Results are presented relative to β-actin and HPRT expression. Each symbol in (C) to (E) represents an individual mouse. *P < 0.05 and **P < 0.01 (Mann-Whitney two-tailed test).
Fig. 6.
Fig. 6.. Nod1 is required for IFN-γ production and functional plasticity in γδ T cells.
(A) Flow cytometry analysis of intracellular IFN-γ and IL-17 expression and frequency of IFN-γ+ IL-17+ (left), IL-17+ (middle), and Ki-67+ (right) in γδ27 T cells isolated from peripheral organs (spleen and lymph nodes) of Nod1+/+ and Nod−/− littermates as well as Atf2+/+ and Atf2−/− littermates after overnight stimulation with IL-1β plus IL-23. (B) Flow cytometry analysis of intracellular IFN-γ and IL-17 expression and frequency of IFN-γ+ IL-17+ (left), IL-17+ (up) and Ki-67+ (bottom) in γδ27 T cells isolated from peripheral organs (spleen and lymph nodes) of miR-146a+/+ Nod1+/+, miR-146a−/−Nod1+/+, and miR-146a−/−Nod1+/− littermates stimulated for 72 hours in the presence of IL-1β plus IL-23. (C) Bacterial CFUs of L. monocytogenes bacterial burden was enumerated in the spleen 4 days after infection (left), weight loss (middle), and survival (right) of Nod1+/+, Nod+/−, Nod−/−, and TCRd−/− mice infected with Listeria (n = 7 to 18 in three independent experiments). (D) Flow cytometry analysis of intracellular IFN-γ and IL-17 expression in γδ T cells isolated from spleen of Nod1+/+, Nod+/−, and Nod−/− mice, 7 days after infection with Listeria. Numbers in quadrants of flow cytometry plots indicate percentages of cells. (E) Frequency of IFN-γ+ IL-17+ within γδ T cells (left) and Vγ1Vγ4 γδ T cells (right) isolated from spleen of Nod1+/+, Nod+/−, and Nod−/−, 7 days after infection with Listeria (n = 7 to 18 in three independent experiments). Each symbol in (A) and (D) represents an individual mouse. *P < 0.05 and **P < 0.01 (Mann-Whitney two-tailed test).

References

    1. Korn T, Bettelli E, Oukka M, Kuchroo VK, IL-17 and Th17 Cells. Annu. Rev. Immunol. 27, 485–517 (2009). - PubMed
    1. Neurath MF, Weigmann B, Finotto S, Glickman J, Nieuwenhuis E, Iijima H, Mizoguchi A, Mizoguchi E, Mudter J, Galle PR, Bhan A, Autschbach F, Sullivan BM, Szabo SJ, Glimcher LH, Blumberg RS, The transcription factor T-bet regulates mucosal T cell activation in experimental colitis and Crohn’s disease. J. Exp. Med. 195, 1129–1143 (2002). - PMC - PubMed
    1. Papotto PH, Ribot JC, Silva-Santos B, IL-17+ γδ T cells as kick-starters of inflammation. Nat. Immunol. 18, 604–611 (2017). - PubMed
    1. Hiromatsu K, Yoshikai Y, Matsuzaki G, Ohga S, Muramori K, Matsumoto K, Bluestone JA, Nomoto K, A protective role of gamma/delta T cells in primary infection with Listeria monocytogenes in mice. J. Exp. Med. 175, 49–56 (1992). - PMC - PubMed
    1. Sheridan BS, Romagnoli PA, Pham Q-M, Fu H-H, Alonzo F III, Schubert W-D, Freitag NE, Lefrançois L, γδ T cells exhibit multifunctional and protective memory in intestinal tissues. Immunity 39, 184–195 (2013). - PMC - PubMed

Publication types