. 2018 May 22;115(21):E4796-E4805.
doi: 10.1073/pnas.1722055115. Epub 2018 May 4.

Systematic approach for dissecting the molecular mechanisms of transcriptional regulation in bacteria

Affiliations

Systematic approach for dissecting the molecular mechanisms of transcriptional regulation in bacteria

Nathan M Belliveau et al. Proc Natl Acad Sci U S A. .

Abstract

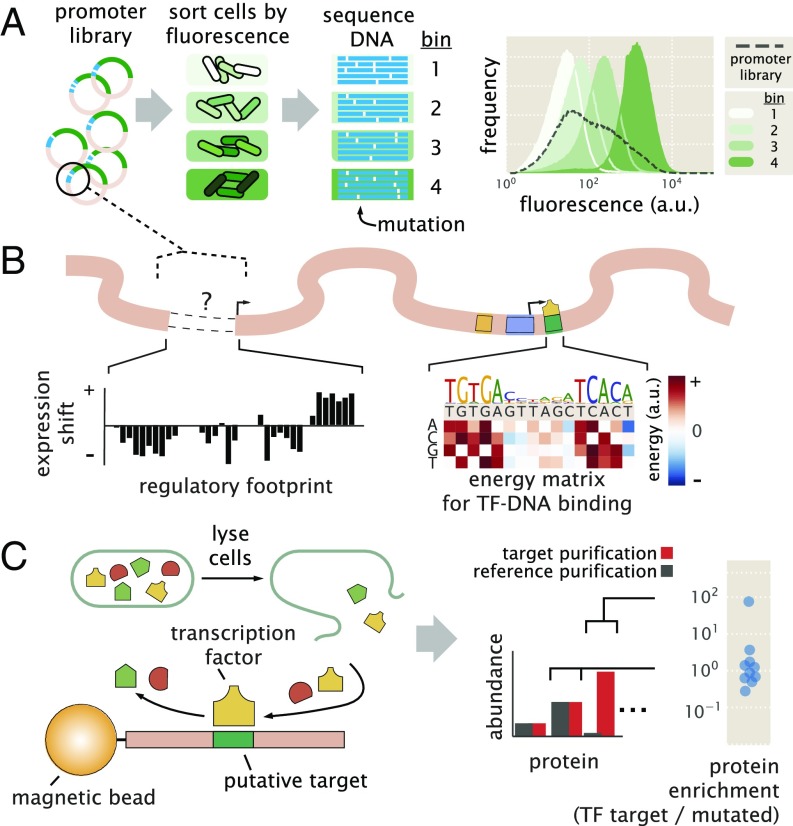
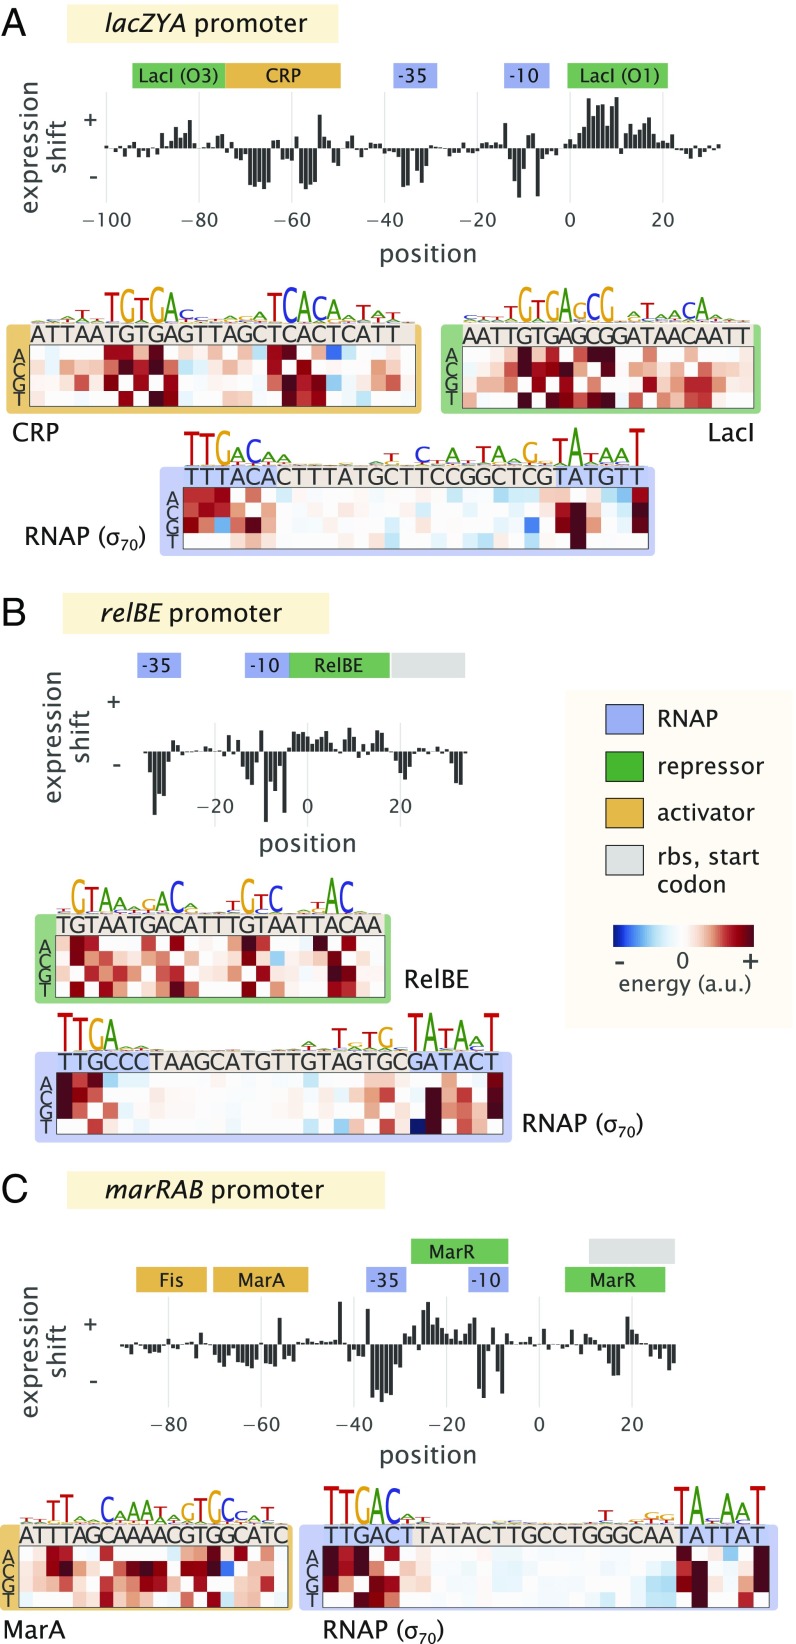
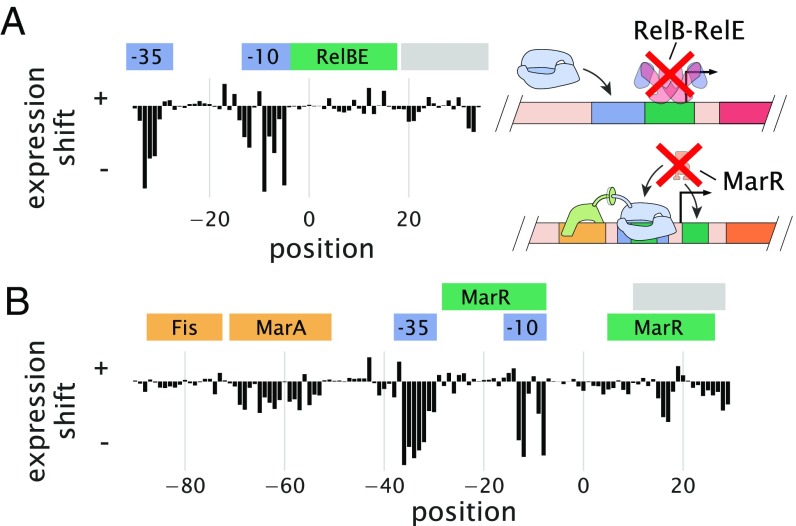
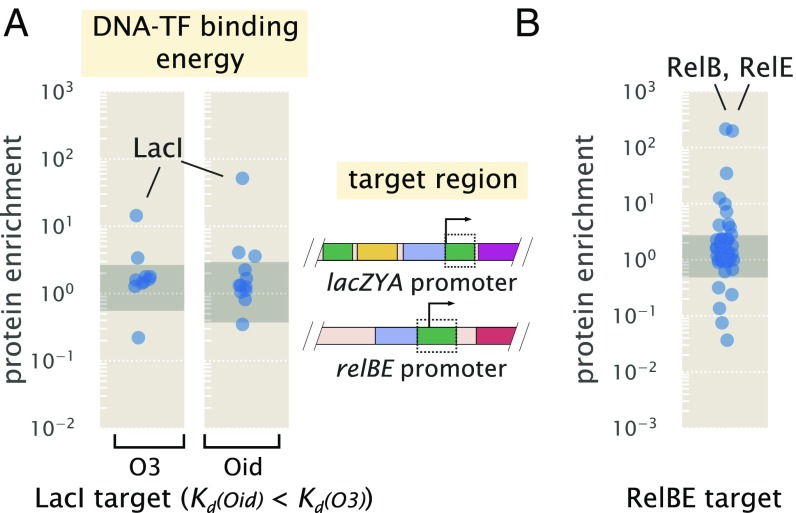
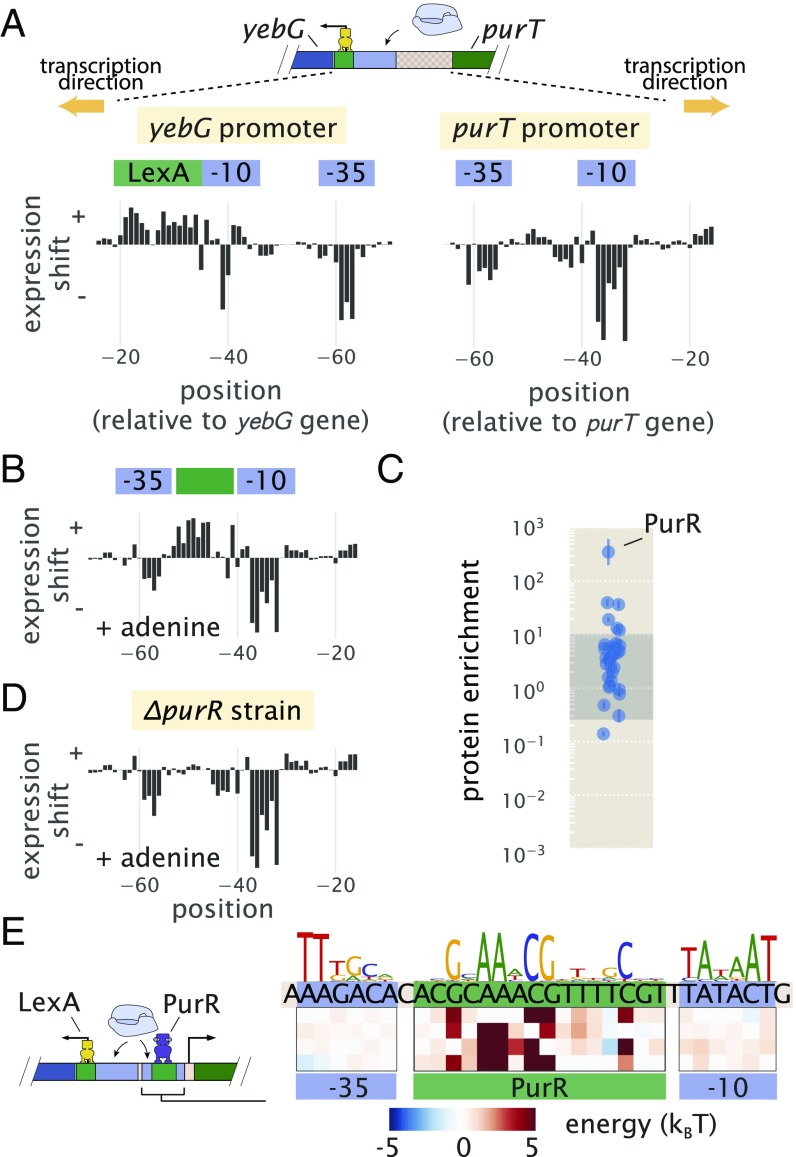
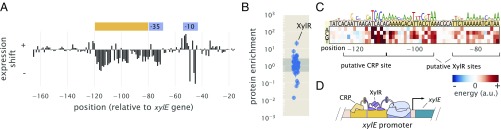
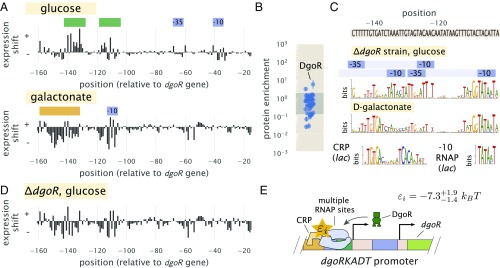
Gene regulation is one of the most ubiquitous processes in biology. However, while the catalog of bacterial genomes continues to expand rapidly, we remain ignorant about how almost all of the genes in these genomes are regulated. At present, characterizing the molecular mechanisms by which individual regulatory sequences operate requires focused efforts using low-throughput methods. Here, we take a first step toward multipromoter dissection and show how a combination of massively parallel reporter assays, mass spectrometry, and information-theoretic modeling can be used to dissect multiple bacterial promoters in a systematic way. We show this approach on both well-studied and previously uncharacterized promoters in the enteric bacterium Escherichia coli In all cases, we recover nucleotide-resolution models of promoter mechanism. For some promoters, including previously unannotated ones, the approach allowed us to further extract quantitative biophysical models describing input-output relationships. Given the generality of the approach presented here, it opens up the possibility of quantitatively dissecting the mechanisms of promoter function in E. coli and a wide range of other bacteria.

Keywords: DNA affinity chromatography; gene regulation; mass spectrometry; massively parallel reporter assay; quantitative models.


Conflict of interest statement

The authors declare no conflict of interest.

Figures

Fig. 1.
Fig. 1.
Overview of the approach to characterize transcriptional regulatory DNA using Sort-Seq and mass spectrometry. (A) Schematic of Sort-Seq. A promoter plasmid library is placed upstream of GFP and is transformed into cells. The cells are sorted into four bins by FACS, and after regrowth, plasmids are purified and sequenced. The entire intergenic region associated with a promoter is included on the plasmid, and a separate downstream ribosomal binding site sequence is used for translation of the GFP gene. The fluorescence histograms show the fluorescence from a library of the rel promoter and the resulting sorted bins. (B) Regulatory binding sites are identified by calculating the average expression shift due to mutation at each position. In the schematic, positive expression shifts are suggestive of binding by repressors, while negative shifts would suggest binding by an activator or RNAP. Quantitative models can be inferred to describe and further interrogate the associated DNA–protein interactions. An example energy matrix that describes the binding energy between an as yet unknown transcription factor (TF) and the DNA is shown. By convention, the wild-type nucleotides have zero energy, with blue squares identifying mutations that enhance binding (negative energy) and red squares identifying mutations that reduce binding (positive energy). The wild-type sequence is written above the matrix. (C) DNA affinity chromatography and mass spectrometry are used to identify the putative transcription factor for an identified repressor site. DNA oligonucleotides containing the target binding site are tethered to magnetic beads and used to purify the target transcription factor from cell lysate. Protein abundance is determined by mass spectrometry, and a protein enrichment is calculated as the ratio in abundance relative to a second reference experiment where the target sequence is mutated away.
Fig. 2.
Fig. 2.
Characterization of the regulatory landscape of the lac, rel, and mar promoters. (A) Sort-Seq of the lac promoter. Cells were grown in M9 minimal media with 0.5% glucose at 37 °C. Expression shifts are shown, with annotated binding sites for CRP (activator), RNAP (−10 and −35 subsites), and LacI (repressor) noted. Energy matrices and sequence logos are shown for each binding site. (B) Sort-Seq of the rel promoter. Cells were also grown in M9 minimal media with 0.5% glucose at 37 °C. The expression shifts identify the binding sites of RNAP and RelBE (repressor), and energy matrices and sequence logos are shown for these. (C) Sort-Seq of the mar promoter. Here, cells were grown in LB at 30 °C. The expression shifts identify the known binding sites of Fis and MarA (activators), RNAP, and MarR (repressor). Energy matrices and sequence logos are shown for MarA and RNAP. Annotated binding sites are based on those in RegulonDB.
Fig. 3.
Fig. 3.
Expression shifts reflect binding by regulatory proteins. (A) Expression shifts for the rel promoter but in a ΔrelBE genetic background. Cells were grown in conditions identical to Fig. 2B but no longer show a substantial positive expression shift across the annotated RelBE binding site. (B) Expression shifts for the mar promoter but in a ΔmarR genetic background. The positive expression shift observed where MarR is expected to bind is no longer observed. Binding site annotations are identified in blue for RNAP sites, green for repressor sites, yellow for activator sites, and gray for ribosomal binding site and start codons. These annotations refer to the binding sites noted on RegulonDB that were observed in the Sort-Seq data.
Fig. 4.
Fig. 4.
DNA affinity purification and identification of LacI and RelBE by mass spectrometry using known target binding sites. (A) Protein enrichment using the weak O3 binding site and strong synthetic Oid binding sites of LacI. LacI was the most significantly enriched protein in each purification. The target DNA region was based on the boxed area of the lac promoter schematic but with the native O1 binding site sequence replaced with either O3 or Oid. Data points represent average protein enrichment for each detected transcription factor measured from a single purification experiment. (B) For purification using the RelBE binding site target, both RelB and its cognate binding partner RelE were significantly enriched. Data points show the average protein enrichment from two purification experiments. The target binding site is shown by the boxed region of the rel promoter schematic. Data points in each purification show the protein enrichment for detected transcription factors. The gray shaded regions show where 95% of all detected protein ratios were found.
Fig. 5.
Fig. 5.
Sort-Seq distinguishes directional regulatory features and uncovers the regulatory architecture of the purT promoter. (A) A schematic is shown for the approximately 120-bp region between the yebG and purT genes, which code in opposite directions. Expression shifts are shown for 60-bp regions where regulation was observed for each promoter, with positions noted relative to the start codon of each native coding gene. Cells were grown in M9 minimal media with 0.5% glucose. The −10 and −35 RNAP binding sites of the purT promoter were determined through inference of an energy matrix and are identified in blue. (B) Expression shifts for the purT promoter but in M9 minimal media with 0.5% glucose supplemented with adenine (100 μg/ml). A putative repressor site is annotated in green. (C) DNA affinity chromatography was performed using the identified repressor site, and protein enrichment values for transcription factors are plotted. Cell lysate was produced from cells grown in M9 minimal media with 0.5% glucose. Binding was performed in the presence of hypoxanthine (10 μg/ml). Error bars represent the SEM calculated using log protein enrichment values from three replicates, and the gray shaded region represents the 95% probability density region of all protein detected. (D) Identical to B but performed with cells containing a ΔpurR genetic background. (E) Summary of regulatory binding sites and transcription factors that bind within the intergenic region between the genes of yebG and purT. Energy weight matrices and sequence logos are shown for the PurR repressor and RNAP binding sites. Data were fit to a thermodynamic of simple repression, yielding energies in units of kBT.
Fig. 6.
Fig. 6.
Sort-Seq identifies a set of activator binding sites that drive expression of RNAP at the xylE promoter. (A) Expression shifts are shown for the xylE promoter, with Sort-Seq performed on cells grown in M9 minimal media with 0.5% xylose. The −10 and −35 regions of an RNAP binding site (blue) and a putative activator region (orange) are annotated. (B) DNA affinity chromatography was performed using the putative activator region, and protein enrichment values for transcription factors are plotted. Cell lysate was generated from cells grown in M9 minimal media with 0.5% xylose, and binding was performed in the presence of xylose supplemented at the same concentration as during growth. Error bars represent the SEM calculated using log protein enrichment values from three replicates. The gray shaded region represents the 95% probability density region of all proteins detected. (C) An energy matrix was inferred for the region upstream of the RNAP binding site. The associated sequence logo is shown above the matrix. Two binding sites for XylR were identified (SI Appendix, Figs. S4 and S8F) along with a CRP binding site. (D) Summary of regulatory features identified at xylE promoter, with the identification of an RNAP binding site and tandem binding sites for XylR and CRP.
Fig. 7.
Fig. 7.
The dgoRKADT promoter is induced in the presence of d-galactonate due to loss of repression by DgoR and activation by CRP. (A) Expression shifts due to mutating the dgoRKADT promoter are shown for cells grown in M9 minimal media with either 0.5% glucose (Upper) or 0.23% d-galactonate (Lower). Regions identified as RNAP binding sites (−10 and −35) are shown in blue, and putative activator and repressor binding sites are shown in orange and green, respectively. (B) DNA affinity purification was performed targeting the region between −145 bp and −110 bp of the dgoRKADT promoter. The transcription factor DgoR was found most enriched among the transcription factors plotted. Error bars represent the SEM calculated using log protein enrichment values from three replicates, and the gray shaded region represents the 95% probability density region of all proteins detected. (C) Sequence logos were inferred for the most upstream 60-bp region associated with the upstream RNAP binding site annotated in A. Multiple RNAP binding sites were identified using Sort-Seq data performed in a ΔdgoR strain grown in M9 minimal media with 0.5% glucose (further detailed in SI Appendix, Fig. S9). Below this, a sequence logo was also inferred using data from Sort-Seq performed on wild-type cells grown in d-galactonate, identifying a CRP binding site [class II activation (54)]. (D) Expression shifts are shown for the dgoRKADT promoter when performed in a ΔdgoR genetic background grown in 0.5% glucose. This resembles growth in d-galactonate, suggesting d-galactonate may act as an inducer for DgoR. (E) Summary of regulatory features identified at the dgoRKADT promoter, with the identification of multiple RNAP binding sites and binding sites for DgoR and CRP. The interaction energy between CRP and RNAP, εi, was inferred to be 7.31.4+1.9kBT, where the superscripts and subscripts represent the upper and lower bounds associated with 95 percent of the inferred parameter value distribution, respectively.

Similar articles

Cited by

References

    1. Gama-Castro S, et al. RegulonDB version 9.0: High-level integration of gene regulation, coexpression, motif clustering and beyond. Nucleic Acids Res. 2016;44:D133–D143. - PMC - PubMed
    1. Keseler IM, et al. EcoCyc: Fusing model organism databases with systems biology. Nucleic Acids Res. 2013;41:D605–D612. - PMC - PubMed
    1. Münch R, et al. PRODORIC: Prokaryotic database of gene regulation. Nucleic Acids Res. 2003;31:266–269. - PMC - PubMed
    1. Cipriano MJ, et al. RegTransBase–A database of regulatory sequences and interactions based on literature: A resource for investigating transcriptional regulation in prokaryotes. BMC Genomics. 2013;14:213–221. - PMC - PubMed
    1. Kiliç S, White ER, Sagitova DM, Cornish JP, Erill I. CollecTF: A database of experimentally validated transcription factor-binding sites in bacteria. Nucleic Acids Res. 2013;42:D156–D160. - PMC - PubMed

Publication types

MeSH terms

Substances