. 2018 May 4;8(1):7024.
doi: 10.1038/s41598-018-25438-0.

Applications and efficiencies of the first cat 63K DNA array

Affiliations

Applications and efficiencies of the first cat 63K DNA array

Barbara Gandolfi et al. Sci Rep. .

Erratum in

  • Author Correction: Applications and efficiencies of the first cat 63K DNA array.
    Gandolfi B, Alhaddad H, Abdi M, Bach LH, Creighton EK, Davis BW, Decker JE, Dodman NH, Ginns EI, Grahn JC, Grahn RA, Haase B, Haggstrom J, Hamilton MJ, Helps CR, Kurushima JD, Lohi H, Longeri M, Malik R, Meurs KM, Montague MJ, Mullikin JC, Murphy WJ, Nilson SM, Pedersen NC, Peterson CB, Rusbridge C, Saif R, Shelton GD, Warren WC, Wasim M, Lyons LA. Gandolfi B, et al. Sci Rep. 2018 Jun 4;8(1):8746. doi: 10.1038/s41598-018-26885-5. Sci Rep. 2018. PMID: 29867197 Free PMC article.
  • Author Correction: Applications and efficiencies of the first cat 63 K DNA array.
    Gandolfi B, Alhaddad H, Abdi M, Bach LH, Creighton EK, Davis BW, Decker JE, Dodman NH, Ginns EI, Grahn JC, Grahn RA, Haase B, Haggstrom J, Hamilton MJ, Helps CR, Kurushima JD, Lohi H, Longeri M, Malik R, Meurs KM, Montague MJ, Mullikin JC, Murphy WJ, Nilson SM, Pedersen NC, Peterson CB, Rusbridge C, Saif R, Shelton GD, Warren WC, Wasim M, Lyons LA. Gandolfi B, et al. Sci Rep. 2019 Mar 12;9(1):4664. doi: 10.1038/s41598-018-38073-6. Sci Rep. 2019. PMID: 30858384 Free PMC article.

Abstract

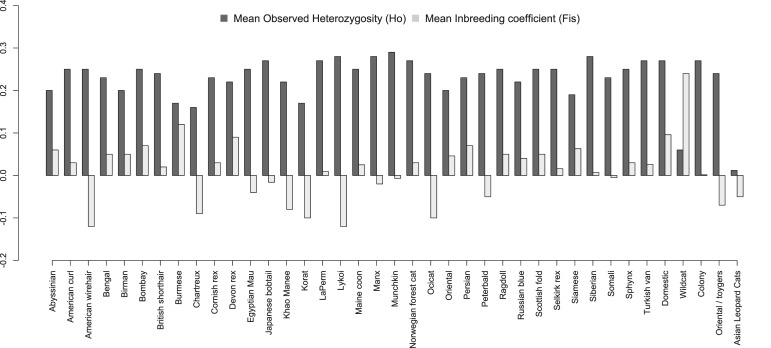
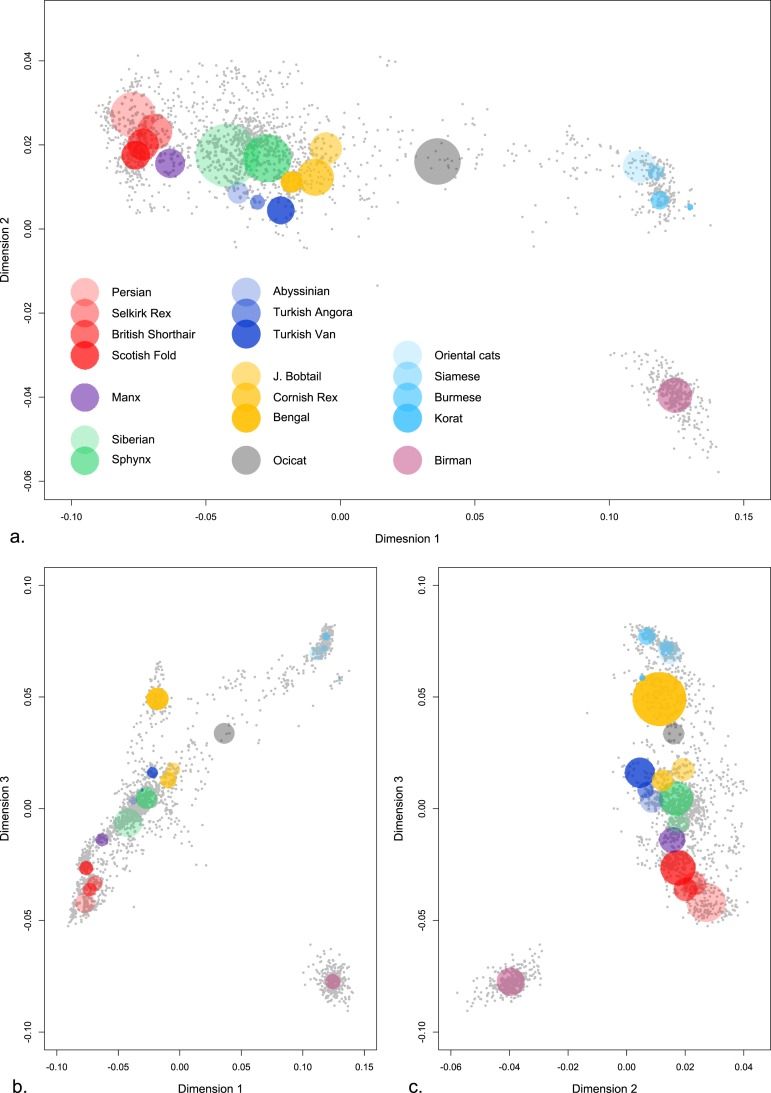
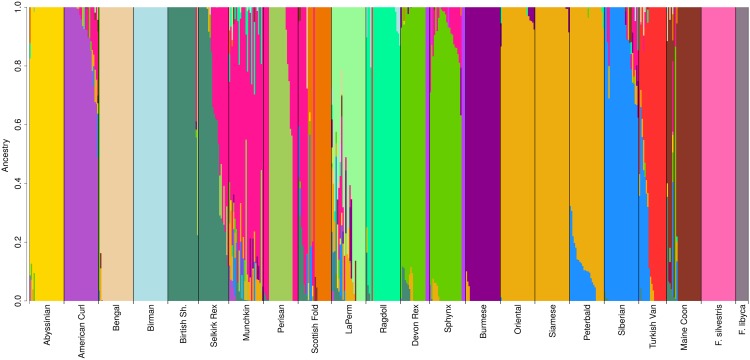
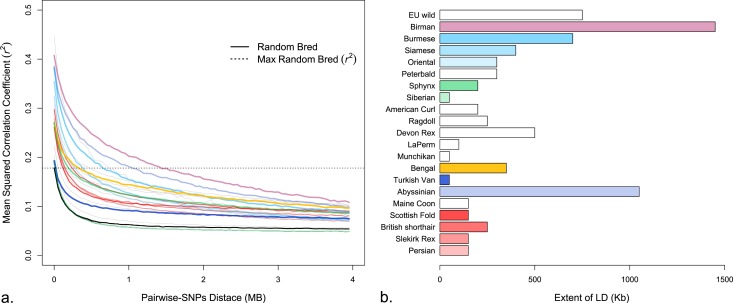
The development of high throughput SNP genotyping technologies has improved the genetic dissection of simple and complex traits in many species including cats. The properties of feline 62,897 SNPs Illumina Infinium iSelect DNA array are described using a dataset of over 2,000 feline samples, the most extensive to date, representing 41 cat breeds, a random bred population, and four wild felid species. Accuracy and efficiency of the array's genotypes and its utility in performing population-based analyses were evaluated. Average marker distance across the array was 37,741 Kb, and across the dataset, only 1% (625) of the markers exhibited poor genotyping and only 0.35% (221) showed Mendelian errors. Marker polymorphism varied across cat breeds and the average minor allele frequency (MAF) of all markers across domestic cats was 0.21. Population structure analysis confirmed a Western to Eastern structural continuum of cat breeds. Genome-wide linkage disequilibrium ranged from 50-1,500 Kb for domestic cats and 750 Kb for European wildcats (Felis silvestris silvestris). Array use in trait association mapping was investigated under different modes of inheritance, selection and population sizes. The efficient array design and cat genotype dataset continues to advance the understanding of cat breeds and will support monogenic health studies across feline breeds and populations.


Conflict of interest statement

The authors declare no competing interests.

Figures

Figure 1
Figure 1
Summary of population genetics of cat breeds and populations. Random bred cats have the highest measures of genetic variation whereas several breeds have critically low genetic variation, such as Burmese and Birman. Breeds that have been developed more recently from random bred populations, such as Siberians and Munchkins, have high diversity, as well as breeds continually pulled from random bred populations, such as the Manx cats from the Isle of Man. Note: Domestic group represents random bred samples where as Oriental/Toyger is pedigree.
Figure 2
Figure 2
Multi-dimensional scaling of cat breed genetic structure. Plots of the genetic distances between individual domestic cats in three dimensions (C1 vs. C2, C2 vs. C3, C1 vs. C3). Gray dots represent individual cats and collectively show the overall distribution of populations. Selected breeds are highlighted by a colored circle where each colored circle corresponds to a population. The positions of the circles and the sizes are drawn to qualitatively distinguish between popular cat breeds (see materials and methods). (a) dimension 1, (b) dimension 2, (c) dimension 3. The Birman breed (light purple) consistently is a highly distinctive population. Asian breeds (light blues) are highly distinct from Western breeds (reds). Ocicat (grey) are a breed developed by crossing Abyssinians with Siamese and are intermediate in the gradation of cat breeds. The MDS of each population is presented in Supplementary Figure 4.
Figure 3
Figure 3
Population structure plot (K = 19) of twenty cat breeds and two wildcat populations. faststructure was used to examine the same cat populations as described for the MDS analyses. Cat breeds with the same colors indicate admixture and shared ancestry/cross-breeding. For examples, Peterbalds are derived from Siamese and Oriental lines and several breeds have been developed from Persian lineages, such as Munchkins and Scottish Fold, to obtain brachycephalic head structure.
Figure 4
Figure 4
Genome-wide estimate of linkage disequilibrium (LD) of cat breeds. (a) Decay of LD (r2) at different bins of inter-SNP distances. LD decay of selected population is shown as a color (see (b) for key to colors) and remaining populations are shown in gray. Solid black decay line corresponds to the random bred population, to which all breed populations are compared. Horizontal dotted line represents the maximum of r2 value in random bred population and the point of comparison between populations (the point of LD < 50 Kb). (b) Extent of LD (Kb) where the r2 value reaches that of random bred population.
Figure 5
Figure 5
Illustrative genome-wide association analyses for four phenotypic traits in the domestic cats. Manhattan plots of the association analyses where x-axis represents chromosomes, gray dots and left y-axis represent raw P-values of the association, and red/blue dots and right y-axis represent the permuted P-values. (ac) Remapping of three autosomal recessive traits (Dense, Long, and Color (cs allele), respectively) and (d) X – linked Orange using different populations. (a) Only the causal SNP for Dilute is associated in random bred cats on cat chromosome C1. (b) Several SNPs are associated with the long hair phenotype on chromosome B1 in LaPerm, a newer breed but with little selection for the trait. (c) Several SNPs are associated for the cs allele in Color on chromosome D1 in Persians, one of the oldest breeds where the coloration has some positive selection. (d) GWAS of Orange, an X-linked trait, suggesting a critical region for the locus.

References

    1. APPMA. National Pet Owner’s Survey. (American Pet Product Manufacturing Association 2008).
    1. AVMA. US Pet Ownership and Demographics Sourcebook. (American Veterinary Medical Association 2007).
    1. Nicholas, F. W., Brown, S. C. & Le Tissier, P. R. Online Mendelian Inheritance in Animals, OMIA, http://omia.angis.org.au (1998).
    1. Sunquist, M. S. F. Wild Cats of the World. (University of Chicago Press 2002).
    1. Nowak, R. M. Walker’s Mammals of the World. (The Johns Hopkins University Press 1999).

Publication types