. 2018 Aug;94(2):280-291.
doi: 10.1016/j.kint.2018.01.032. Epub 2018 May 4.

Kidney-targeted inhibition of protein kinase C-α ameliorates nephrotoxic nephritis with restoration of mitochondrial dysfunction

Affiliations

Kidney-targeted inhibition of protein kinase C-α ameliorates nephrotoxic nephritis with restoration of mitochondrial dysfunction

Nino Kvirkvelia et al. Kidney Int. 2018 Aug.

Abstract

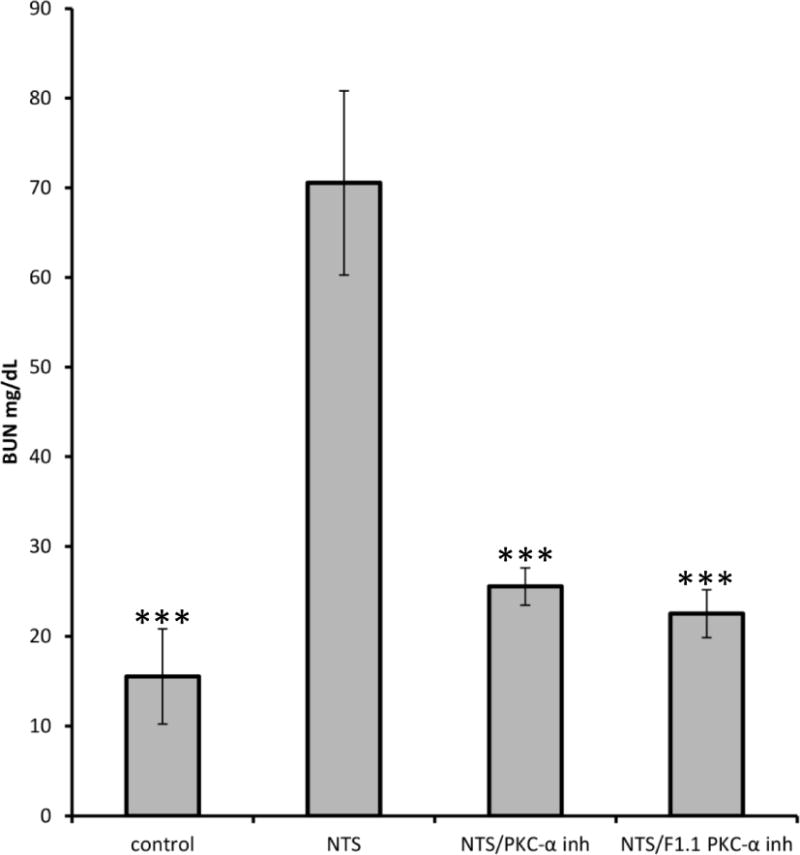
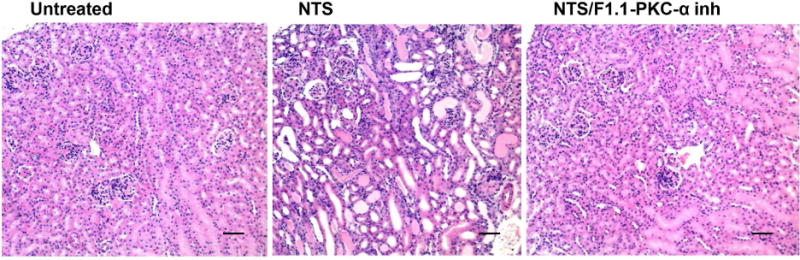
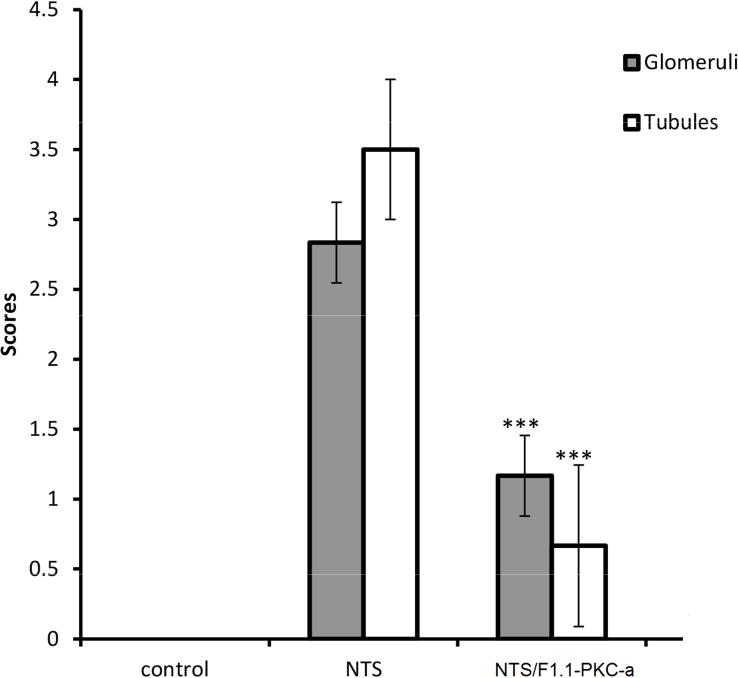
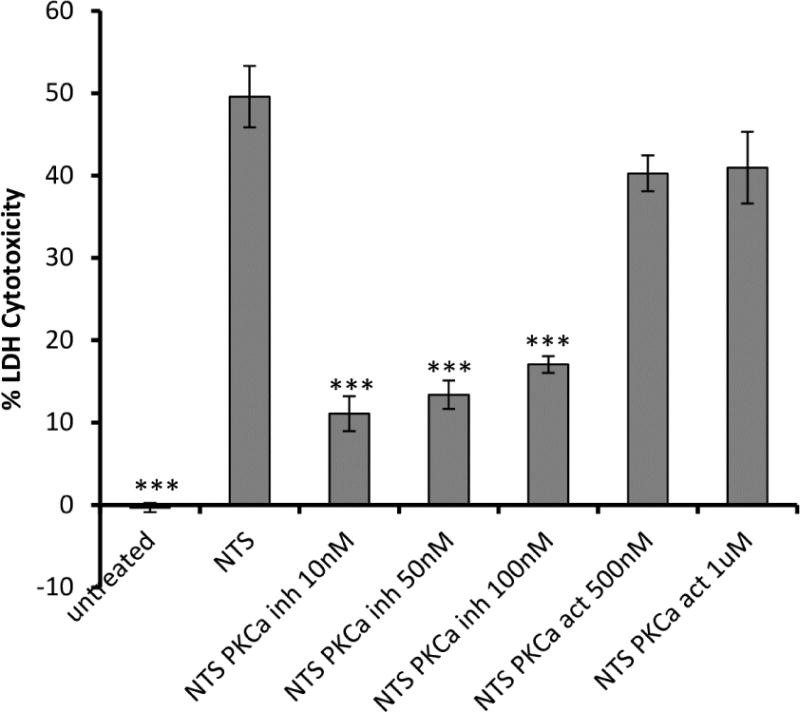
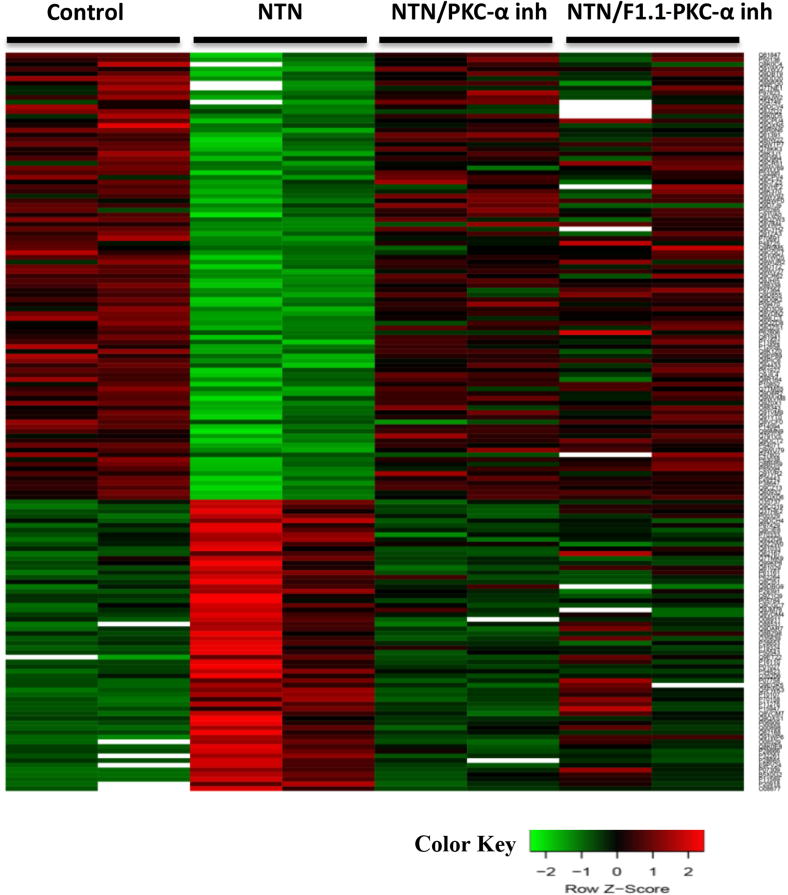
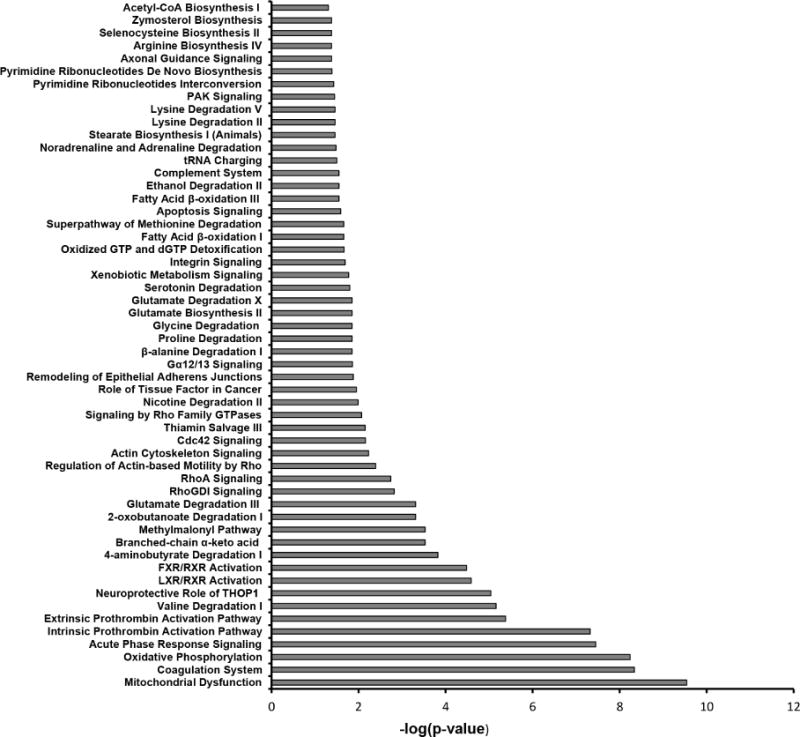
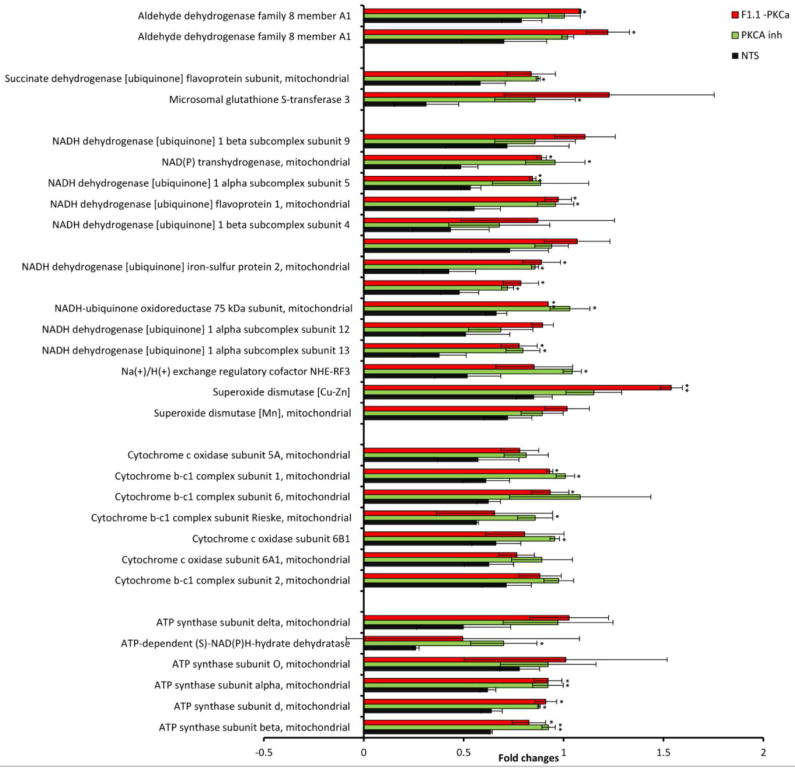
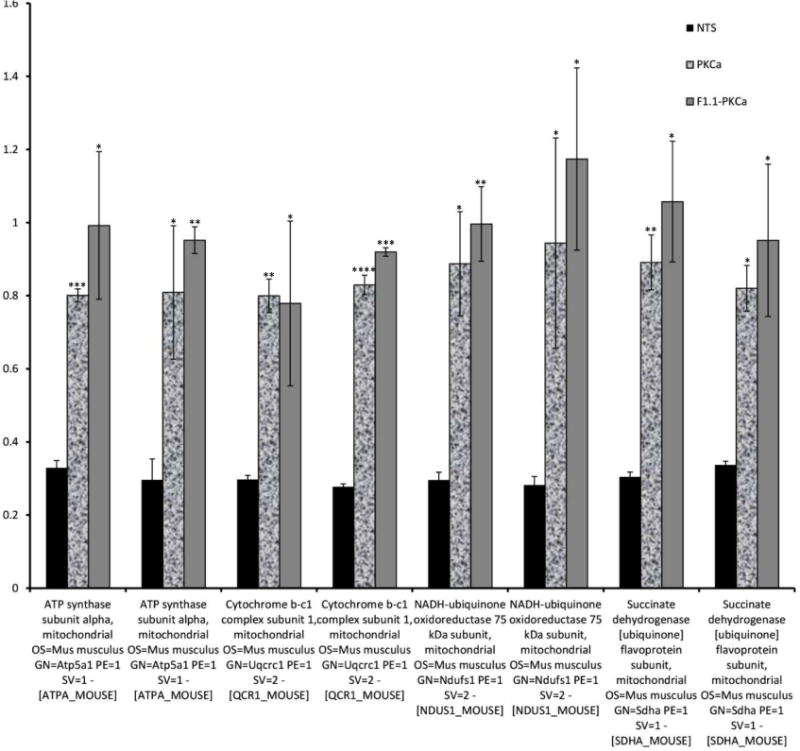
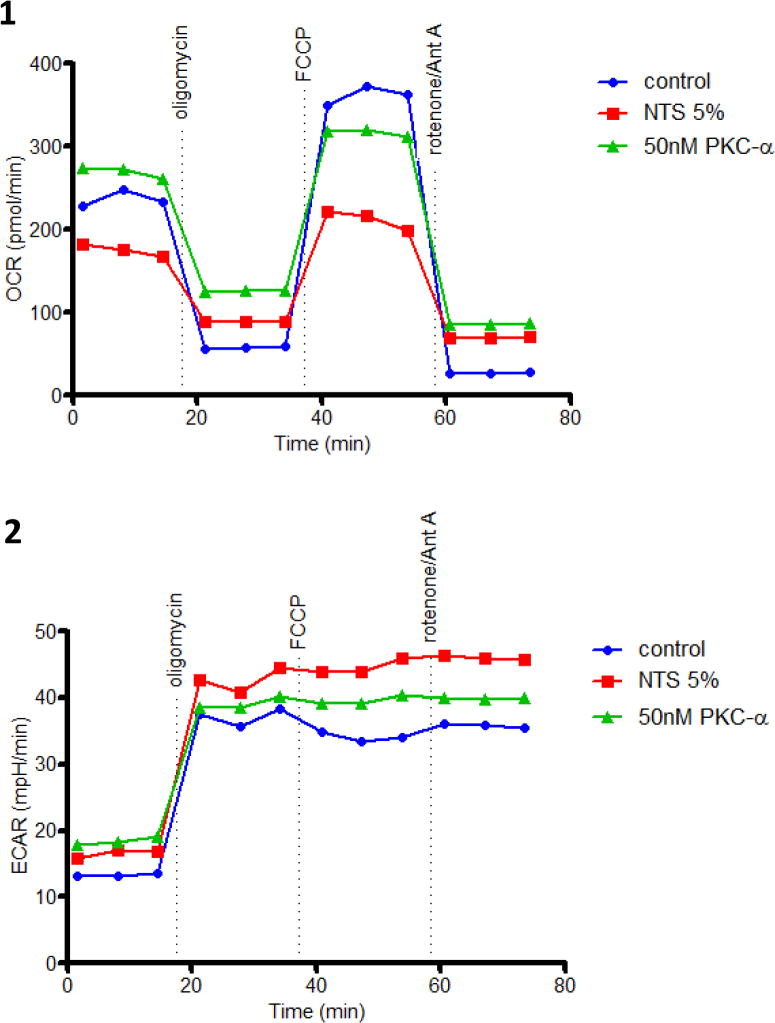
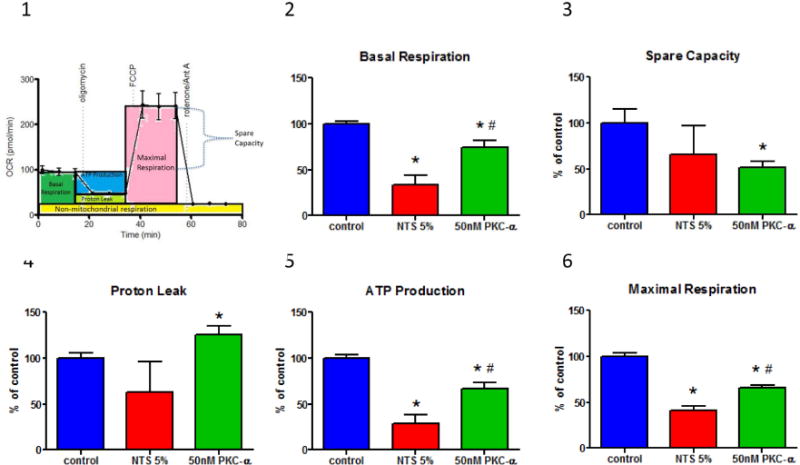
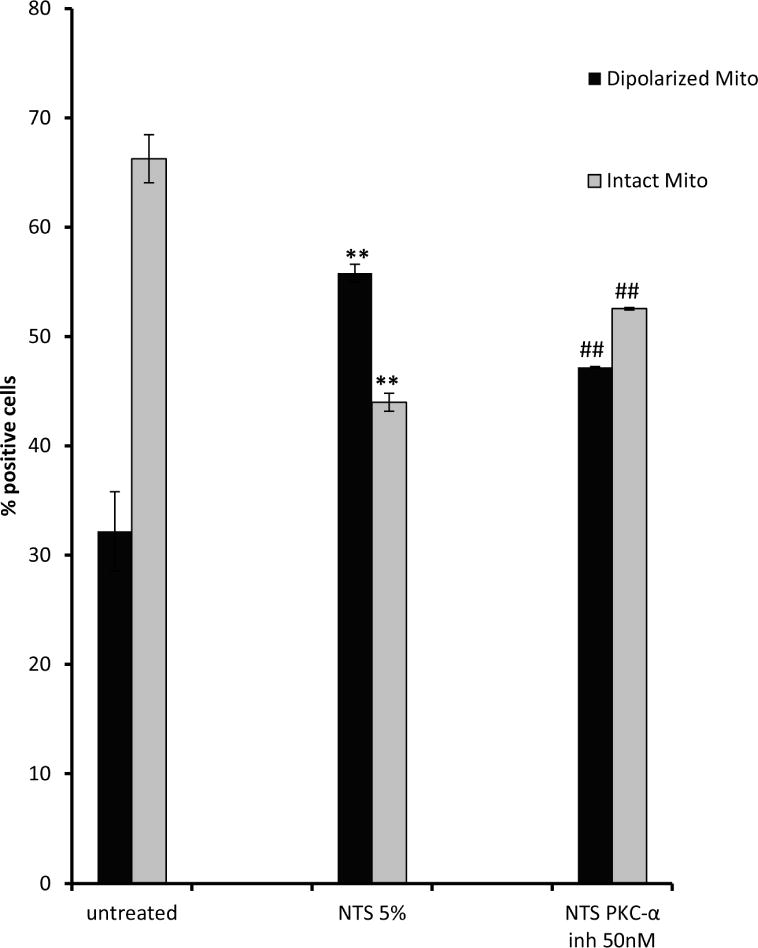
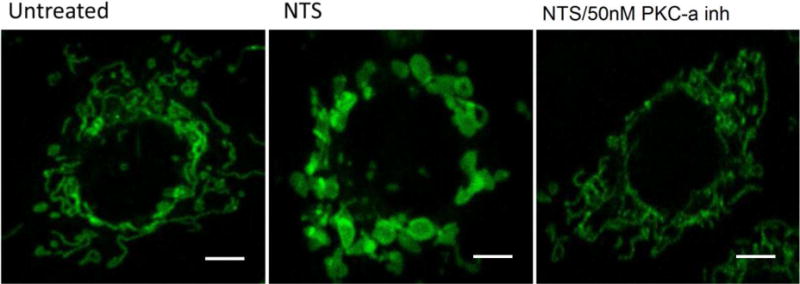
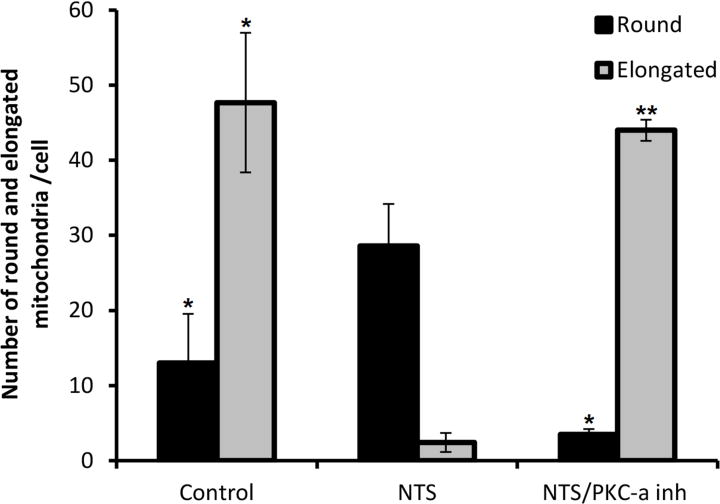
To investigate the role of protein kinase C-α (PKC-α) in glomerulonephritis, the capacity of PKC-α inhibition to reverse the course of established nephrotoxic nephritis (NTN) was evaluated. Nephritis was induced by a single injection of nephrotoxic serum and after its onset, a PKC-α inhibitor was administered either systemically or by targeted glomerular delivery. By day seven, all mice with NTN had severe nephritis, whereas mice that received PKC-α inhibitors in either form had minimal evidence of disease. To further understand the underlying mechanism, label-free shotgun proteomic analysis of the kidney cortexes were performed, using quantitative mass spectrometry. Ingenuity pathway analysis revealed 157 differentially expressed proteins and mitochondrial dysfunction as the most modulated pathway. Functional protein groups most affected by NTN were mitochondrial proteins associated with respiratory processes. These proteins were down-regulated in the mice with NTN, while their expression was restored with PKC-α inhibition. This suggests a role for proteins that regulate oxidative phosphorylation in recovery. In cultured glomerular endothelial cells, nephrotoxic serum caused a decrease in mitochondrial respiration and membrane potential, mitochondrial morphologic changes and an increase in glycolytic lactic acid production; all normalized by PKC-α inhibition. Thus, PKC-α has a critical role in NTN progression, and the results implicate mitochondrial processes through restoring oxidative phosphorylation, as an essential mechanism underlying recovery. Importantly, our study provides additional support for targeted therapy to glomeruli to reverse the course of progressive disease.

Keywords: PKC-α inhibition; glomerular endothelial cells; mitochondrial dysfunction; nephritis; proteomics; targeted delivery.


Figures

Figure 1
Figure 1. Systemic and kidney-targeted administration of PKC-α inhibitor promotes recovery during NTN
NTS 13.5 μl/g/bw was injected in C57BL/6 mice, followed by administration of PKC-α inhibitor (Ro-320432, 50ng/g/bw), the latter with or without conjugation to F1.1, on day 2, 4, 6 after NTS administration. A) BUN levels, day 7; *** indicates p<0.001 when samples compared to NTS treated ones; B) Light microscopy (H&E) were investigated on day 7 (scale bar: 80 μm). NTN mice displayed severe glomerular and tubulointerstitial injury. Limited signs of nephritis are evident in the treated mice groups. C) Quantification of H&E images by scoring of glomerular and tubular damage supported this conclusion. The clinical scores of glomerular injury were graded into five grades: 0 (normal), 1 (mild increase in cellularity), 2 (focal hypercellularity with increase of matrix), 3 (focal hypercellularity and proliferation in >50% of glomeruli), and 4 (diffuse proliferative change with crescents and sclerosis in >50% of glomeruli). Tubulointerstitial lesions were also graded from 0 to 4 according to the severity of inflammatory cell infiltration. (*** indicates p<0.001; **** p<0.0001 when compared to NTN).
Figure 2
Figure 2. PKC-α significantly inhibits NTS mediated glomerular endothelial cell cytotoxicity
Endothelial cells were treated with PKC-α inhibitor (Ro-320432,10 nM, 50 nM, 100 nM) or PKC activator (PDBu, 500 nM, 1 μM) o/n, 5% NTS was added for 48 h and cell death was evaluated by LDH release and expressed as percent of maximum LDH activity. Treatment of endothelial cells with PDBu together with NTS abolished the beneficial effect of PKC-α inhibition. (*** indicates p<0.001 when LDH cytotoxicity values of samples compared to NTS treated ones).
Figure 3
Figure 3. PKC-α inhibition normalizes NTN mediated decrease in abundance of proteins related to oxidative phosphorylation during the course of nephritis
Mass-spectrometry profiling of mice kidney cortexes of mice reveals distinct protein profiles associated with NTN and PKC-α inhibition. A) Heatmap represents levels of 157 proteins in 8 samples. Each row represents a protein and each column represents a sample. Two distinct clusters represent 95 downregulated and 62 upregulated proteins in NTS as compared to controls. The magnitude of protein levels are represented by the color ranging from green (low levels) to red (high levels). B) Ingenuity pathway analysis of differentially expressed proteins identifies mitochondrial dysfunction as the most differentially modulated pathway. C) Functional protein groups most affected by NTN were mitochondrial proteins associated with respiratory processes. Proteins of all four complexes of respiratory chain were down regulated in NTN mice, whereas their expression was restored with PKC-α inhibition. Protein abundances (PSM) were quantified in 2 proteomes from each group of mice and fold changes in protein availability measured by dividing their PSMs by controls; * indicates p<0.05; ** p<0.01 when fold changes of each group of mice compared to NTN group. D) Parallel Reaction Monitoring (PRM) assay validates proteomic profiling results of 4 mitochondrial proteins. PRM experiments were performed on the same LC-MS platform using the same LC elution conditions. One signature fragment for each candidate peptide was selected to calculate the peak area on the extracted ion chromatograph for that peptide using Thermo Xcalibur software (ver. 3.0.63, Thermo Scientific). The peak area for each peptide was then normalized by beta-actin/GADPH across different samples to compensate for possible experimental variations. (* indicates p<0.05; ** p<0.01; *** p<0.001; **** p<0.0001 when fold changes of proteins from each group of mice compared to NTN group).
Figure 4
Figure 4. PKC-α inhibition modulates mitochondrial respiration in endothelial cells
(A) Endothelial cells demonstrate decreased oxygen consumption (OCR) (A:1) and increased glycolytic lactic acid production (ECAR) (A:2) in the presence of NTS 5%, while oxygen consumption is improved when pretreated with 50 nM PKC-α. Mitochondrial stress test was performed by sequential addition of oligomycin (complex V inhibitor), FCCP (mitochondrial membrane depolarization), rotenone (complex I inhibitor) and antimycin (Ant A- complex III inhibitor). Graphs show one representative experiment run in duplicate. (B:1) A diagrammatic representation of mitochondrial stress test and functional significance of area under the curve (B:2-6) Basal respiration, spare capacity, proton leak, ATP production and maximal respiration were calculated from two experiments run in duplicate by the method shown in panel B:1 and normalized to the control values. Statistical analysis was performed using Mann-Whitney nonparametric test; (* indicates p<0.05 compared to control, # indicates p<0.05 compared to NTS 5% (n=4)).
Figure 5
Figure 5. PKC-α inhibition prevents NTS-induced mitochondrial membrane potential loss: mitochondrial depolarization and morphology changes
A) NTS treatment of endothelial cells resulted in increase of green fluorescence, (depolarized mitochondria), while PKC-α inhibition produced more orange fluorescence positive cells (healthy mitochondria). (** indicates p<0.01 compared to control, ## indicates p<0.01 compared to NTS). B) NTS treatment caused appearance of large and round shaped mitochondria, while in PKC-α inhibitor treated cells the majority of mitochondria resumed their normal rod-type shape appearance Mitochondrial distribution and their morphology in endothelial cells was evaluated using mitotracker– mitochondrion selective probes: MitoTracker Green FM (scale bar: 5 μm). C) Round and elongated mitochondria were quantified in a blinded manner in ×100 field. (3 fields per condition, * indicates p<0.0, ** indicates p<0.01).

Similar articles

Cited by

References

    1. Yung S, Zhang Q, Zhang CZ, Chan KW, Lui SL, Chan TM. Anti-DNA antibody induction of protein kinase C phosphorylation and fibronectin synthesis in human and murine lupus and the effect of mycophenolic acid. Arthritis and rheumatism. 2009;60(7):2071–2082. - PubMed
    1. Yung S, Zhang Q, Chau MK, Chan TM. Distinct effects of mycophenolate mofetil and cyclophosphamide on renal fibrosis in NZBWF1/J mice. Autoimmunity. 2015;48(7):471–487. - PubMed
    1. Kang N, Alexander G, Park JK, et al. Differential expression of protein kinase C isoforms in streptozotocin-induced diabetic rats. Kidney international. 1999;56(5):1737–1750. - PubMed
    1. Koya D. Dual protein kinase C alpha and beta inhibitors and diabetic kidney disease: a revisited therapeutic target for future clinical trials. Journal of diabetes investigation. 2014;5(2):147–148. - PMC - PubMed
    1. Tossidou I, Teng B, Menne J, et al. Podocytic PKC-alpha is regulated in murine and human diabetes and mediates nephrin endocytosis. PloS one. 2010;5(4):e10185. - PMC - PubMed

Publication types

MeSH terms

LinkOut - more resources