

doi: 10.1016/j.jaci.2018.03.011.
Epub 2018 May 3.
A novel human mast cell activation test for peanut allergy
Affiliations
- PMID: 29731128
- PMCID: PMC6080741
- DOI: 10.1016/j.jaci.2018.03.011
Item in Clipboard
A novel human mast cell activation test for peanut allergy
J Allergy Clin Immunol.
2018 Aug.
No abstract available
Figures
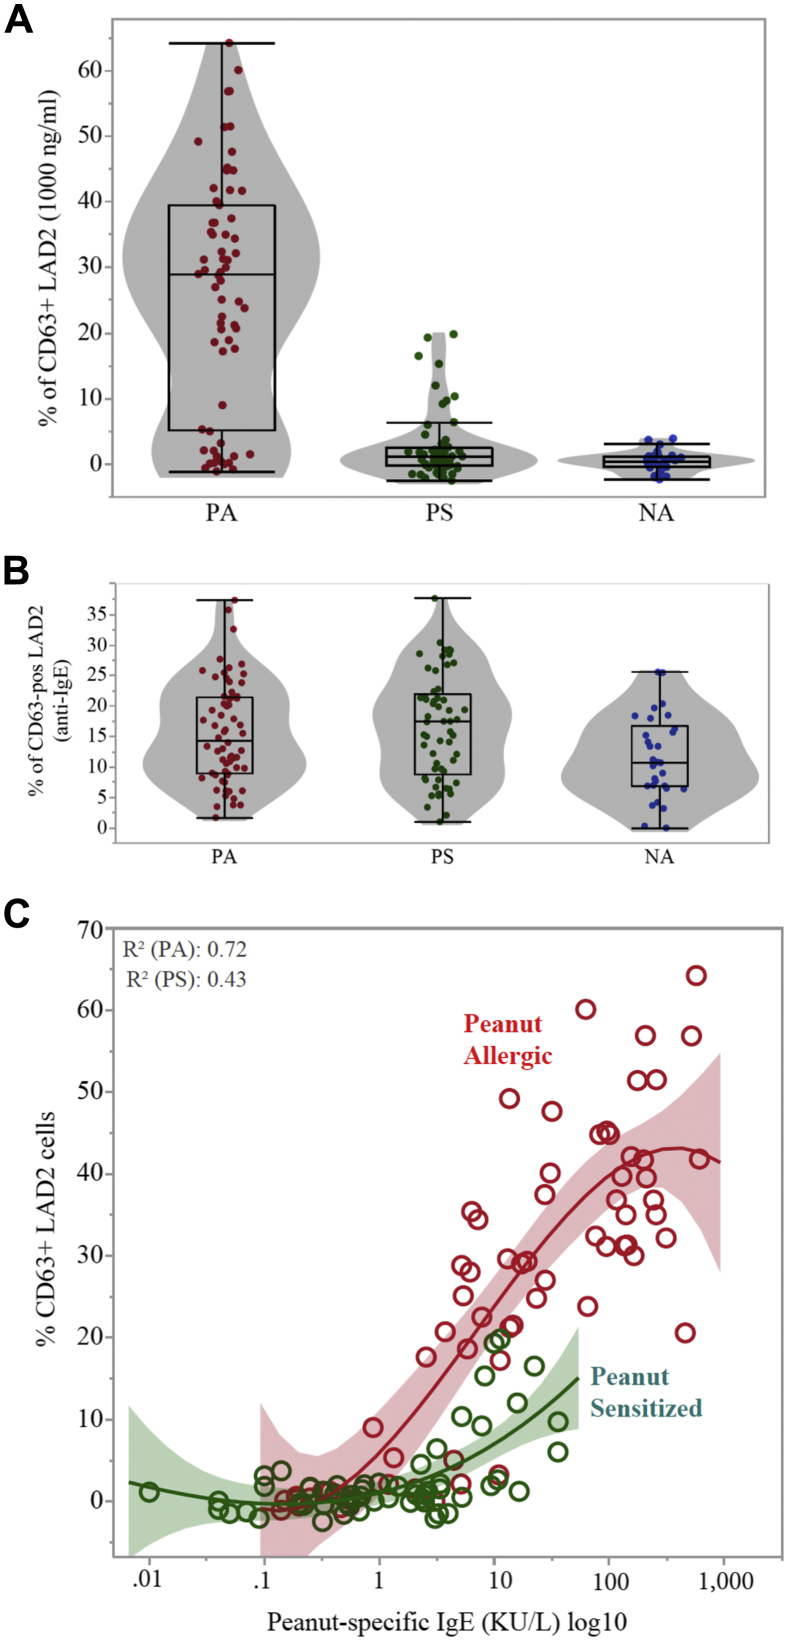
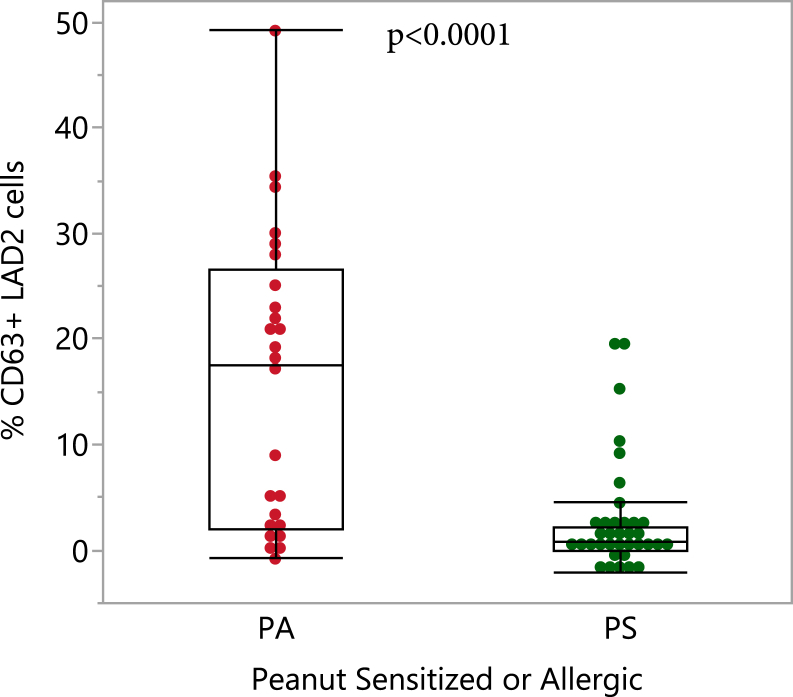
Proportion of activated LAD2 cells expressed as a percentage of CD63+ cells sensitized with plasma from children with PA, PS children, or NA children and stimulated with peanut extract (1000 ng/mL; A) or anti-IgE (1 μg/mL; B) and in relation to levels of P-sIgE (C).
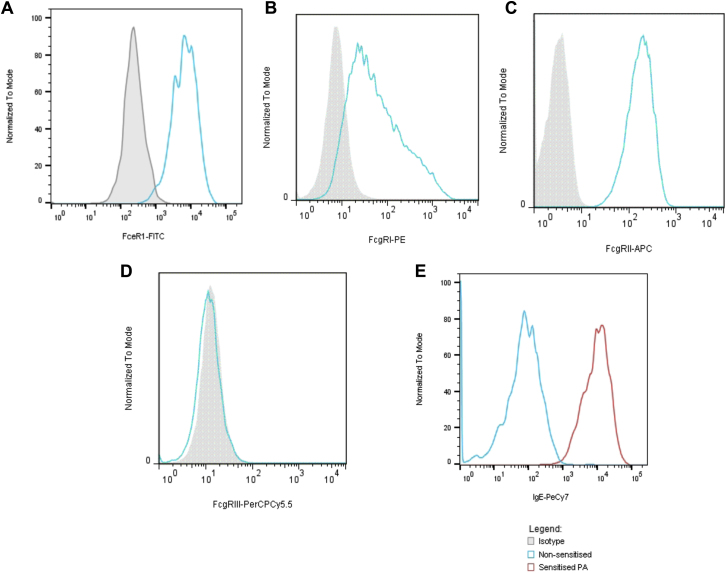
A-D, Expression of FcεRI (Fig E1, A), FcγRI (Fig E1, B), FcγRII (Fig E1, C), and FcγRIII (Fig E1, D) on the surfaces of LAD2 cells. E, IgE was detectable on the surfaces of LAD2 cells after sensitization. The histogram in blue represent nonsensitized LAD2 cells, and the histogram in red represents LAD2 cells sensitized with plasma from a patient with PA. APC, Allophycocyanin; FITC, fluorescein isothiocyanate; PE, phycoerythrin; PerCP, peridinin-chlorophyll-protein complex.
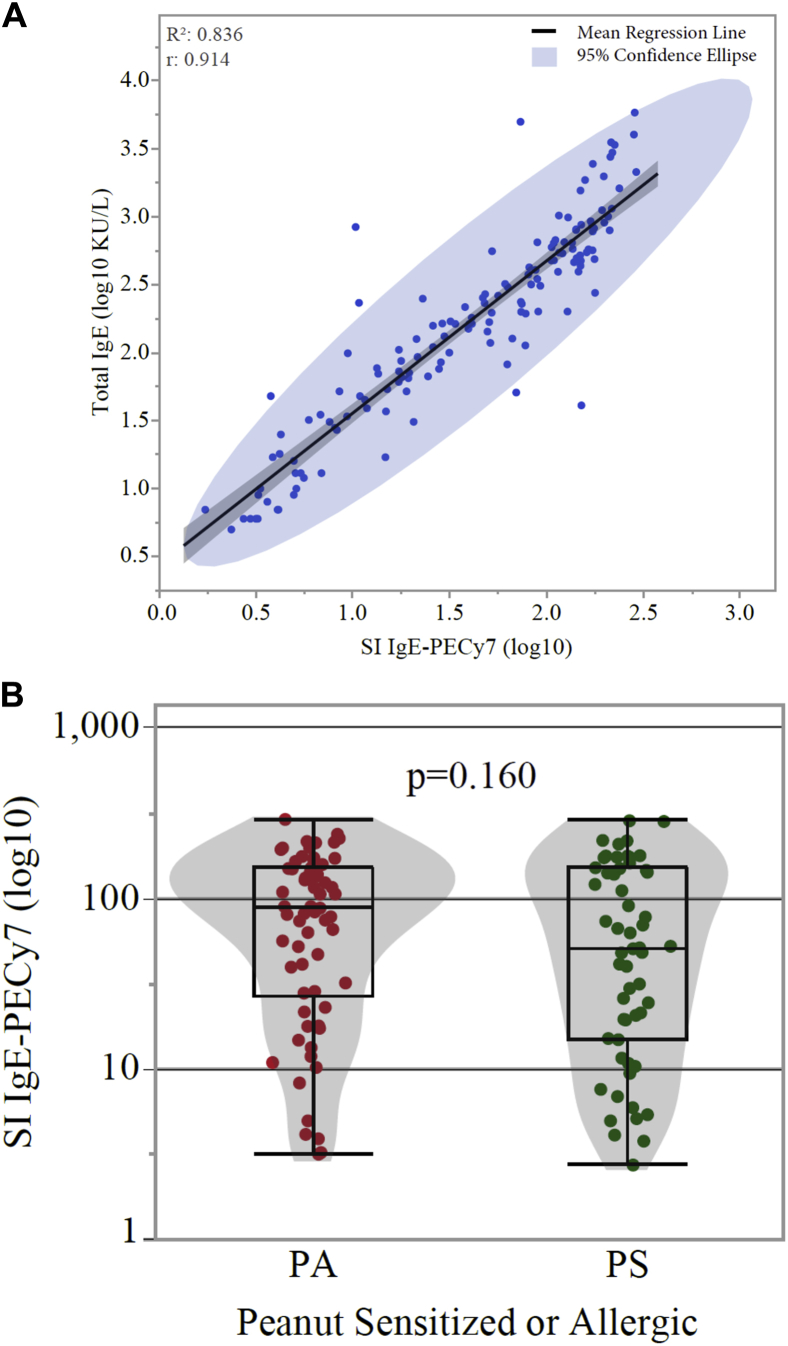
A, Correlation between IgE levels on the surface of LAD2 cells and total IgE levels in the plasma that the cells were sensitized with (Rs = 0.914, P < .001). B, Distribution of stimulation index (SI) IgE phycoerythrin-Cy7 in LAD2 cells sensitized with plasma from children with PA and PS children was not significantly different (P = .160).
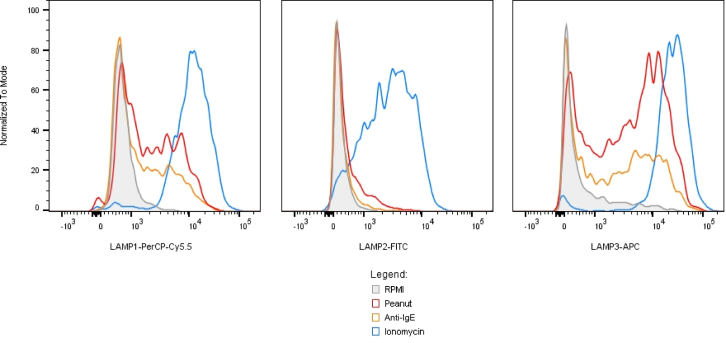
Expression of lysosomal-associated membrane proteins (LAMPs) on the surface of LAD2 cells after stimulation with IgE-mediated and non–IgE-mediated stimulants. LAMP-1 (CD107a) and LAMP-3 (CD63) expression increases with degranulation after stimulation with peanut extract (in red), anti-IgE (in orange), or ionomycin (in blue), whereas LAMP-2 (CD107b) expression increases with degranulation with ionomycin but not IgE-mediated stimulants. The gray shaded area corresponds to the negative control (ie, unstimulated cells). APC, Allophycocyanin; FITC, fluorescein isothiocyanate; PerCP, peridinin-chlorophyll-protein complex.
Activation of LAD2 cells sensitized with plasma samples from children with PA and PS children containing similar levels of P-sIgE ranging between 0.35 and 15.0 KU/L (which correspond to the 95% negative predictive value and 95% positive predictive value determined for P-sIgE, respectively). PA, Peanut allergic; PS, peanut sensitized tolerant.
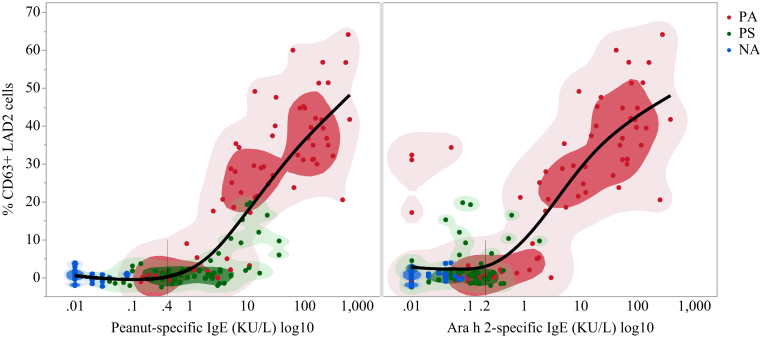
Proportion of activated mast cells sensitized with plasma samples containing varying levels of P-sIgE and Ara h 2–specific IgE. The lower limit of specific IgE above which the mast cell activation assay is reliable was estimated for peanut-specific IgE (0.4 KU/L) and for Ara h 2-specific IgE (0.2 KU/L) by observing the beginning of the inflection point from a cubic spline with a λ value of 0.8 (where the reference line intersects the smoothed regression line). PA, Peanut allergic; PS, peanut sensitized tolerant; NA, nonsensitized nonallergic.
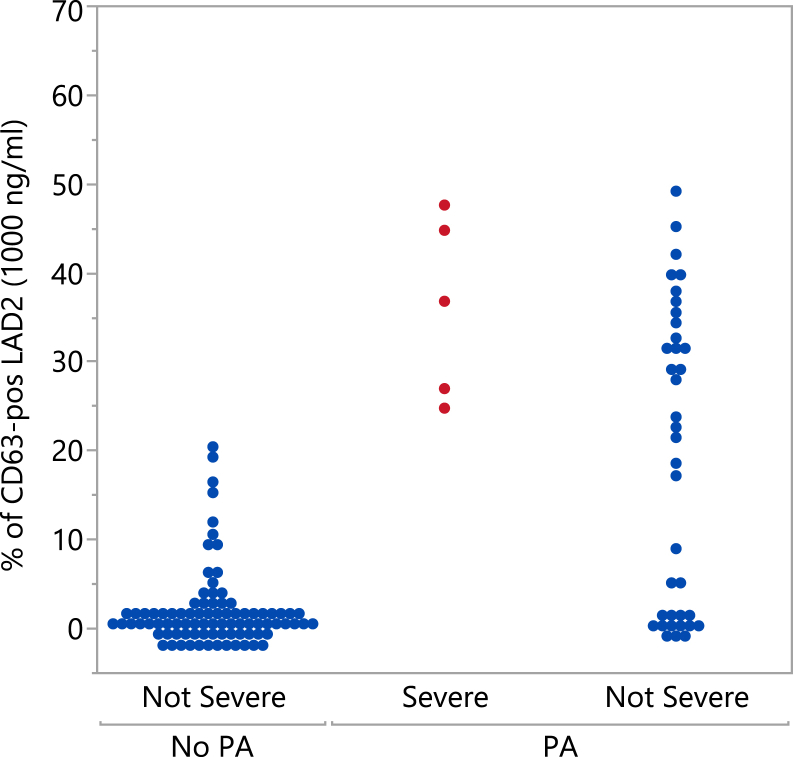
Mast cell activation to peanut extract (1000 ng/mL) in patients with no PA (in blue at left), patients with severe allergic reactions to peanut during the OFC (in red), and patients with PA who had mild-to-moderate reactions during the OFC (in blue at right).
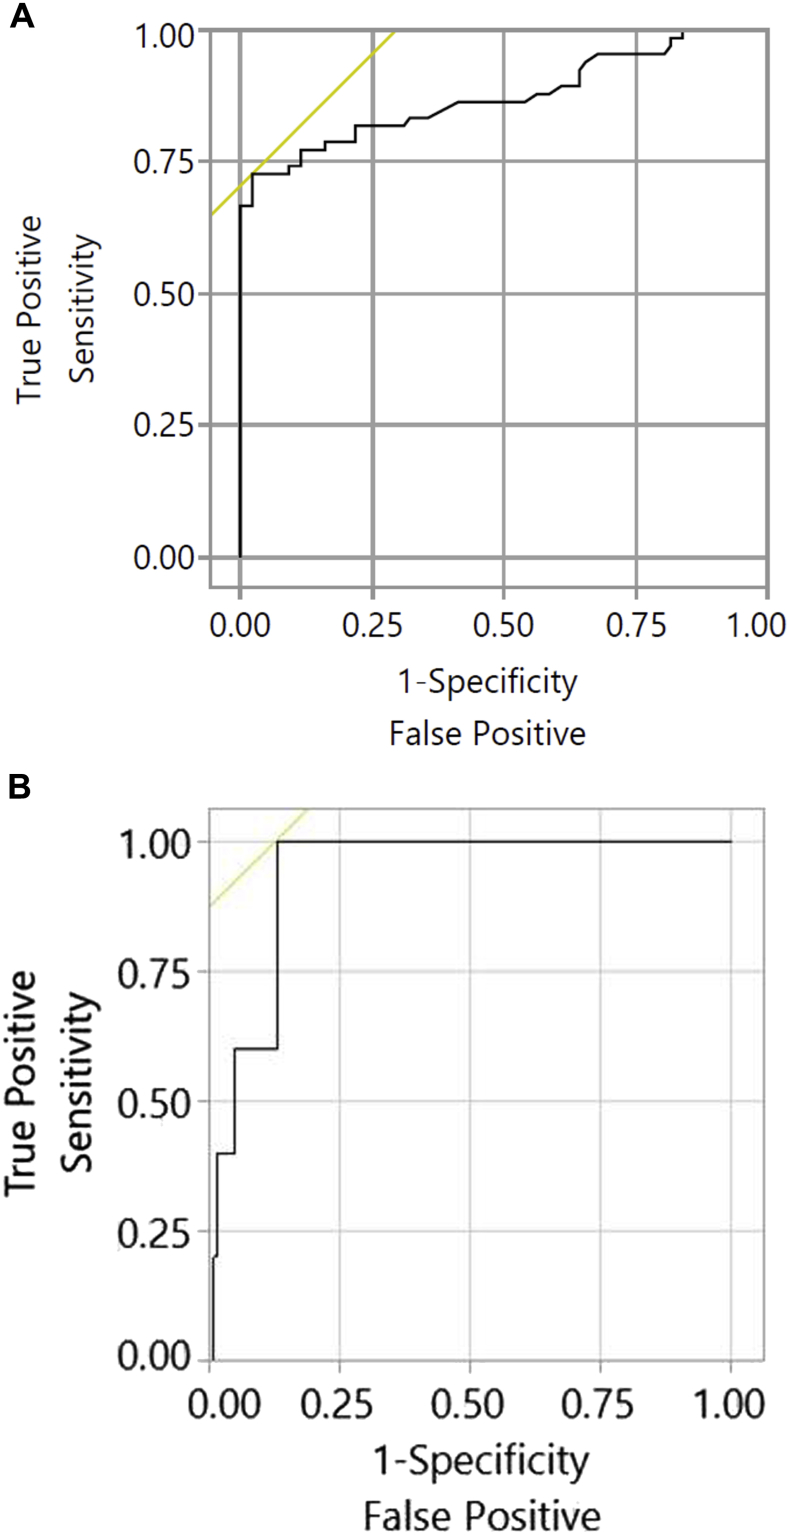
Receiver operating characteristic curve for the MAT to diagnose peanut allergy (A) and to identify patients at risk of severe reactions (B). The overall area under the receiver operating characteristic curve was 0.874 for Fig E7, A, and 0.934 for Fig E7, B.
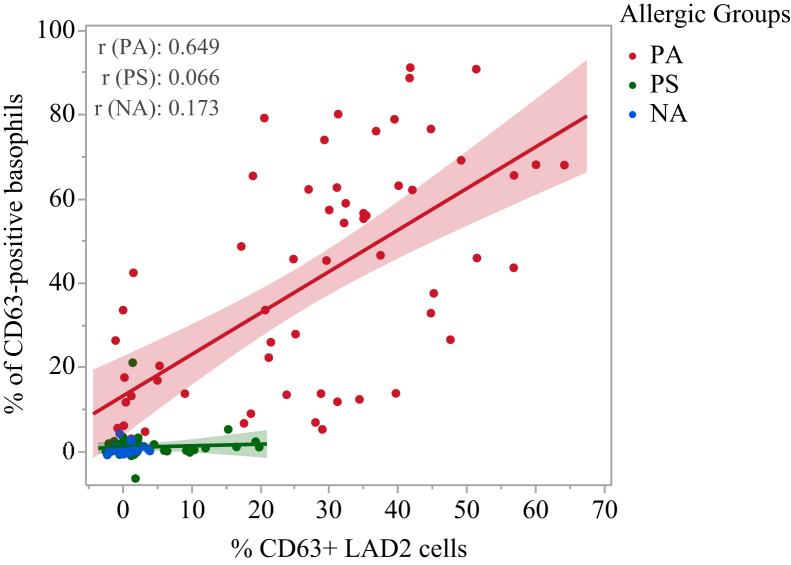
Correlation between MAT results and BAT results for the same patients. Rs = 0.808 and P < .001 for the whole population and when stratified by allergic groups: 0.649, 0.066, and 0.173 for the PA, PS, and NA groups, respectively.
References
-
- Nicolaou N., Poorafshar M., Murray C., Simpson A., Winell H., Kerry G. Allergy or tolerance in children sensitized to peanut: prevalence and differentiation using component-resolved diagnostics. J Allergy Clin Immunol. 2010;125:191–197. e1-13. - PubMed
-
- Hoffmann H.J., Santos A.F., Mayorga C., Nopp A., Eberlein B., Ferrer M. The clinical utility of basophil activation testing in diagnosis and monitoring of allergic disease. Allergy. 2015;70:1393–1405. - PubMed
Publication types
MeSH terms
Substances
Grants and funding
LinkOut - more resources
Full Text Sources
Other Literature Sources
