. 2018 May 31;173(6):1398-1412.e22.
doi: 10.1016/j.cell.2018.03.068. Epub 2018 May 3.

Promoter of lncRNA Gene PVT1 Is a Tumor-Suppressor DNA Boundary Element

Affiliations

Promoter of lncRNA Gene PVT1 Is a Tumor-Suppressor DNA Boundary Element

Seung Woo Cho et al. Cell. .

Abstract

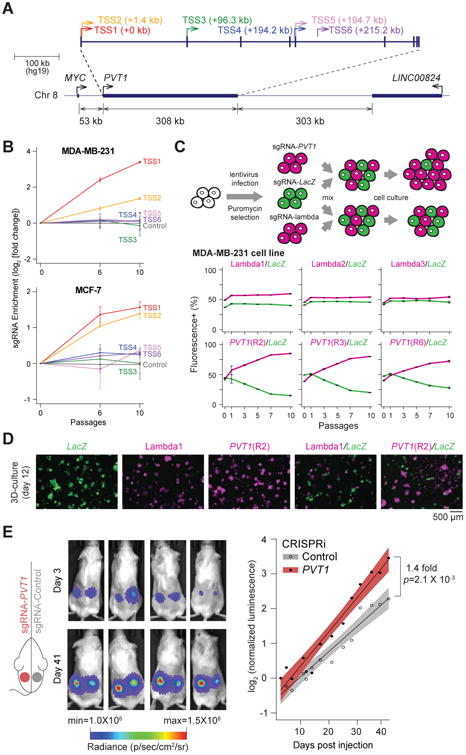
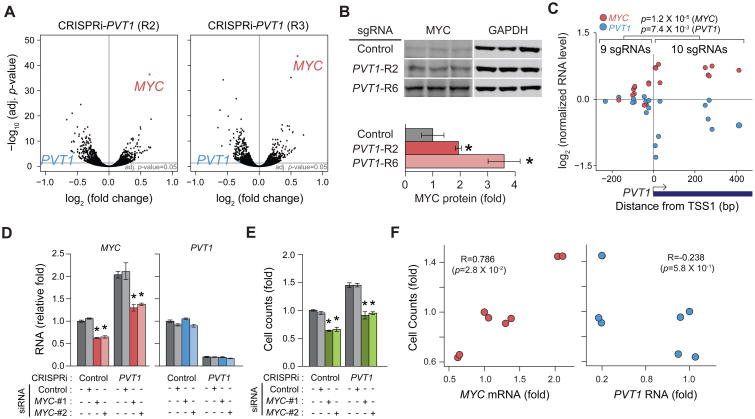
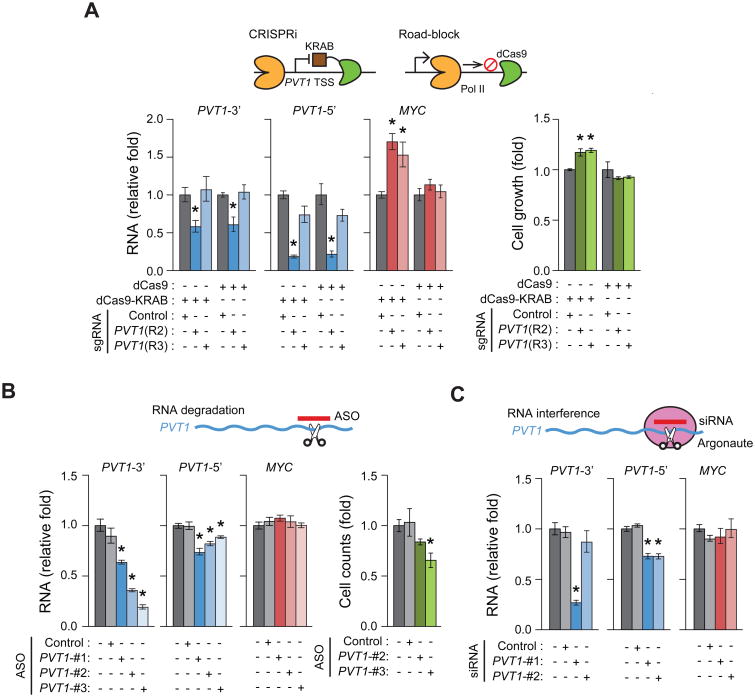
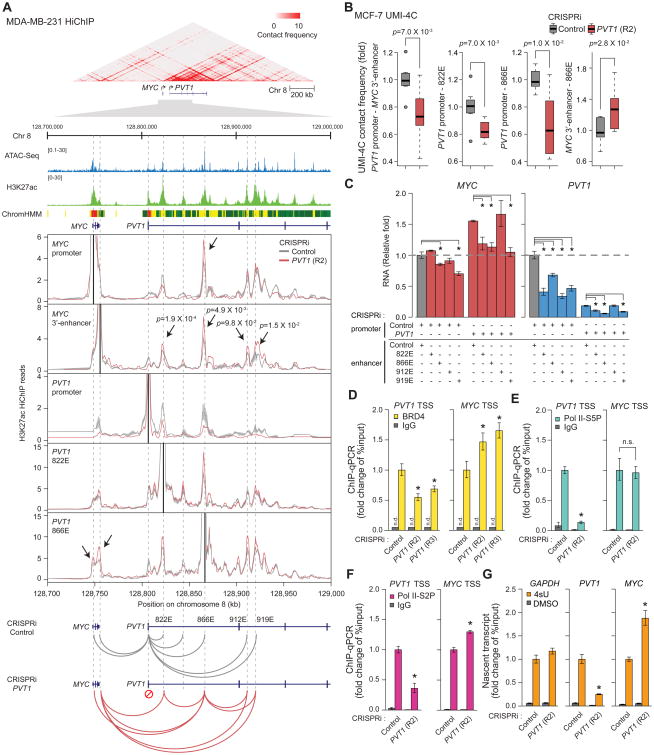
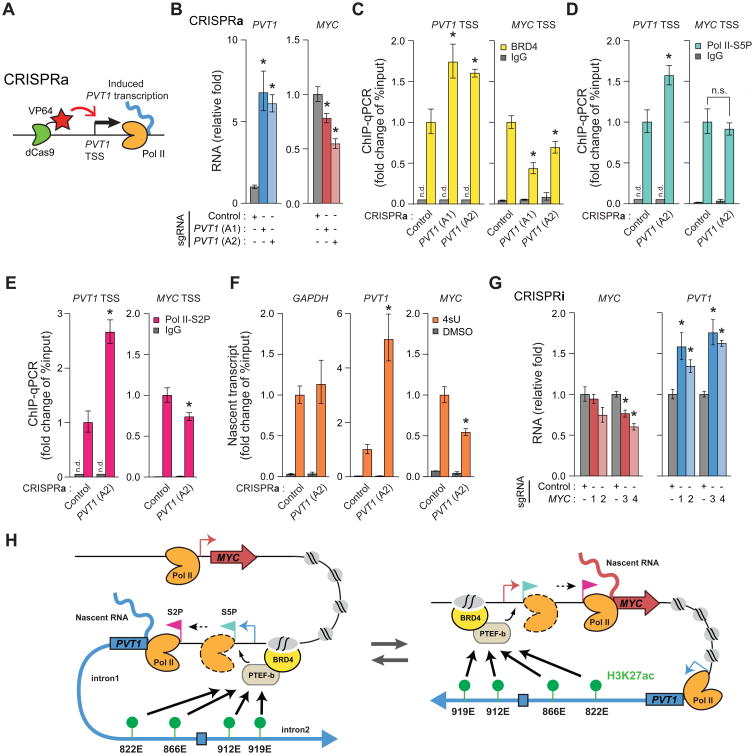
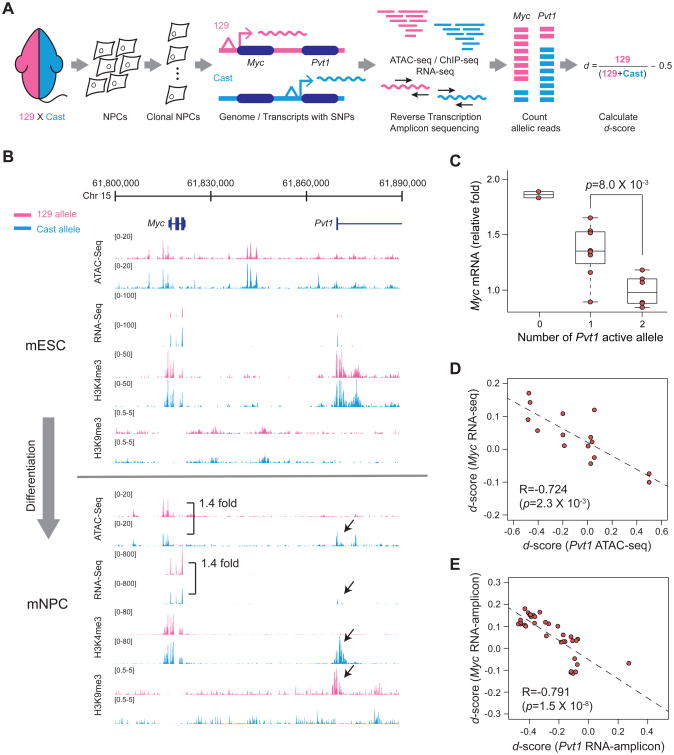
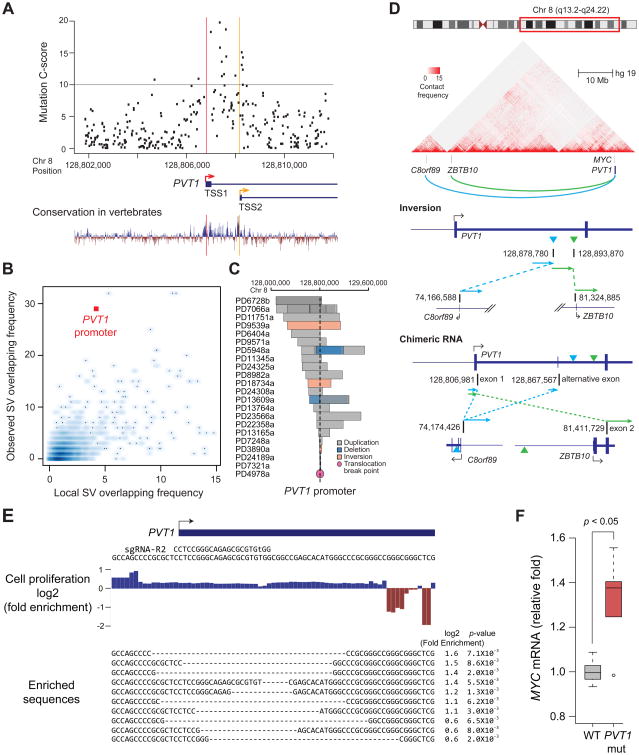
Noncoding mutations in cancer genomes are frequent but challenging to interpret. PVT1 encodes an oncogenic lncRNA, but recurrent translocations and deletions in human cancers suggest alternative mechanisms. Here, we show that the PVT1 promoter has a tumor-suppressor function that is independent of PVT1 lncRNA. CRISPR interference of PVT1 promoter enhances breast cancer cell competition and growth in vivo. The promoters of the PVT1 and the MYC oncogenes, located 55 kb apart on chromosome 8q24, compete for engagement with four intragenic enhancers in the PVT1 locus, thereby allowing the PVT1 promoter to regulate pause release of MYC transcription. PVT1 undergoes developmentally regulated monoallelic expression, and the PVT1 promoter inhibits MYC expression only from the same chromosome via promoter competition. Cancer genome sequencing identifies recurrent mutations encompassing the human PVT1 promoter, and genome editing verified that PVT1 promoter mutation promotes cancer cell growth. These results highlight regulatory sequences of lncRNA genes as potential disease-associated DNA elements.

Keywords: CRISPRi; MYC; PVT1; enhancer; lncRNA; promoter; topological domains; transcriptional regulation; tumor suppressor.


Figures

Figure 1
Figure 1. CRISPRi-PVT1 enhanced cancer cell proliferation
A, Schematic representing the PVT1 locus and six TSS of PVT1. B, Enrichment of sgRNAs targeting PVT1 in two breast cancer cell lines at indicated passages. Error bars indicate mean ± SD for top 3 sgRNAs targeting each TSS. C, Cell growth competition assay for CRISPRi-PVT1 in MDA-MB-231 cell line. Schematic representation of the assay (upper). Plots showing percentage of mCherry+ or GFP+ cells at indicated passages (bottom). Error bars indicate mean ± SD (n=3, technical replicates). D, Fluorescence microscopy image of cell growth competition assay by 3D cell culture of MDA-MB-231 cell line. For C and D, target genes of sgRNA are shown in the same color as of the fluorescent marker above each panel. E, Tumor growth of subcutaneous xenografted MDA-MB-231 with CRISPRi-Control or CRISPRi-PVT1 (R2). Luminescence images at day 3 or day 41 post injection(left). Fitted growth curve of injected tumor cells (right). p-value was calculated by paired Mann-Whitney U-test (n=12 for each). Shaded region indicates 95% confidence intervals.
Figure 2
Figure 2. Pro-growth phenotype was induced by increased MYC expression in MDA-MB-231 cell line
A, RNA-seq results comparing CRISPRi-Control and CRISPRi-PVT1 cell line (n=2, biological replicates). B, Western blot analysis for MYC protein changed by CRISPRi-PVT1 (top) and relative quantification of MYC protein (bottom). Error bars indicate mean ± SD. (n=3, biological replicates). C, Comparison of MYC and PVT1 RNA level between CRISPRi targeting upstream and downstream of PVT1-TSS1. p-values were calculated by unpaired Mann-Whitney U-test. D and E, qRT-PCR for relative RNA levels of MYC and PVT1 (D) or relative cell counts at day 4 post transfection (E) with siRNA targeting MYC with CRISPRi-Control or CRISPRi-PVT1 (R2). Error bars indicate mean ± SEM (n=3, biological replicates). F, Correlation between relative cell counts and MYC (left) or PVT1 (right) RNA level described in Figure 2D and 2E. Spearman's coefficient (R) and p-value are shown. *p<0.05, using unpaired t-test compared with control (dark grey).
Figure 3
Figure 3. PVT1 lncRNA independent mechanism for MYC induction in MDA-MB-231 cell line
A, qRT-PCR for relative RNA level of MYC or PVT1 (left) or relative cell growth at day 4 post plating (right) for sgRNA-Control or sgRNA-PVT1 with dCas9-KRAB or dCas9. Relative cell growth was measured by MTT assay. B, qRT-PCR for relative RNA levels of MYC and PVT1 (left) or relative cell count at day 4 post transfection (right) with ASO targeting PVT1. C, qRT-PCR for relative RNA levels of MYC and PVT1 with siRNA targeting PVT1. Schematic representation for each experiment is shown above each plot. Error bars indicate mean ± SEM (n=3, biological replicates). *p<0.05, using unpaired t-test compared with control (dark grey).
Figure 4
Figure 4. PVT1 promoter suppresses MYC transcription by competing for PVT1 intragenic enhancers
A, PVT1 promoter functions as a boundary element in MDA-MB-231 cell line. Top: Heat-map representing chromatin conformation around PVT1 locus measured by H3K27ac HiChIP (n=2, biological replicates). ATAC-seq peaks, H3K27ac ChIP-seq peaks and ChromHMM diagram are shown to indicate enhancer elements. Middle: Virtual 4C plots showing H3K27ac HiChIP contact frequency at 1 kb resolution anchored at each indicated genomic position (solid black lines) with CRISPRi-Control or CRISPRi-PVT1. Bottom: Schematic diagram showing changes in chromosome interaction induced by CRISRPi-PVT1. Shaded region indicates mean ± SEM (n=2, biological replicates). p-value of each interaction between MYC 3′-enhancer and PVT1 intragenic enhancer was calculated by Fisher's exact test. B, Boxplots showing chromosome contact frequency at 5 kb resolution measured by UMI-4C in MCF-7 cell line with CRISPRi-Control or CRISPRi-PVT1 (R2). p-value was calculated by un-paired Mann-Whitney U-test (n=8). C, qRT-PCR for relative RNA level of MYC and PVT1 with dual CRISPRi targeting PVT1 promoter or intragenic enhancers in MDA-MB-231 cell line. The difference between single CRISPRi-PVT1 and dual CRISPRi-PVT1 with CRISPRi-enhancer (822E, 866E or 919E) is not significant (p>0.05). D to F, ChIP-qPCR representing relative PVT1 or MYC promoter DNA bound to BRD4 (D), Pol II-S5P (E), Pol II-S2P (F) in MDA-MB-231 cell line with CRISPRi-control or CRISPRi-PVT1. G, qRT-PCR for the relative level of 4sU-labeled nascent transcripts of PVT1 or MYC in MDA-MB-231 cell line with CRISPRi-control or CRISPRi-PVT1. Error bars indicate mean ± SEM (n=3, biological replicates). *p<0.05, using unpaired t-test compared with control (dark grey). n.s., not significant (p>0.05); n.d., not detected. See also STAR METHOD for details.
Figure 5
Figure 5. PVT1 reversibly regulates MYC transcription in MDA-MB-231 cell line
A, Schematic representing CRISPRa at PVT1 promoter. B, qRT-PCR for PVT1 or MYC with CRISPRa-control or CRISPRa-PVT1. C to E, ChIP-qPCR for PVT1 or MYC TSS for BRD4 (C), Pol II-S5P (D) or Pol II-S2P (E) with CRISPRa-Control or CRISPRa-PVT1. F, qRT-PCR for relative level of 4sU-labeled nascent transcripts with CRISPRa-Control or CRISPRa-PVT1. G, qRT-PCR for PVT1 or MYC with CRISPRi-Control or CRISPRi-MYC. H, Schematic representing the model of promoter-enhancer competition between PVT1 and MYC. Error bars indicate mean ± SEM (n=3, biological replicates). *p<0.05, using un-paired t-test compared with control (grey). n.s., not significant (p>0.05); n.d., not detected.
Figure 6
Figure 6. PVT1 promoter regulates MYC expression in cis and allele-specific manner
A, Schematic representing experiments for allele-specific regulation. B, ATAC-seq, RNA-seq, H3K9me3 or H3K4me3 signals around PVT1-MYC locus measured in mESC or mNPC derived from a hybrid mouse. Reads with SNPs corresponding to the 129 or Cast allele are shown as pink or blue, respectively. C, Box plot showing MYC mRNA level according to the number of active PVT1 alleles. p-value was calculated by unpaired Mann-Whitney U-test. D, Correlation between the d-score for accessibility of the PVT1 locus from ATAC-seq and MYC transcription level from RNA-seq. For C and D, n=15 from 11 clones and 4 additional technical replicates. E, Correlation between d-score of RNA level measured by targeted RNA-seq (n=35). For D and E, Spearman's coefficient (R) and p-value are shown.
Figure 7
Figure 7. PVT1 promoter functions as a tumor suppressor
A, Scatter plot representing C-scores for variants at PVT1-TSS ± 5 kb region from CADD analysis (upper) and conservation plot (bottom). Grey line indicates C-score=10, top 10%. TSS1 or TSS2 of PVT1 is shown as a red or yellow line, respectively. B, Number of SVs including duplications, deletions and inversions overlapping with lncRNA promoter in the BRCA-EU cohort (y-axis). Basal SV frequency was measured in adjacent windows within 5 megabase (x-axis). See also STAR METHOD. C, SVs encompassing the PVT1 promoter in breast tumor patients. The patient ID is shown on the left. D, Genomic structure showing a recurrent intra-chromosomal inversion within PVT1 intron 1 in breast tumor patients. Ideogram of Chr. 8, heat-map of chromatin conformation within indicated region (top), inversion in genomic context (middle) and fusion transcription found in this tumor (bottom) were shown. E, Footprinting for regulatory element of PVT1 promoter. Fold changes of each base or alleles after 10 passages (for p<0.01) were listed. F, Relative MYC mRNA level compared between MDA-MB-231 cells harboring unmodified or mutant allele of PVT1 promoter. p-value was calculated by using unpaired Mann-Whitney U-test (n=6 for each).

Comment in

References

    1. Adamson B, Norman TM, Jost M, Cho MY, Nunez JK, Chen Y, Villalta JE, Gilbert LA, Horlbeck MA, Hein MY, et al. A Multiplexed Single-Cell CRISPR Screening Platform Enables Systematic Dissection of the Unfolded ProteinResponse. Cell. 2016;167:1867–1882 e1821. - PMC - PubMed
    1. Adey A, Burton JN, Kitzman JO, Hiatt JB, Lewis AP, Martin BK, Qiu R, Lee C, Shendure J. The haplotype-resolved genome and epigenome of the aneuploid HeLa cancer cell line. Nature. 2013;500:207–211. - PMC - PubMed
    1. Anderson KM, Anderson DM, McAnally JR, Shelton JM, Bassel-Duby R, Olson EN. Transcription of the non-coding RNA upperhand controls Hand2 expression and heart development. Nature. 2016;539:433–436. - PMC - PubMed
    1. Blancafort P, Magnenat L, Barbas CF., 3rd Scanning the human genome with combinatorial transcription factor libraries. Nat Biotechnol. 2003;21:269–274. - PubMed
    1. Buenrostro JD, Wu B, Chang HY, Greenleaf WJ. ATAC-seq: A Method for Assaying Chromatin Accessibility Genome-Wide. Curr Protoc Mol Biol. 2015;109:21 29 21–29. - PMC - PubMed

Publication types

MeSH terms