. 2018 May 31;173(6):1329-1342.e18.
doi: 10.1016/j.cell.2018.04.004. Epub 2018 May 3.

Corticoamygdala Transfer of Socially Derived Information Gates Observational Learning

Affiliations

Corticoamygdala Transfer of Socially Derived Information Gates Observational Learning

Stephen A Allsop et al. Cell. .

Abstract

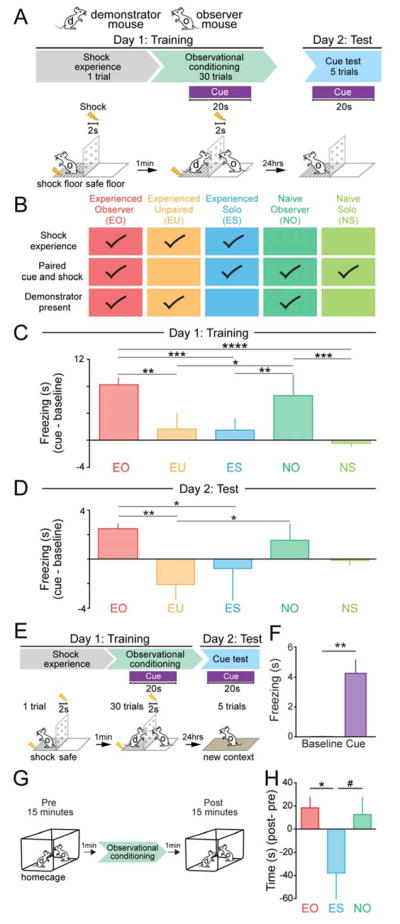
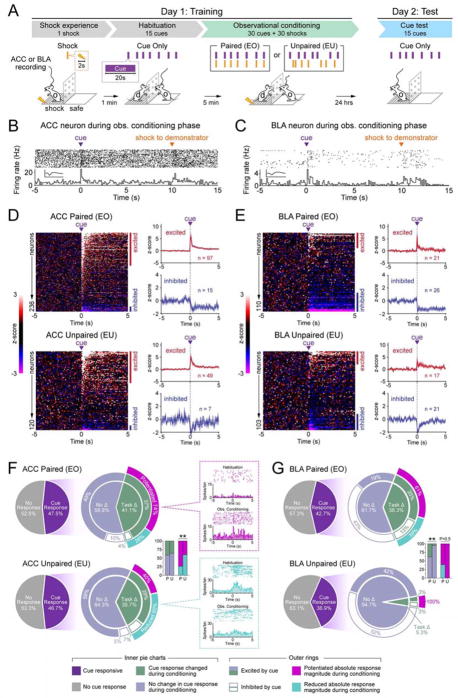
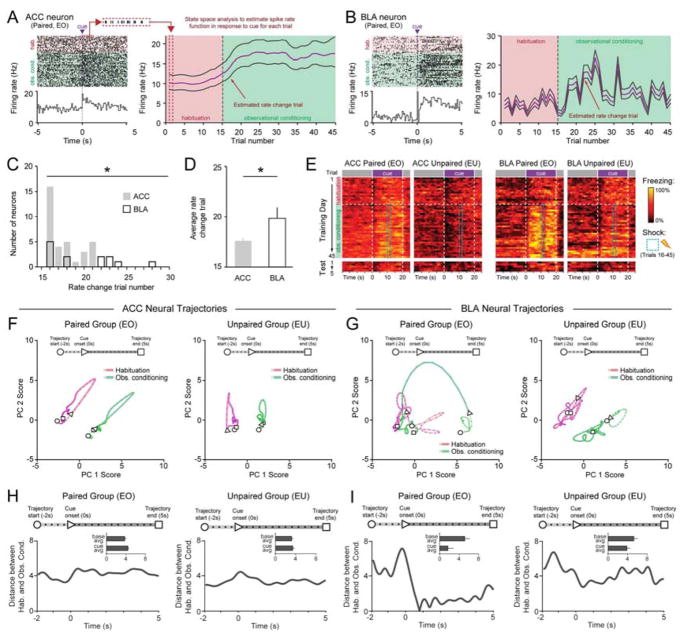
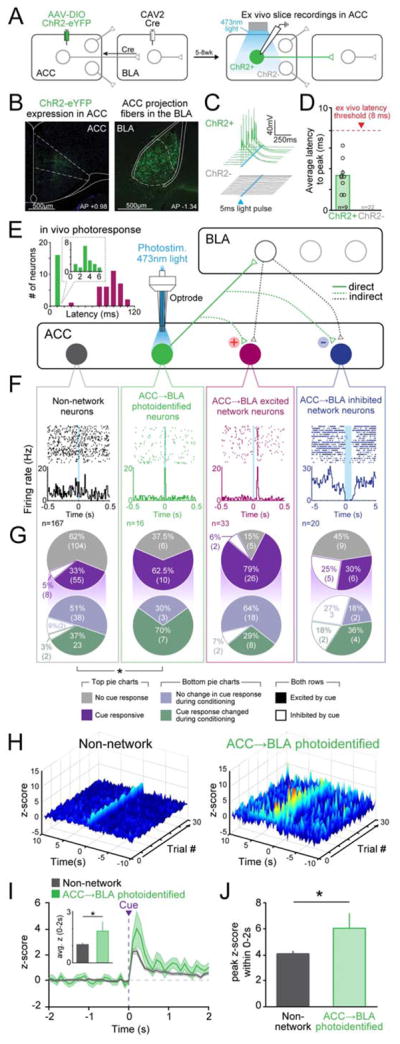
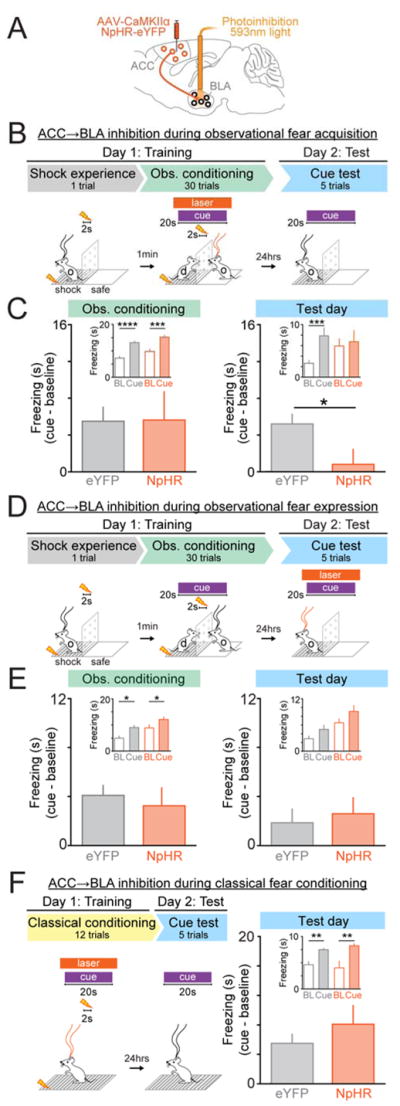
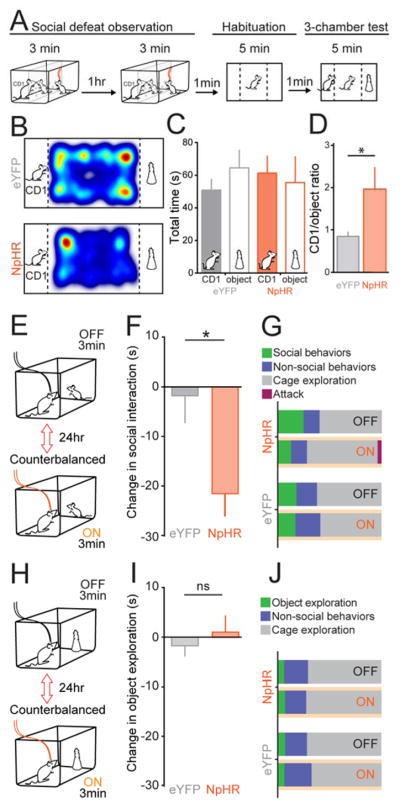
Observational learning is a powerful survival tool allowing individuals to learn about threat-predictive stimuli without directly experiencing the pairing of the predictive cue and punishment. This ability has been linked to the anterior cingulate cortex (ACC) and the basolateral amygdala (BLA). To investigate how information is encoded and transmitted through this circuit, we performed electrophysiological recordings in mice observing a demonstrator mouse undergo associative fear conditioning and found that BLA-projecting ACC (ACC→BLA) neurons preferentially encode socially derived aversive cue information. Inhibition of ACC→BLA alters real-time amygdala representation of the aversive cue during observational conditioning. Selective inhibition of the ACC→BLA projection impaired acquisition, but not expression, of observational fear conditioning. We show that information derived from observation about the aversive value of the cue is transmitted from the ACC to the BLA and that this routing of information is critically instructive for observational fear conditioning. VIDEO ABSTRACT.

Keywords: ChR2; NpHR; amygdala; anterior cingulate cortex; electrophysiology; fear; optogenetics; phototagging; social behavior; state-space.


Conflict of interest statement

Declaration of Interests

The authors declare no competing interests.

Figures

Figure 1
Figure 1. Parameters for mice to learn about a predictive cue via observational conditioning
A. Observational fear conditioning paradigm. B. Conditioning paradigms for all behavioral groups (EO, N=7; EU, N=5; ES, N=6; NO, N=7; NS, N=4 mice). C. EO and NO mice showed significantly higher freezing (cue-baseline) than EU, ES, and NS mice (one-way ANOVA, F(4,24)=13.66, P< 0.0001, Bonferroni post-hoc analysis, *P<0.05, **P<0.01,***P<0.001, ****<0.0001). D. On Day 2: Test, EO mice showed significantly higher freezing (cue-baseline) than EU and ES mice (one-way ANOVA, F(4,24)=5.687, P=0.0023, Bonferroni post-hoc analysis, **P<0.01, *P<0.05). E. Modified observational conditioning paradigm to test for context independent cue learning in EO mice. F. EO mice showed significantly higher freezing during cue presentation in a novel context (two-tailed, unpaired student’s t-test, t=4.535, df=10, **P=0.0011). G. Testing for affiliative interactions between demonstrator and observer mice before and after observational conditioning. H. Time interacting with the demonstrator after observational conditioning was statistically higher for EO mice (one-way ANOVA, F(2,16)=3.779, P=0.0453, Bonferroni post-hoc analysis, *P=0.0427), and showed a trend for NO mice (P=0.0859) when compared to ES mice. All error bars indicate ± SEM.
Figure 2
Figure 2. Encoding of observational conditioning in the ACC and BLA
A. Observational fear conditioning paradigm used for in vivo single-unit recordings in the ACC (paired group, N=16; unpaired group, N=7 mice) or BLA (paired group, N=6; unpaired group, N=6 mice). B–C. Representative ACC and BLA neuron responses to cue and shock delivery during paired observational conditioning. Raster plots depict neural spikes (1 trial per row) and each peri-stimulus time histogram (PSTH) depicts the average firing frequency across all trials, relative to cue onset (100 ms bins). Insets show the average waveform recorded for each neuron (y-axis: 200 uV, x-axis: 1 ms). D–E. Cue responses for paired and unpaired groups. Heatmap rows represent the z-score transformed average PSTH for individual neurons, columns represent time bins relative to cue onset (100 ms width). Blue and red bars indicate statistically significant cue-responsive cells. Plots to the right show average z-score responses for cue-excited and cue-inhibited cells. F. Cue-responsive ACC subpopulations. Task-modulated neurons in the paired group showed a greater proportion of potentiated responses during conditioning than the unpaired group (bar graph inset; chi-square test: χ2=6.93, **P=0.008). On the right, each PSTH shows example ACC neurons with training-induced potentiated or reduced cue responses. G. Cue-responsive BLA subpopulations. A significantly greater proportion of cue-responsive neurons showed task-modulated responses in the paired group than the unpaired group (bar graph inset; chi-square test: χ2=8.27, **P=0.004).
Figure 3
Figure 3. ACC and BLA contain neural correlates of observational learning
A–B. Raster and PSTH (100ms bins) of an ACC (A) and BLA (B) neuron identified as having a significant change in cue response during conditioning. State-space analysis provides a probabilistic estimate of the trial at which the neuron undergoes a rate change. C. The distribution of rate change trials calculated by state-space analysis of conditioning-dependent neurons was significantly earlier in ACC than BLA neurons (Kolmogorov-Smirnov test, *P <0.05). D. The average rate change trial of neurons in the ACC was earlier than those in the BLA (two-tailed, unpaired student’s t-test, t=2.622, df=45, *P=0.0119). E. Behavioral rasters (1s bins) of average freezing for all paired (EO) and unpaired (EU) mice across Day 1:Training and Day 2:Test in both ACC and BLA groups. F–G. Neural ensemble dynamics in ACC and BLA across habituation and conditioning trials. Trial-averaged neural trajectories projected on a 2D space formed by first (PC1) and second (PC2) principle components for ACC neurons (F) (paired, n=201 neurons, N=12 mice; unpaired n=93 neurons, N=7 mice) and BLA neurons (paired, n=106, N=6 mice; unpaired n=97 neurons, N=6 mice). Dots on the trajectories represent timestamps (50 ms). H–I. Calculated Euclidean distance between trajectory for habituation and trajectory for observational conditioning in paired and unpaired mice in the ACC (H) and BLA (I) plotted as distance across time (−2s to +5s from CS onset). Insets show averaged values for baseline and cue period. The distance between baseline and cue epochs in the BLA paired group was significantly different from other groups (Pearson’s chi-square test: χ2=4.953, *P=0.026).
Figure 4
Figure 4. Photoidentified ACC→BLA projectors have an enhanced cue representation when compared to non-network ACC neurons
A. Schematic of intersectional viral approach. Retrograde virus CAV2-Cre was stereotaxically injected into the BLA and AAV-DIO-ChR2-eYFP into the ACC, resulting in ChR2 expression only in ACC neurons that monosynaptically project to the BLA. B. Representative confocal images of ChR2 expression in the ACC and projection fibers in the BLA (blue=DAPI, green=eYFP). C–D. Ex vivo electrophysiological recordings of ACC neurons in ex vivo in slices. (C) Voltage traces in response to light stimulation from ChR2+ (green) and ChR2- (grey) cells. (D) Average latency responses for all cells. E. An optrode was placed into the ACC of mice (N=16) expressing ChR2 in ACC neurons projecting to the BLA. In vivo recordings during observational conditioning and subsequent phototagging were performed. Circuit model shows proposed ACC→BLA network connectivity of ACC neurons based on in vivo phototagging. Inset shows the range of photoresponse latencies seen during in vivo recordings (green bar = projectors (<8 ms), magenta bars = excited network neurons (20–120 ms)). F. Example rasters and PSTH of non-network (10ms bins), ACC→BLA photoidentified (10ms bins), and ACC→BLA excited (10ms bins) or inhibited network neurons (100ms bins). G. Proportions of non-network, ACC→BLA photoidentified, and ACC→BLA excited or inhibited network neurons that showed responses to the cue during observational conditioning. The ACC→BLA projector population exhibited a significantly greater proportion of cue-responsive neurons with 62.5% (n=10/16 neurons; N=16 mice) being excited and 0% (n=0/16) inhibited in response to the cue (Chi-square, χ2=4.85, df=1 *P=0.0276). In the ACC→BLA excited network, 79% (n=26/33) were excited and 6% (n=2/33) were inhibited to the cue. H. Three-dimensional heat map (100ms bins) displaying the trial by trial z-score response of the ACC→BLA photo-identified and non-network neurons to the cue during observational conditioning. I. Average z-score trace of cue responses in non-network (grey) or ACC→BLA phototagged (green) neurons. Inset: ACC→BLA projectors show a significantly greater average peak z-score response to the cue during conditioning compared (two-tailed, unpaired student’s t-test, t=2.122, df=181, *P=0.0352). J. ACC→BLA projectors had a higher peak z-score response to the cue during observational conditioning when compared to non-network neurons (two-tailed, unpaired student’s t-test, t=2.413, df=181, *P=0.0168). All error bars indicate ± SEM.
Figure 5
Figure 5. ACC input to the BLA governs cue-encoding during observational conditioning
A. Viral injection and optrode placement for selective inhibition of ACC→BLA input during individual trials of observational conditioning. B. Behavioral paradigm during in vivo optrode recordings. C. Rasters and PSTH (100ms bins) of example BLA neuron responses to the cue with and without optogenetic inhibition of ACC input to the BLA as well as inhibition during baseline. D. Response tree of all BLA neurons (n=98; N=5 mice) with % of BLA neurons that were cue-responsive and whether ACC inhibition altered cue response. Cue responsive neurons showed greater modulation by ACC input inhibition than the non-responsive population (Chi-square test, excited: χ2=18.60, df=1, ***P<0.0001; inhibited: χ2=13.87, df=1, ***P=0.0002). E. Average z-score trace of BLA neurons (n=27) that were excited in response to the cue with (orange) and without (purple) laser stimulation. Neurons excited by the cue showed a significantly reduced z-score response during laser stimulation. Inset shows average peak z-scores for the first 2s after the cue (N=5 mice, paired, two-tailed t-test, t=4.586, df=26, ***P=0.0001). F. Average z-score trace of BLA neurons (n=16) that were inhibited in response to the cue was plotted with (orange) and without (purple) laser stimulation. Inset shows average peak z-scores for the first 2s after the cue (N=5 mice, paired, two-tailed t-test, t=3.01, df=15, ***P=0.0088). G. A significantly smaller proportion of cells were cue responsive on trials where ACC input to the BLA was inhibited (Chi-square test, χ2=4.969, df=1, *P=0.0258). H. Significantly more cells had firing rates that were modulated by light stimulation during cue presentation compared to baseline (Chi-square test, χ2=12.10, df=1, ***P=0.0005). All error bars indicate ± SEM.
Figure 6
Figure 6. Photoinhibition of ACC→BLA impairs observational fear conditioning, but not classical fear conditioning
A. Viral injection and optic fiber placement for selective inhibition of ACC→BLA circuit. B. Behavioral and light delivery paradigm for inhibition of ACC→BLA circuit during cue presentations during acquisition (Day 1) of observational conditioning. C. During observational conditioning, there were no significant differences in freezing between NpHR (N=7) mice and eYFP (N=12) mice (unpaired, two-tailed t-test, t=0.0785, df=17, P =0.9383). However, on Test day, cue driven freezing was impaired in NpHR compared to eYFP mice (unpaired, two-tailed, t-test, t=2.378, df=17, *P =0.0294). Insets show cue and baseline (20s prior to cue onset) freezing values for observational conditioning and test day (BL=baseline; Observational conditioning: two-way ANOVA, group effect, F(1,17)=8.286, P=0.0104, epoch effect, F(1,17)=66.26, P<0.0001, group X epoch interaction, F(1,17)= 0.0829, P0.7769; Bonferroni post-hoc analysis, ****P< 0.0001, ***P=0.0002; Test day: two-way ANOVA, group effect, F(1,17)= 0.3596, P=0.5566, epoch effect, F(1,17)=10.64, P=0.0046, group X epoch interaction, F(1,17)=5.657, P=0.0294; Bonferroni post-hoc analysis, ***P=0.0005). D. Behavioral and light delivery paradigm for inhibition of ACC→BLA circuit during cue presentations during expression (Day 2) of observational conditioning. E. There were no significant differences in cue driven freezing between NpHR (N=9) and eYFP (N=8) mice during observational conditioning (unpaired, two-tailed, t-test, t=0.4916, df=15, *P =0.6301) or Day2: Test (unpaired, two-tailed, t-test, t=0.5137, df=15, *P =0.6149). Insets show cue and baseline (20s prior to cue) freezing values during conditioning and test day (Observational conditioning: two-way ANOVA, group effect, F(1,15)=10.46, P=0.0056, epoch effect, F(1,15)=18.17, P=0.0007, group X epoch interaction, F(1,15)=0.2416, P=0.6301; Bonferroni post-hoc analysis, *P<0.05; Test day: two-way ANOVA, group effect, F(1,15)= 12.30, P=0.0032, epoch effect, F(1,15)=6.778, P =0.02, group X epoch interaction, F(1,15)=0.06837, P=0.7973; no significant Bonferroni post-hoc analysis). F. Inhibition of ACC→BLA circuit during classical fear conditioning. No significant differences were detected between NpHR (N=7 mice) and eYFP (N=10) mice in cue driven freezing on test day (unpaired, two-tailed, t-test, t=1.02, df=15, *P=0.3237). Inset shows cue and baseline (20s prior to cue) freezing values (two-way ANOVA, group effect, F(1,15)=0.0061, P =0.9389, epoch effect, F(1,15)= 28.48, P<0.0001, group X epoch interaction, F(1,15)=1.041, P=0.3237; Bonferroni post-hoc analysis, **P<0.01). All error bars indicate ± SEM.
Figure 7
Figure 7. Photoinhibition of ACC→BLA also impairs other ethologically-relevant social behaviors
A. Social defeat observation paradigm. NpHR (N=9) and eYFP (N=9) mice naïve to a CD-1 mouse received 593 nm to inhibit the ACC→BLA circuit during two social defeat observation sessions (3 min each). Mice were then placed in a 3-chamber arena for habituation followed by conditioned avoidance. B. Representative heat maps of time spent by NpHR and eYFP mice in the arena during the 3-chamber test. C. Average of total time spent within the CD-1 or the object zone for NpHR and eYFP mice during the 3-chamber test. D. NpHR mice had a higher ratio of time spent with the CD-1 instead of the object than eYFP mice (unpaired, Two-tailed t-test, t=2.147, df=16, *P=0.0475). E. Resident-intruder paradigm. A juvenile intruder was introduced to the homecage of a resident NpHR (N=7) or eYFP (N=11) mouse during light on and light off conditions separated by 24 hours and counterbalanced between mice. F. Inhibition of ACC input to the BLA in the resident-intruder paradigm decreased social interaction time in NpHR compared to eYFP mice (unpaired, two-tailed t-test, t=2.609, df=16 *P=0.019). G. Summary of light-evoked changes in behavior during resident-intruder paradigm (Non-social behaviors = grooming and rearing). NpHR mice showed a decrease in social behaviors during ACC→BLA inhibition that was not evident in the eYFP group. H. A novel object is introduced into the homecage of a resident NpHR or eYFP mouse during light on and light off conditions separated by 24 hours and counterbalanced between mice. I. Novel object exploration was not altered by light-evoked inhibition of ACC input to the BLA (unpaired, two-tailed t-test, t=0.6952, df=15, P=0.4975). J. Summary of light-evoked changes in behavior during novel object paradigm. NpHR and eYFP mice showed no change in object exploration during ACC-BLA inhibition. All error bars indicate ± SEM.

Comment in

  • Watch and learn.
    Bray N. Bray N. Nat Rev Neurosci. 2018 Jul;19(7):388-389. doi: 10.1038/s41583-018-0024-1. Nat Rev Neurosci. 2018. PMID: 29789694 No abstract available.
  • Shining Light on Social Learning Circuits.
    Chang SWC, Dal Monte O. Chang SWC, et al. Trends Cogn Sci. 2018 Aug;22(8):673-675. doi: 10.1016/j.tics.2018.05.002. Epub 2018 May 28. Trends Cogn Sci. 2018. PMID: 29853254

References

    1. Adolphs R, Tranel D, Damasio H, Damasio A. Impaired recognition of emotion in facial expressions following bilateral damage to the human amygdala. Nature. 1994;372:669–672. - PubMed
    1. Allman JM, Hakeem A, Erwin JM, Nimchinsky E, Hof P. The Anterior Cingulate Cortex. Ann N Y Acad Sci. 2001;935:107–117. - PubMed
    1. Ames KC, Ryu SI, Shenoy KV. Neural Dynamics of Reaching Following Incorrect or Absent Motor Preparation. Neuron. 2014;81:438–451. - PMC - PubMed
    1. Apps MAJ, Rushworth MFS, Chang SWC. The Anterior Cingulate Gyrus and Social Cognition: Tracking the Motivation of Others. Neuron. 2016;90:692–707. - PMC - PubMed
    1. Atsak P, Orre M, Bakker P, Cerliani L, Roozendaal B, Gazzola V, Moita M, Keysers C. Experience Modulates Vicarious Freezing in Rats: A Model for Empathy. PLoS ONE. 2011;6:e21855. - PMC - PubMed

Publication types