. 2018 Jun 4;45(5):606-620.e3.
doi: 10.1016/j.devcel.2018.04.003. Epub 2018 May 3.

Cell Identity Switching Regulated by Retinoic Acid Signaling Maintains Homogeneous Segments in the Hindbrain

Affiliations

Cell Identity Switching Regulated by Retinoic Acid Signaling Maintains Homogeneous Segments in the Hindbrain

Megan Addison et al. Dev Cell. .

Abstract

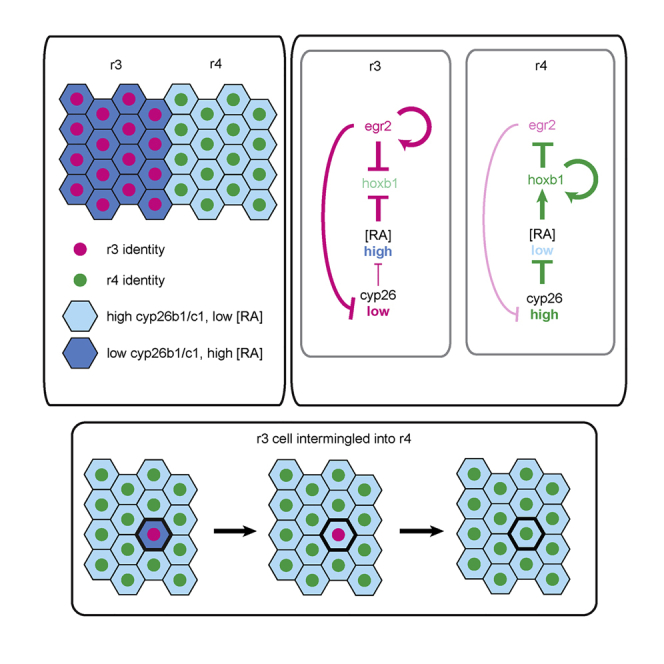
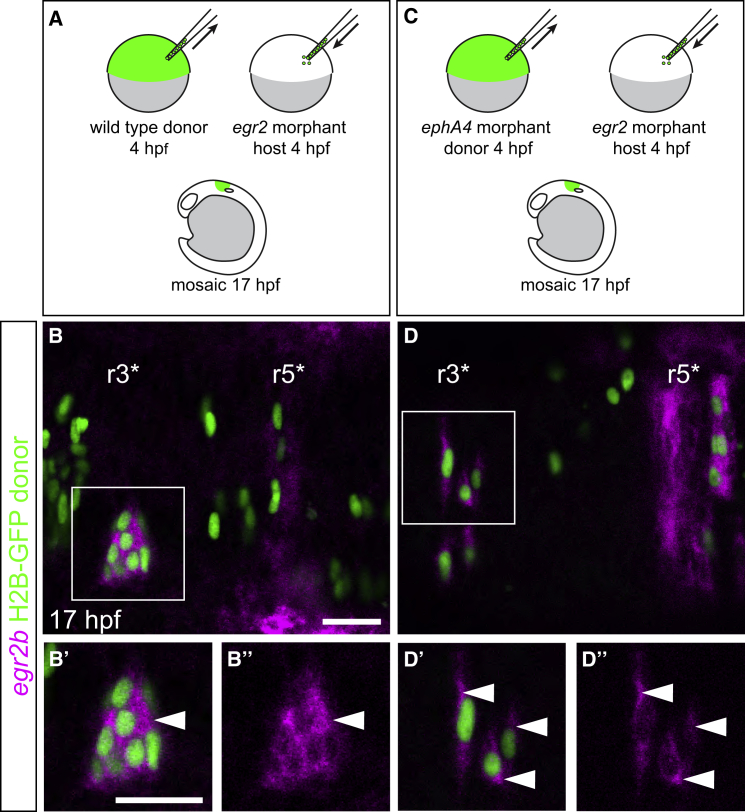
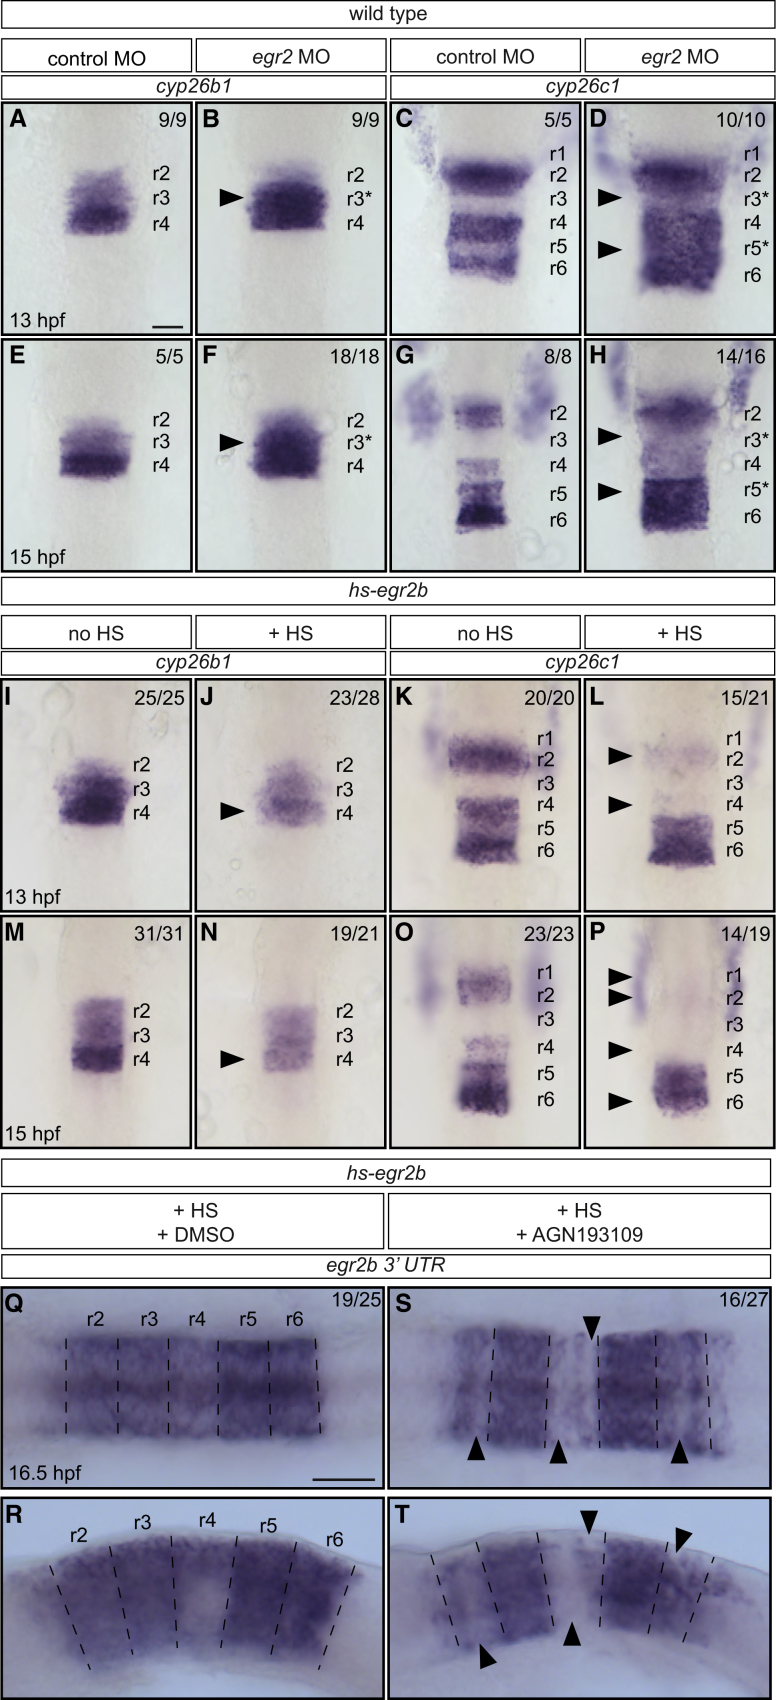
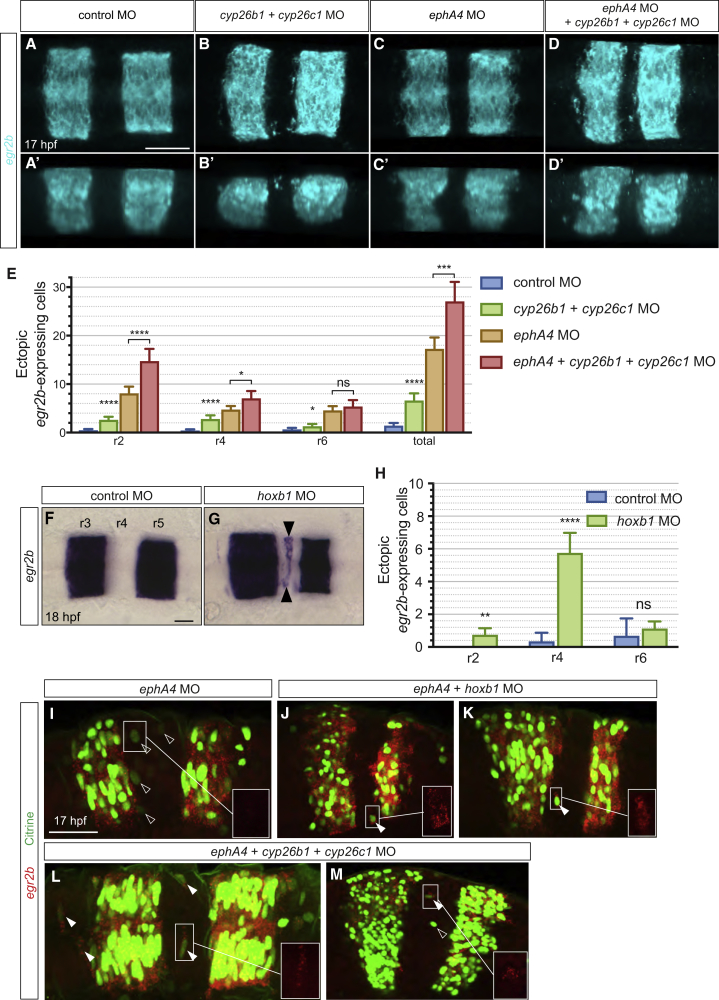
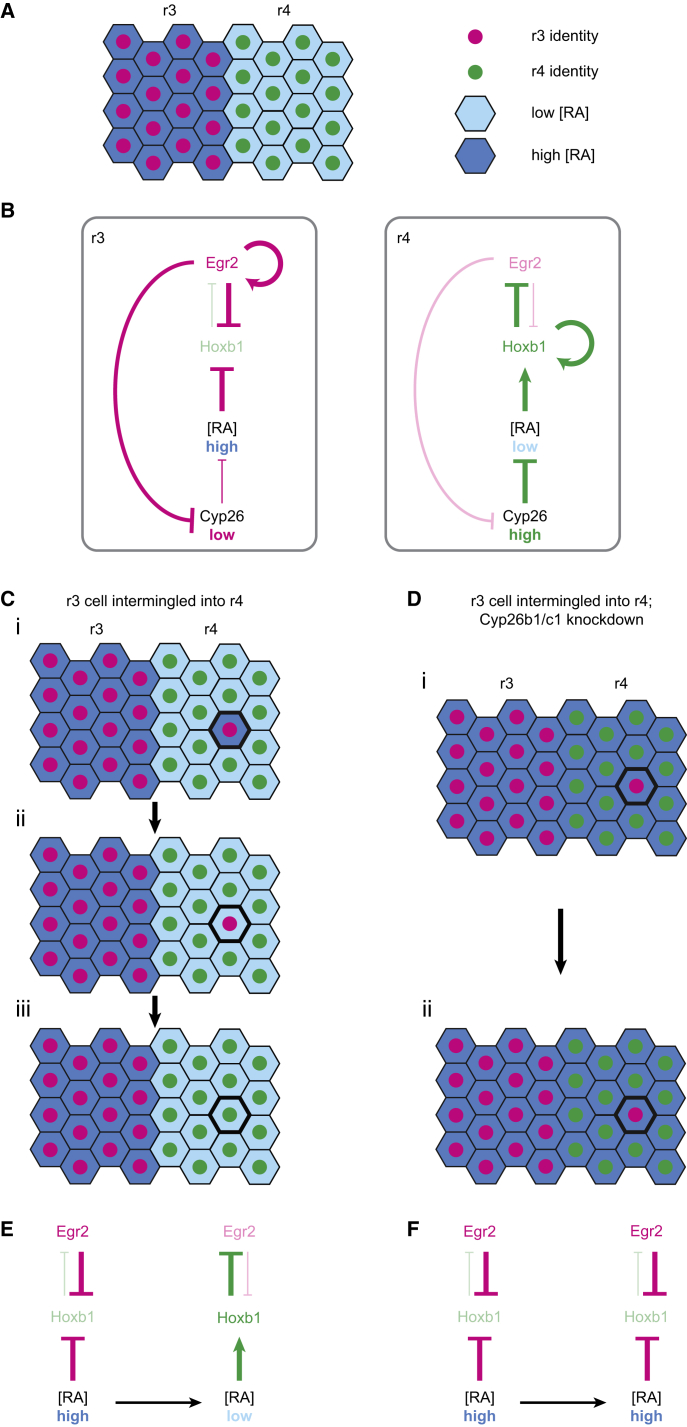
The patterning of tissues to form subdivisions with distinct and homogeneous regional identity is potentially disrupted by cell intermingling. Transplantation studies suggest that homogeneous segmental identity in the hindbrain is maintained by identity switching of cells that intermingle into another segment. We show that switching occurs during normal development and is mediated by feedback between segment identity and the retinoic acid degrading enzymes, cyp26b1 and cyp26c1. egr2, which specifies the segmental identity of rhombomeres r3 and r5, underlies the lower expression level of cyp26b1 and cyp26c1 in r3 and r5 compared with r2, r4, and r6. Consequently, r3 or r5 cells that intermingle into adjacent segments encounter cells with higher cyp26b1/c1 expression, which we find is required for downregulation of egr2b expression. Furthermore, egr2b expression is regulated in r2, r4, and r6 by non-autonomous mechanisms that depend upon the number of neighbors that express egr2b. These findings reveal that a community regulation of retinoid signaling maintains homogeneous segmental identity.

Keywords: boundary formation; cell identity switching; cell intermingling; cell segregation; community effect; cyp26; egr2; hindbrain segmentation; regional identity; retinoic acid.


Figures

None
Graphical abstract
Figure 1
Figure 1
Generation of egr2b Gene Trap Expressing H2B-Citrine (A) CRISPR-mediated insertion of a donor construct with cFos minimal promoter and H2B-Citrine upstream of the transcriptional start site of egr2b to generate the Tg[egr2b:H2B-Citrine] line. (B–O) In situ hybridization to detect egr2b (B–H) and citrine (I–O) transcripts in Tg[egr2b:H2B-Citrine] embryos from 10 to 15 hpf. Embryos are flat-mounted with anterior to the left. (P–S) Selected frames from a time-lapse movie of a Tg[egr2b:H2B-Citrine] embryo acquired from 12 hpf (t = 0 min) for 280 min. A higher resolution image was captured at the final time point (S). Below each panel is a magnified view of the indicated areas (i, ii), with arrowheads pointing at three examples of H2B-Citrine-expressing cells that are ectopic at the final time point. When first detected, these cells are already surrounded by non-expressing cells. Most of the H2B-Citrine-expressing cells seen posterior to r5 are egr2-expressing neural crest cells. Scale bars: 50 μm.
Figure 2
Figure 2
Cell Identity Switching of Ectopic egr2:H2B-Citrine-Expressing Cells (A and B) Maximum intensity projections of typical uninjected (A) and ephA4 morphant (B) Tg[egr2b:H2B-Citrine] embryos at 17 hpf, with H2B-Citrine protein detected using anti-GFP antibody. Lateral views of the same embryos are shown in (A′) and (B′). Examples of Citrine-positive cells outside r3 and r5 are indicated by arrowheads. (C) Quantification of isolated ectopic Citrine-positive cells in uninjected and ephA4 morphant embryos. Mean numbers with 95% confidence intervals are shown. Asterisks indicate statistical significance determined by Welsh's t test: r2, p = 0.0014; r4, p = 0.0017; r6, p = 0.0016; total isolated ectopic cells in r2, r4, and r6, p = 0.0002. n = 18 embryos (uninjected), n = 11 embryos (ephA4 morphants). (D) Double in situ hybridization reveals that isolated Citrine-expressing cells (green in D‴, arrowheads in D, D″) in r2, r4, and r6 of ephA4 morphant Tg[egr2b:H2B-Citrine] embryos have downregulated egr2b transcripts (blue in D, grayscale in D′; 105/121 cells). Citrine-expressing cells located in r4 have upregulated hoxb1a (magenta in D, scale in D″). Single slices from a confocal z stack are shown. Scale bars: 50 μm.
Figure 3
Figure 3
Relationship between Cell Organization and Non-autonomous Induction of egr2 Gene Expression (A–C) Embryos injected with CNE1:egr2b-Myc and fixed at various time points to detect endogenous egr2b transcripts. At 12 hpf (A), endogenous egr2b gene expression (magenta) is upregulated in cells overexpressing Egr2b-Myc (green nuclei) and non-autonomous upregulation of egr2b is also observed in adjacent cells (hollow arrowheads, Ai and Aii). DAPI staining (grayscale) is shown in (Ai′) and (Aii′). By 17 hpf (B), Egr2b-Myc-expressing cells become segregated to the borders of r3 and r5, and non-autonomous upregulation of egr2b is no longer observed in adjacent cells (Bi and Bii, solid arrowheads). Knockdown of ephA4 (see also Figure S1) in embryos injected with CNE1:egr2b-Myc (C) causes cells overexpressing Egr2b-Myc to remain dispersed throughout the neuroepithelium at 17 hpf and non-autonomous upregulation of egr2b is now observed (Ci and Cii, hollow arrowheads). (D–H) Transient expression of egr2b by heat shock of Tg[hsp70:egr2b-Myc] embryos (hs-egr2b) at 11.3 hpf induces upregulation of endogenous egr2b in r2, r4, and r6 (E); compare with control embryo shown in (D). H2B-GFP labeled wild-type donor cells were transplanted into hs-egr2b embryos at 4 hpf, which were heat shocked at 11.3 hpf to induce widespread expression of egr2b (F). Wild-type donor cells in r2 upregulate endogenous egr2b non-autonomously when isolated or dispersed (G, H, hollow arrowheads) but not when clustered together, indicated by the region encircled by white dashed line in (H). White dashed lines in (E), (G), and (H) indicate presumptive rhombomere borders. Single slices from a confocal z stack are shown. Scale bars: 50 μm.
Figure 4
Figure 4
Effect of Decreasing the Number of egr2b-Expressing Cells (A and B) H2B-GFP-labeled wild-type donor cells were transplanted into egr2a plus egr2b morphant hosts (A). Since autoregulation is required to maintain egr2 expression (Figure S2), only the transplanted cells can express egr2 in r3 at this stage. Wild-type donor cells at the position of r3 (denoted r3) in egr2 morphants form a small cluster and maintain egr2b expression at 17 hpf (B, white arrowhead). (C and D) H2B-GFP-labeled ephA4 morphant donor cells were transplanted into egr2 morphant hosts (C). ephA4 morphant donor cells no longer cluster in r3 but still maintain egr2b expression (D, white arrowheads). Single slices from a confocal z stack are shown. Scale bars: 50 μm.
Figure 5
Figure 5
Relationships between egr2, cyp26b1, cyp26c1, and RA Signaling (A–H) Effect of egr2a plus egr2b knockdown (egr2 morpholino oligonucleotides [MO]) on cyp26b1 and cyp26c1 expression. egr2 knockdown increases the level of cyp26b1 expression in r3 (black arrowhead) at 13 hpf (B) and 15 hpf (F), and of cyp26c1 in r3 and r5 (black arrowheads) at 13 hpf (D) and 15 hpf (H) compared with control embryos (A, C, E and G). r3 and r5 in (B), (D), (F), and (H) refer to the region specified as r3 or r5 in the presence of egr2. (I–P) Expression of cyp26b1 and cyp26c1 in control embryos and after induction of widespread egr2 expression by heat shock of hs-egr2b embryos at 11.3 hpf. Widespread expression of egr2b leads to reduction of cyp26b1 expression in r4 (black arrowhead) at 13 hpf (J), and 15 hpf (N) compared with control embryos (I and M). Similarly, cyp26c1 expression is reduced in r2, r4, and, to a lesser extent, in r6 (black arrowheads) at 13 hpf (L) and 15 hpf (P) in comparison with control embryos (K and O). (Q–T) hs-egr2b embryos subjected to heat shock at 11.3 hpf in the presence (S and T) or absence (Q and R) of the pan-RAR antagonist AGN193109. Endogenous egr2b expression was analyzed at 16.5 hpf. In DMSO-treated control embryos, endogenous egr2b is expressed in r2, r4, and r6, but to a lesser extent in ventral r4 (Q and R). In AGN193109-treated embryos, expression of endogenous egr2b in r2, r4, and r6 is more heterogeneous and there are patches of cells that do not express endogenous egr2b (black arrowheads in S and T). Embryos in (A)–(P) are flat-mounted with anterior to the top; embryos in (Q) and (S) are flat-mounted with anterior to the left; embryos in (R) and (T) are side-mounted with anterior to the left. Dashed lines in (Q)–(T) indicate presumptive rhombomere borders. Scale bars: 50 μm.
Figure 6
Figure 6
cyp26b1, cyp26c1, and hoxb1 Knockdown Increases Ectopic egr2-Expressing Cells (A–D) egr2b expression in 17 hpf embryos in which cyp26b1 and cyp26c1 were knocked down, compared with control morphants. Dorsal (A–D) and lateral (A′–D′) maximum intensity projections are shown. Knockdown of cyp26b1 and cyp26c1 causes an increased number of egr2b-expressing cells in r2, r4 and r6 (B and B′) compared with control embryos (A and A′); see also Figure S3. Combined knockdown of cyp26b1, cyp26c1, and ephA4 increases the number of egr2b expressing cells in r2 and r4 (D and D′) compared with ephA4 morphant embryos (C and C′) and cyp26b1 plus cyp26c1 knockdown alone (B and B′). (E) Mean number of egr2b-expressing cells in even-numbered segments with 95% confidence intervals. Since blocking identity switching will favor segregation of cells that have initially intermingled, we counted egr2-expressing cells adjacent to r3 and r5 as well as isolated cells. Asterisks indicate statistical significance determined by Welsh's t test. For cyp26b1 and cyp26c1 morphants (n = 40) compared with control morphants (n = 22): r2, p < 0.0001; r4, p < 0.0001; r6, p = 0.038; all misplaced egr2b-expressing cells, p < 0.0001. For ephA4, cyp26b1, and cyp26c1 triple morphants (n = 21) compared with ephA4 morphants (n = 33): r2, p < 0.0001; r4, p = 0.01; r6, p = 0.31; total, p = 0.0001. (F–H) Knockdown of hoxb1a and hoxb1b (hoxb1 MO) increases the number of egr2b-expressing cells in r4 (black arrowheads) at 18 hpf (G) compared with control embryos (F). hoxb1 knockdown does not affect cyp26b1 or cyp26c1 expression (Figure S4). (H) Mean number of ectopic egr2b-expressing cells with 95% confidence intervals. Asterisks indicate statistical significance determined by Welsh's t test: r2, p = 0.001; r4, p < 0.0001; r6, p = 0.38. Control embryos, n = 6; hoxb1 morphants, n = 26. (I–M) Knockdowns in the egr2b:H2B-Citrine line followed by detection of Citrine protein with anti-GFP antibody (green) and egr2b transcripts (red). The box in the bottom right of each panel is a magnified view of the egr2b transcript signal in the indicated area. Following knockdown of ephA4 alone to increase cell intermingling, ectopic Citrine-expressing cells do not express detectable egr2b transcripts (I). egr2b transcripts are detected in ectopic Citrine-expressing cells when ephA4 knockdown is combined with hoxb1 (J and K) or cyp26b1 plus cyp26c1 knockdown (L and M). Empty arrowheads indicate Citrine-expressing cells lacking detectable egr2b transcripts, and filled arrowheads Citrine-expressing cells that express egr2b transcripts. Scale bars: 50 μm.
Figure 7
Figure 7
Model of cyp26b1, cyp26c1, and hoxb1 in Cell Identity Switching (A) Segmental regulation of low cyp26b1 and cyp26c1 expression in r3 (magenta) and high expression in r4 (green) maintains high [RA] in r3 and low [RA] in r4. (B) In r3, egr2 represses cyp26b1 and cyp26c1 expression, which in turn keeps RA levels high, repressing hoxb1 expression. Egr2 also directly autoregulates its own expression and represses hoxb1 expression. In r4, high cyp26b1 and cyp26c1 expression maintains a low level of RA, permitting expression of hoxb1. Hoxb1 autoregulates its own expression and represses expression of egr2. (C and E) When an r3 cell intermingles into r4, the surrounding cells have high cyp26b1 and cyp26c1 expression, which reduces the level of RA within the ectopic r3 cell. This promotes upregulation of hoxb1 in the ectopic r3 cell, which represses egr2 expression, causing the r3 cell to change identity to r4. (D and F) When an r3 cell intermingles into r4, but cyp26b1 and cyp26c1 are knocked down, the surrounding r4 cells no longer have high cyp26b1/c1 expression, so RA levels remain high in the ectopic r3 cell. Consequently, egr2 is not downregulated in the ectopic r3 cell (F).

Comment in

References

    1. Balciunas D., Wangensteen K.J., Wilber A., Bell J., Geurts A., Sivasubbu S., Wang X., Hackett P.B., Largaespada D.A., McIvor R.S. Harnessing a high cargo-capacity transposon for genetic applications in vertebrates. PLoS Genet. 2006;2:e169. - PMC - PubMed
    1. Berger J., Currie P.D. 503unc, a small and muscle-specific zebrafish promoter. Genesis. 2013;51:443–447. - PubMed
    1. Bolouri H., Davidson E.H. The gene regulatory network basis of the “community effect,” and analysis of a sea urchin embryo example. Dev. Biol. 2010;340:170–178. - PMC - PubMed
    1. Bouchoucha Y.X., Reingruber J., Labalette C., Wassef M.A., Thierion E., Desmarquet-Trin Dinh C., Holcman D., Gilardi-Hebenstreit P., Charnay P. Dissection of a Krox20 positive feedback loop driving cell fate choices in hindbrain patterning. Mol. Syst. Biol. 2013;9:690. - PMC - PubMed
    1. Brennand K., Huangfu D., Melton D. All beta cells contribute equally to islet growth and maintenance. PLoS Biol. 2007;5:e163. - PMC - PubMed

Publication types

MeSH terms