

Cholera epidemic in Yemen, 2016-18: an analysis of surveillance data
- PMID: 29731398
- PMCID: PMC5952990
- DOI: 10.1016/S2214-109X(18)30230-4
Cholera epidemic in Yemen, 2016-18: an analysis of surveillance data
Abstract
Background: In war-torn Yemen, reports of confirmed cholera started in late September, 2016. The disease continues to plague Yemen today in what has become the largest documented cholera epidemic of modern times. We aimed to describe the key epidemiological features of this epidemic, including the drivers of cholera transmission during the outbreak.
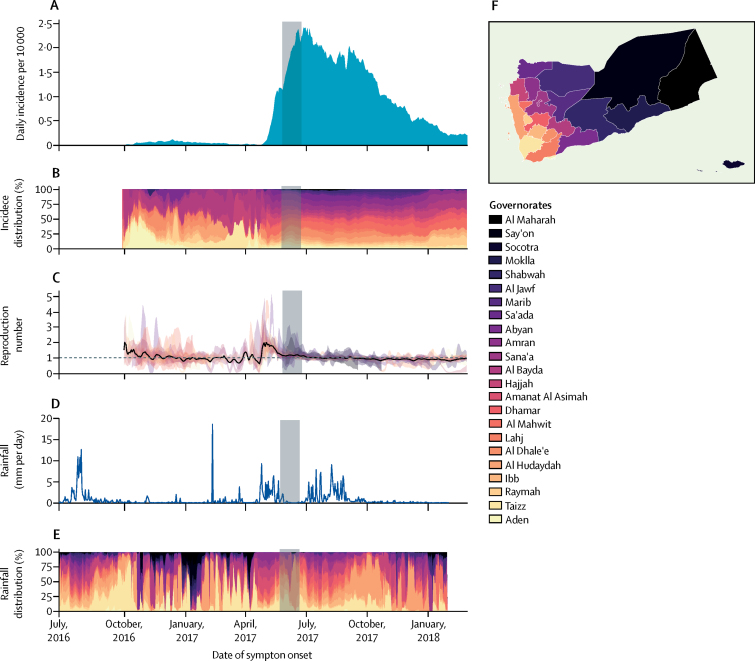
Methods: The Yemen Health Authorities set up a national cholera surveillance system to collect information on suspected cholera cases presenting at health facilities. Individual variables included symptom onset date, age, severity of dehydration, and rapid diagnostic test result. Suspected cholera cases were confirmed by culture, and a subset of samples had additional phenotypic and genotypic analysis. We first conducted descriptive analyses at national and governorate levels. We divided the epidemic into three time periods: the first wave (Sept 28, 2016, to April 23, 2017), the increasing phase of the second wave (April 24, 2017, to July 2, 2017), and the decreasing phase of the second wave (July 3, 2017, to March 12, 2018). We reconstructed the changes in cholera transmission over time by estimating the instantaneous reproduction number, Rt. Finally, we estimated the association between rainfall and the daily cholera incidence during the increasing phase of the second epidemic wave by fitting a spatiotemporal regression model.
Findings: From Sept 28, 2016, to March 12, 2018, 1 103 683 suspected cholera cases (attack rate 3·69%) and 2385 deaths (case fatality risk 0·22%) were reported countrywide. The epidemic consisted of two distinct waves with a surge in transmission in May, 2017, corresponding to a median Rt of more than 2 in 13 of 23 governorates. Microbiological analyses suggested that the same Vibrio cholerae O1 Ogawa strain circulated in both waves. We found a positive, non-linear, association between weekly rainfall and suspected cholera incidence in the following 10 days; the relative risk of cholera after a weekly rainfall of 25 mm was 1·42 (95% CI 1·31-1·55) compared with a week without rain.
Interpretation: Our analysis suggests that the small first cholera epidemic wave seeded cholera across Yemen during the dry season. When the rains returned in April, 2017, they triggered widespread cholera transmission that led to the large second wave. These results suggest that cholera could resurge during the ongoing 2018 rainy season if transmission remains active. Therefore, health authorities and partners should immediately enhance current control efforts to mitigate the risk of a new cholera epidemic wave in Yemen.
Funding: Health Authorities of Yemen, WHO, and Médecins Sans Frontières.
Copyright © 2018 The Author(s). Published by Elsevier Ltd. This is an Open Access article under the CC BY 4.0 license. Published by Elsevier Ltd.. All rights reserved.
Figures


Comment in
-
Untangling the causes of the 2016-18 Cholera epidemic in Yemen.Lancet Glob Health. 2018 Jun;6(6):e600-e601. doi: 10.1016/S2214-109X(18)30243-2. Epub 2018 May 3. Lancet Glob Health. 2018. PMID: 29731399 No abstract available.
-
Cholera epidemic in Yemen - Author's reply.Lancet Glob Health. 2018 Dec;6(12):e1284-e1285. doi: 10.1016/S2214-109X(18)30395-4. Epub 2018 Oct 10. Lancet Glob Health. 2018. PMID: 30316746 No abstract available.
-
Cholera epidemic in Yemen.Lancet Glob Health. 2018 Dec;6(12):e1283. doi: 10.1016/S2214-109X(18)30393-0. Epub 2018 Oct 10. Lancet Glob Health. 2018. PMID: 30316747 No abstract available.
References
-
- UN Office for the Coordination of Humanitarian Affairs Yemen Humanitarian Bulletin issue 30. Jan 28, 2018. https://reliefweb.int/report/yemen/yemen-humanitarian-bulletin-issue-30-...
-
- WHO Regional Office for the Eastern Mediterranean Health services decline as conflict in Yemen continues. Sept 28, 2016. http://www.emro.who.int/yem/yemen-news/health-services-decline-as-confli...
-
- UN Office for the Coordination of Humanitarian Affairs. UN Country Team in Yemen Humanitarian needs overview. Dec 4, 2017. https://reliefweb.int/sites/reliefweb.int/files/resources/yemen_humanita...
-
- Ward C. I B Tauris; London: 2014. The water crisis in Yemen: managing extreme water scarcity in the Middle East.
-
- Clemens JD, Nair GB, Ahmed T, Qadri F, Holmgren J. Cholera. Lancet. 2017;390:1539–1549. - PubMed
Publication types
MeSH terms
Grants and funding
LinkOut - more resources
Full Text Sources
Other Literature Sources
Medical
Miscellaneous
