. 2018 May 17;70(4):650-662.e8.
doi: 10.1016/j.molcel.2018.04.001. Epub 2018 May 3.

RNA Helicase DDX1 Converts RNA G-Quadruplex Structures into R-Loops to Promote IgH Class Switch Recombination

Affiliations

RNA Helicase DDX1 Converts RNA G-Quadruplex Structures into R-Loops to Promote IgH Class Switch Recombination

Claudia Ribeiro de Almeida et al. Mol Cell. .

Abstract

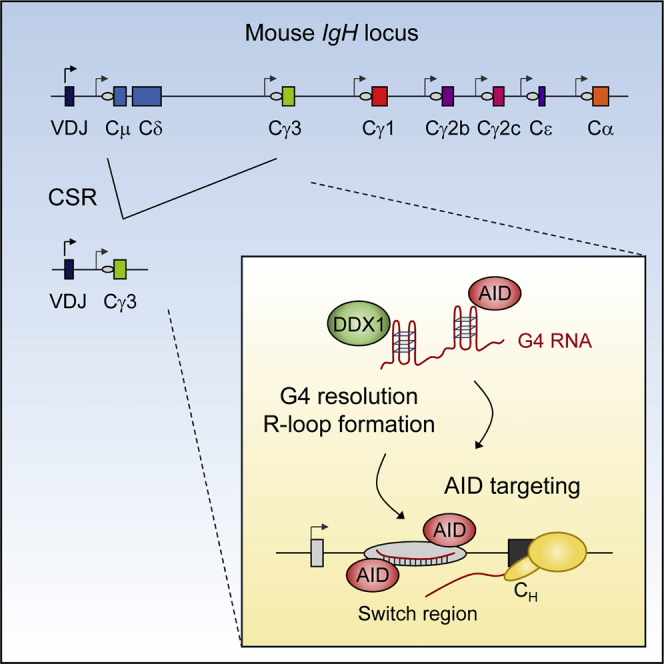
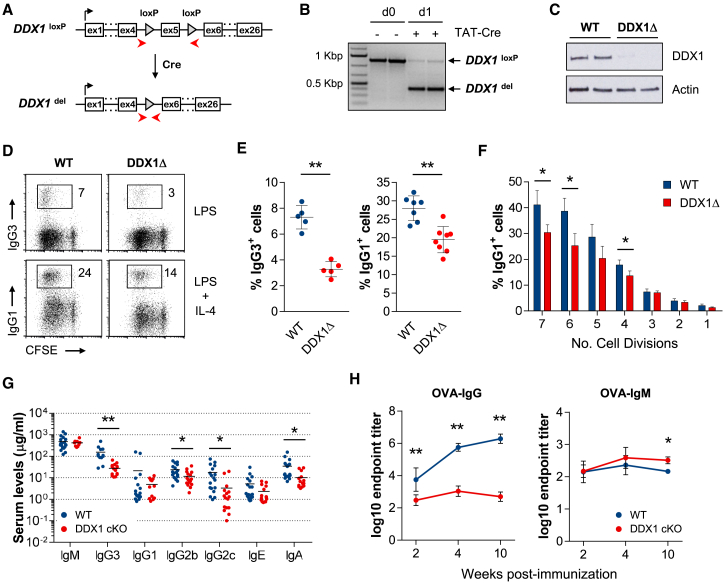
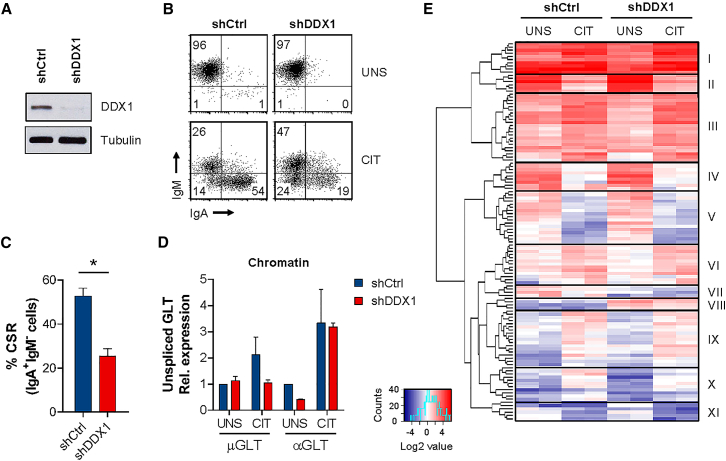
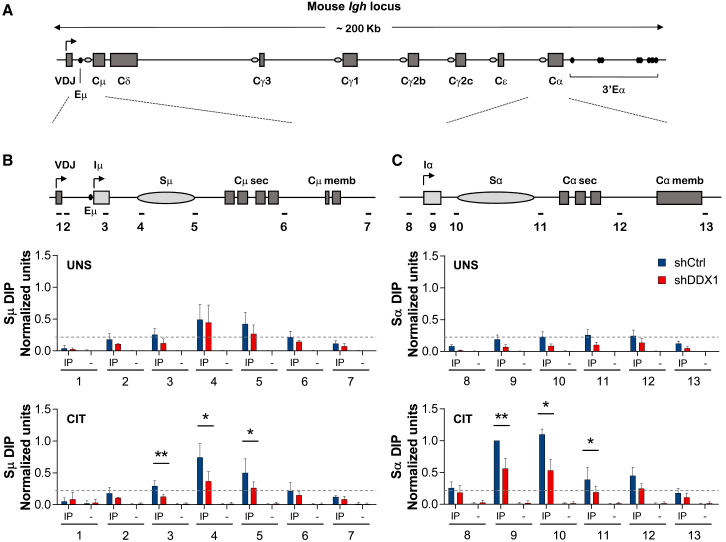
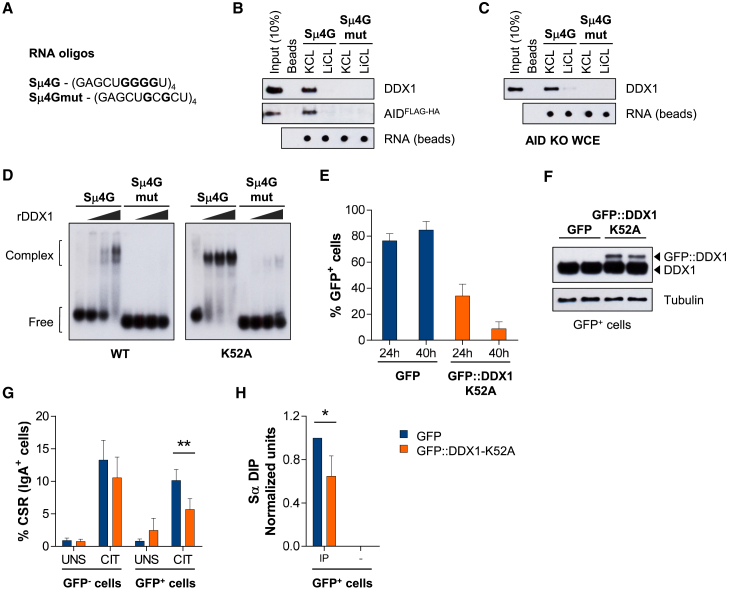
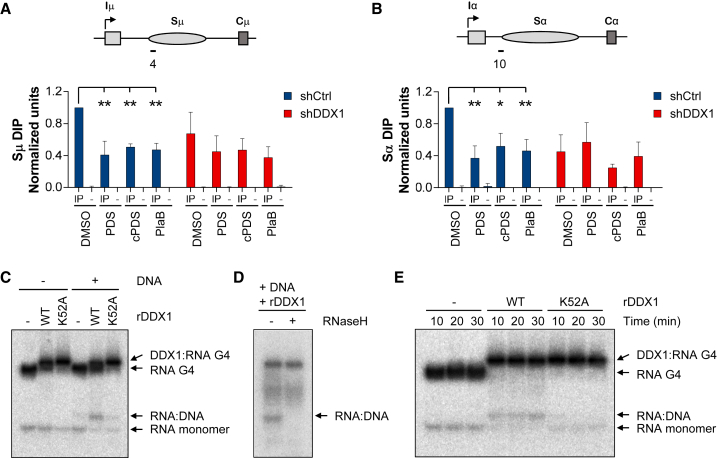
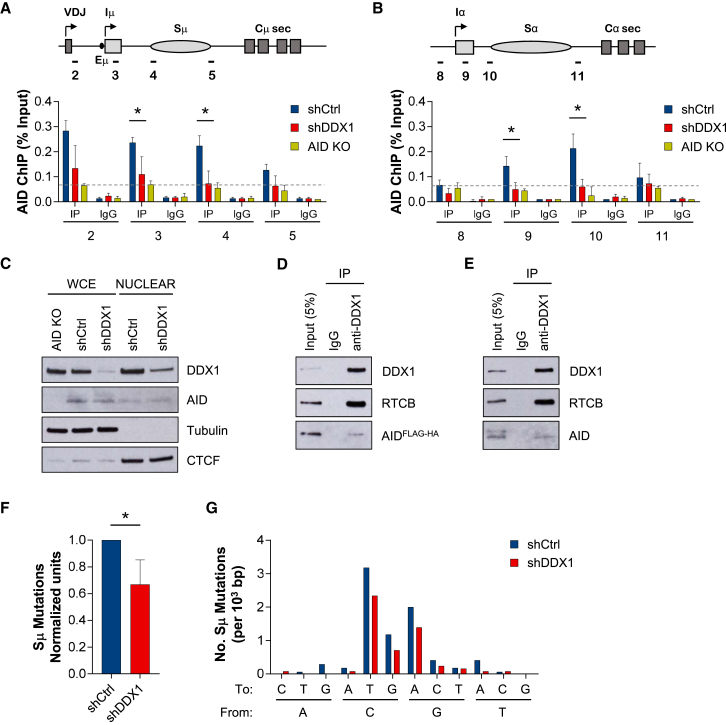
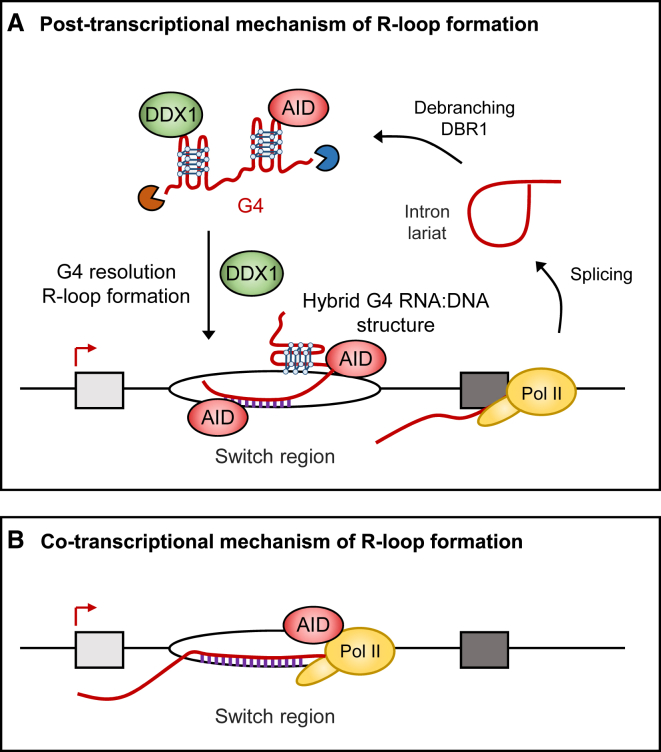
Class switch recombination (CSR) at the immunoglobulin heavy-chain (IgH) locus is associated with the formation of R-loop structures over switch (S) regions. While these often occur co-transcriptionally between nascent RNA and template DNA, we now show that they also form as part of a post-transcriptional mechanism targeting AID to IgH S-regions. This depends on the RNA helicase DDX1 that is also required for CSR in vivo. DDX1 binds to G-quadruplex (G4) structures present in intronic switch transcripts and converts them into S-region R-loops. This in turn targets the cytidine deaminase enzyme AID to S-regions so promoting CSR. Notably R-loop levels over S-regions are diminished by chemical stabilization of G4 RNA or by the expression of a DDX1 ATPase-deficient mutant that acts as a dominant-negative protein to reduce CSR efficiency. In effect, we provide evidence for how S-region transcripts interconvert between G4 and R-loop structures to promote CSR in the IgH locus.

Keywords: DEAD-box RNA helicase 1; G-quadruplexes; R-loops; activation-induced cytidine deaminase; class switch recombination.


Figures

None
Graphical abstract
Figure 1
Figure 1
Impaired CSR in DDX1 Knockout B Cells (A) Diagram of conditional DDX1 (DDX1loxP) and Cre-deleted DDX1 (DDX1del) alleles. PCR primers are indicated. (B) PCR analysis of genomic DNA from DDX1loxP/loxP splenic B cells treated with TAT-Cre (2 replicates). (C) Western blot of WT and DDX1-deleted (DDX1Δ) B cells (day 4, 2 replicates). (D) Flow cytometric analysis for surface IgG3 and IgG1 expression and CFSE in WT and DDX1Δ B cells stimulated for 4 days. (E) Quantification of CSR for cultures shown in (D). Each symbol represents B cell cultures from individual mice (n ≥ 3, mean ± SD). (F) Percentage of IgG1+ cells analyzed per number of cell divisions in CFSE-labeled LPS plus IL-4 cultures at day 4. One representative experiment with 3 mice per genotype (mean ± SD). (G) Serum Ig concentrations in naive WT and DDX1 cKO mice. Each symbol represents individual mice and horizontal lines indicate the mean. (H) Antigen-specific IgG and IgM immune responses in WT and DDX1 cKO mice immunized with ovalbumin (OVA) antigen. Serum was analyzed by ELISA and endpoint titers were determined (n = 2, mean ± SD; 3–7 mice in each time point except week 10 where 2–3 mice were analyzed). See also Figure S1.
Figure 2
Figure 2
Transcription Profiling in DDX1-Depleted CH12 Cells CH12 cells transduced with shCtrl or shDDX1 were analyzed after 72 hr in unstimulated (UNS) or CIT-stimulated conditions. (A) Western blot for DDX1 and Tubulin loading control. (B) Flow cytometric analysis for surface IgM and IgA expression. (C) Quantification of CSR for CIT cultures shown in (B) (average of 2 clones for each shRNA; n > 3, mean ± SD). (D) Quantitative PCR analysis of chRNA after 24 hr in UNS or CIT conditions. Unspliced μGLT and αGLT levels were normalized to unspliced β-actin transcript and shCtrl UNS (n = 2, mean ± SD). (E) Heatmap of 120 differentially expressed genes between shCtrl or shDDX1 CH12 cells in UNS or CIT conditions. Gene expression values (FPKM) are shown (fold change ≥2, false discovery rate [FDR] ≤0.05; n = 2). Hierarchical clustering identified 11 groups of genes (clusters I–XI) with similar patterns of expression change across the different samples analyzed. See also Figure S2.
Figure 3
Figure 3
Reduced R-Loop Levels over IgH S-Regions in DDX1-Depleted Cells (A) Diagram of the mouse IgH locus. Switch (S)-region core repeats (ovals) precede each set of constant region (CH) exons. (B and C) A conserved transcription unit comprising a non-coding intervening (I)-exon, an intronic S-region and a downstream set of CH exons is expanded for μ (B) and α (C) regions. CH12 cells transduced with shCtrl or shDDX1 were analyzed by DIP with the S9.6 RNA:DNA hybrid-specific antibody (IP) or no antibody control (–), after 24 hr in UNS- or CIT-stimulated conditions. Probes employed (1–13) are indicated. Values were normalized both to probe 2 in each sample and probe 9 in shCtrl CIT cells in each experiment (n = 5, mean ± SD). Dashed line represents background signal (DIP levels for probe 2 in shCtrl UNS cells). See also Figure S3.
Figure 4
Figure 4
DDX1 Binds to G4 Structures in Intronic Switch RNAs (A) RNA oligonucleotides consisting of 4 tandem Sμ repeats (Sμ4G) or a G-to-C mutant (Sμ4Gmut). (B and C) RNA pull-down assays with protein extracts from (B) AIDFLAG-HA or (C) AID KO CH12 cells, CIT stimulated for 48 hr. Western blots were analyzed for DDX1 and AID (FLAG tag) and RNA recovered from beads measured by dot blot. Representative results from at least 3 independent pull-downs. (D) Native electrophoretic mobility shift assays (EMSA) with 32P-labeled Sμ4G and Sμ4Gmut RNA oligonucleotides and rDDX1 (WT) or rDDX1-K52A (ATPase mutant) proteins (1, 2, or 4 μg). Representative results from at least 3 independent assays. (E–H) CH12 cells were transfected with a pcDNA3 vector expressing GFP or N-terminal GFP-tagged human DDX1-K52A cDNA (GFP::DDX1-K52A), and cultured in UNS or CIT-stimulated conditions. (E) Percentage of GFP+ cells 24 hr and 40 hr after transfection measured by flow cytometry (n = 4, mean ± SD). (F) Western blot of GFP+, fluorescence-activated cell sorted cells for DDX1 and Tubulin loading control (24 hr after transfection, 2 replicates). (G) Quantification of CSR in GFP and GFP+-gated cell populations (40 hr after transfection; n = 4, mean ± SD). (H) DIP analyses with S9.6 antibody (IP) or no antibody control (–), 24 hr after transfection in CIT-stimulated conditions using Sα region probe 9. Values were normalized to probe 2 in each sample and probe 9 in shCtrl CIT cells in each experiment (n = 3, mean ± SD). See also Figure S4.
Figure 5
Figure 5
DDX1 and G4 RNA-Dependent R-Loops in IgH S-Regions (A and B) CH12 cells transduced with shCtrl or shDDX1 were analyzed by DIP with S9.6 antibody (IP) or no antibody control (–). Cells were cultured in CIT-stimulated conditions with DMSO (Control), the G4 stabilizer pyridostatin (PDS, 10 μM), the G4 RNA-specific derivative carboxypyridostatin (cPDS, 10–40 μM) or the splicing inhibitor Pladienolide B (PlaB, 1 μM) for 4 hr. DIP signals shown for upstream Sμ region (probe 4) (A) and Sα region (probe 10) (B). Values were normalized to shCtrl DMSO (n ≥ 3, mean ± SD). (C–E) In vitro RNA:DNA hybrid assay using 32P-labeled tetramolecular G4 RNA and complementary DNA strands. Reactions were performed with 1 μg WT or an ATPase mutant (K52A) of rDDX1 at 25°C for 10 min (C and D) or 10, 20, and 30 min (E). (D) RNaseH treatment of RNA:DNA hybrids. Data shown in (C) and (D) are representative of at least 3 independent assays. See also Figure S5.
Figure 6
Figure 6
Reduced AID Binding to IgH S-Regions in DDX1-Depleted Cells CH12 cells transduced with shCtrl or shDDX1 were cultured in CIT-stimulated conditions and analyzed after 24 hr. (A and B) AID ChIP analysis in μ (A) and α (B) regions. Values shown for antibody (IP) or IgG control are expressed as percentage of Input (n = 3, mean ± SD). AID KO CH12 cells were used to determine background levels (dashed line represents probe 2 signal). (C) Western blot of whole-cell and nuclear protein extracts for DDX1 and AID. Purity of nuclear extracts is shown by absence of cytoplasmic Tubulin, and CTCF levels were used as loading control. Amount of nuclear extract loaded is 15 times increased compared to the equivalent amount of whole cell extracts (WCEs). Data are representative of 3 independent experiments. (D and E) Co-immunoprecipitation assays with anti-DDX1 antibody and nuclear protein extracts from (D) AIDFLAG-HA or (E) WT CH12 cells CIT stimulated for 24 hr. Western blots were analyzed for DDX1, AID (or FLAG tag), and the tRNA ligase subunit RTCB as a positive control. Representative results from 2 independent pull-downs on each cell type. (F) Frequency of Sμ mutations (shCtrl normalized; n = 4, mean ± SD). Number of mutations per total number of bp analyzed and percentage of mutation in recombined Sμ DNA sequences in each experiment are shown in Figure S7A. (G) Number of Sμ mutations at each nucleotide, expressed per 103 bp (n = 4). Unique Sμ-Sα sequences were amplified from genomic DNA extracted from shCtrl (50 sequences) or shDDX1 (62 sequences) CH12 cells cultured in CIT conditions for 72 hr. See also Figures S6 and S7.
Figure 7
Figure 7
Model for DDX1 Role in CSR (A) RNA polymerase II (Pol II) makes switch transcripts, which are spliced to release the G4 containing intron. Intron lariat intermediates are debranched by the DBR1 enzyme as previously shown (Zheng et al., 2015). This converts the intron lariat into its linear form prior to folding into G4 RNA structures. Presumably, switch transcripts are trimmed by 5′ and 3′ exonucleases. G4 RNA and AID are then targeted to the S-region DNA through the action of the RNA helicase DDX1 that promotes the formation of R-loops. Hypothetically, hybrid G4 RNA:DNA structures could also occur in the non-template DNA strand (Pucella and Chaudhuri, 2017). (B) R-loops form behind elongating Pol II in S-region and recruit AID to the single-strand DNA.

References

    1. Basu U., Meng F.L., Keim C., Grinstein V., Pefanis E., Eccleston J., Zhang T., Myers D., Wasserman C.R., Wesemann D.R. The RNA exosome targets the AID cytidine deaminase to both strands of transcribed duplex DNA substrates. Cell. 2011;144:353–363. - PMC - PubMed
    1. Bléoo S., Sun X., Hendzel M.J., Rowe J.M., Packer M., Godbout R. Association of human DEAD box protein DDX1 with a cleavage stimulation factor involved in 3′-end processing of pre-MRNA. Mol. Biol. Cell. 2001;12:3046–3059. - PMC - PubMed
    1. Boboila C., Alt F.W., Schwer B. Classical and alternative end-joining pathways for repair of lymphocyte-specific and general DNA double-strand breaks. Adv. Immunol. 2012;116:1–49. - PubMed
    1. Boguslawski S.J., Smith D.E., Michalak M.A., Mickelson K.E., Yehle C.O., Patterson W.L., Carrico R.J. Characterization of monoclonal antibody to DNA.RNA and its application to immunodetection of hybrids. J. Immunol. Methods. 1986;89:123–130. - PubMed
    1. Brazão T.F., Johnson J.S., Müller J., Heger A., Ponting C.P., Tybulewicz V.L. Long noncoding RNAs in B-cell development and activation. Blood. 2016;128:e10–e19. - PMC - PubMed

Publication types

MeSH terms

LinkOut - more resources