. 2018 Jun 5;10(6):1867-1878.
doi: 10.1016/j.stemcr.2018.04.005. Epub 2018 May 3.

Electrophysiologic Characterization of Calcium Handling in Human Induced Pluripotent Stem Cell-Derived Atrial Cardiomyocytes

Affiliations

Electrophysiologic Characterization of Calcium Handling in Human Induced Pluripotent Stem Cell-Derived Atrial Cardiomyocytes

Mariana Argenziano et al. Stem Cell Reports. .

Abstract

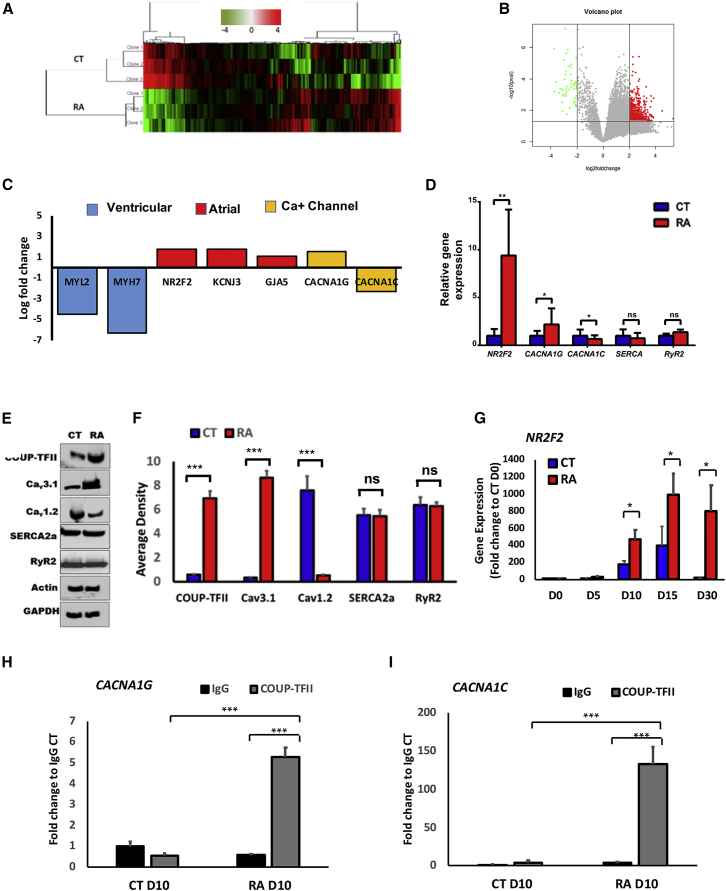
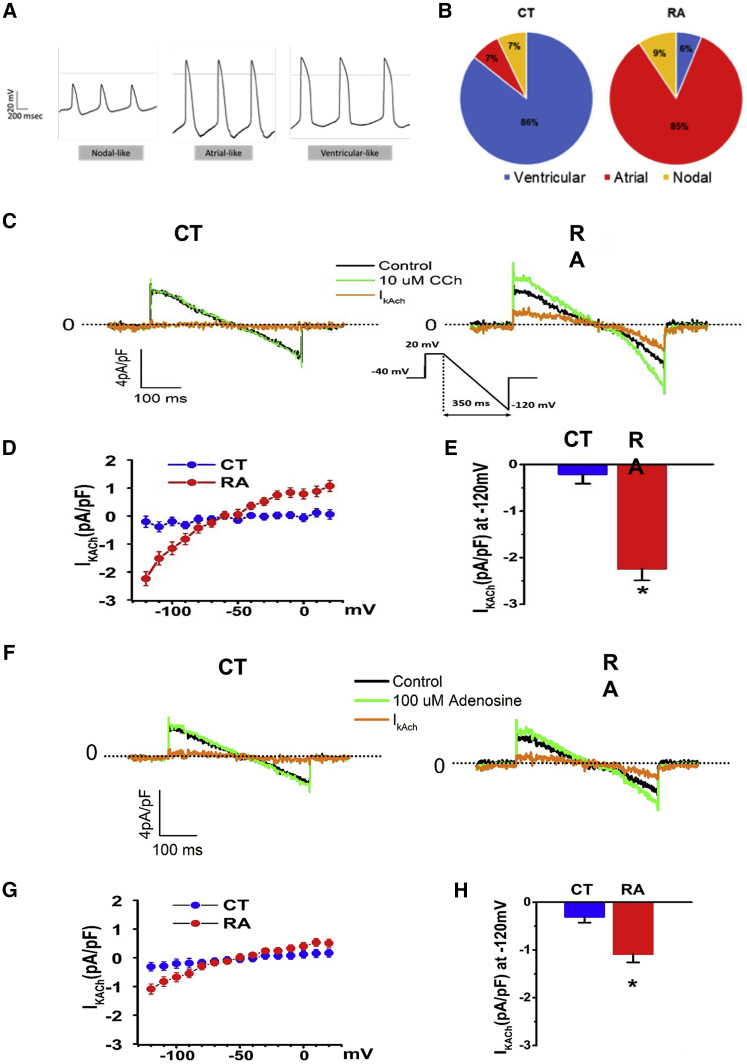
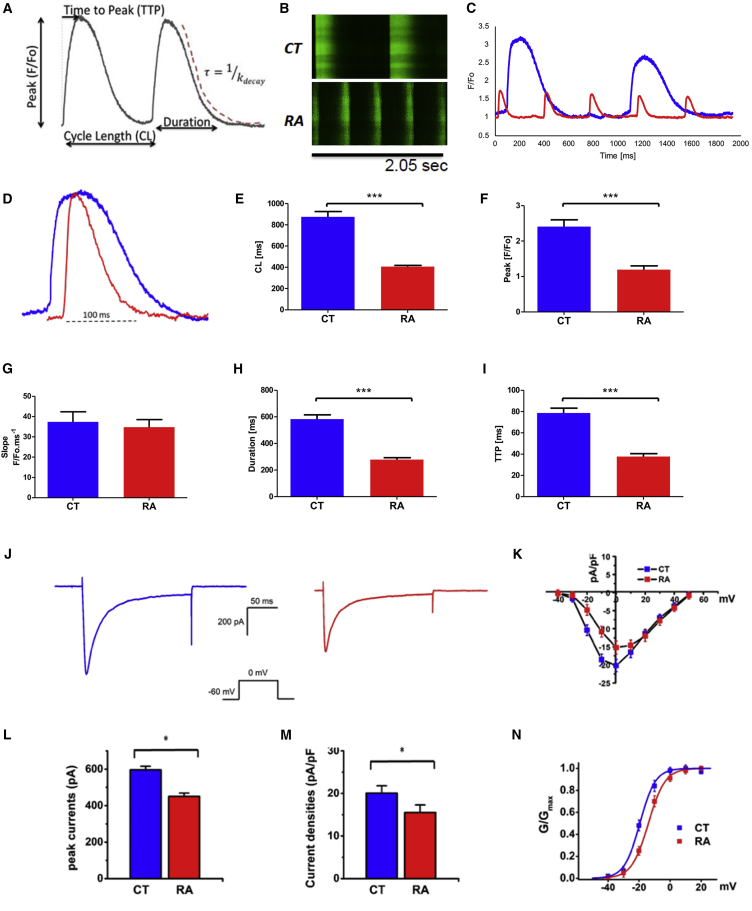
Human induced pluripotent stem cell (hiPSC)-derived atrial cardiomyocytes (CMs) hold great promise for elucidating underlying cellular mechanisms that cause atrial fibrillation (AF). In order to use atrial-like hiPSC-CMs for arrhythmia modeling, it is essential to better understand the molecular and electrophysiological phenotype of these cells. We performed comprehensive molecular, transcriptomic, and electrophysiologic analyses of retinoic acid (RA)-guided hiPSC atrial-like CMs and demonstrate that RA results in differential expression of genes involved in calcium ion homeostasis that directly interact with an RA receptor, chicken ovalbumin upstream promoter-transcription factor 2 (COUP-TFII). We report a mechanism by which RA generates an atrial-like electrophysiologic signature through the downstream regulation of calcium channel gene expression by COUP-TFII and modulation of calcium handling. Collectively, our results provide important insights into the underlying molecular mechanisms that regulate atrial-like hiPSC-CM electrophysiology and support the use of atrial-like CMs derived from hiPSCs to model AF.

Keywords: atrial fibrillation; cardiomyocytes; disease modeling; human induced pluripotent stem cells.


Figures

Figure 1
Figure 1
RA-Guided Differentiation of hiPSC-CMs Results in Increased Beating Frequency (A) Protocol for cardiac differentiation after small molecule differentiation; cells are incubated in 1 μM RA or DMSO for 5 days. At day 10, cells are enriched by glucose starvation. Analysis is performed at days 10, 15, and 30. Diff, differentiation. (B) Immunostaining showing the protein expression of pan-CM marker cardiac cTnT and atrial marker Kv1.5 in hiPSC-CMs at day 10. (C) qRT-PCR of ventricular markers, MYH7, in RA-treated and CT cells. (D and E) qRT-PCR of atrial markers KCNJ3 (D) and KCNA5 (E) in RA-treated and CT cells at day 30. (F) Representative flow cytometry contour plots of RA-treated and CT cells sorted into MLC2v positive and live fractions at day 10 (quadrant 1, upper left). (G) Representative flow cytometry contour plots of RA-treated and CT cells sorted into Kv1.5 positive and live fractions at day 10 (quadrant 1, upper left). (H and I) Averaged flow cytometry data from three biological replicates for live MLC2v (H) and Kv1.5 (I) flow cytometry fractions, respectively. (J) Comparison of beating frequency measured on hiPSC-CMs from CT and RA groups days 15–30. Data shown in all panels represent three pooled independent biological experiments displayed as mean ± SD, n = 3; p < 0.05, ∗∗p < 0.01, ∗∗∗p < 0.001.
Figure 2
Figure 2
Transcriptomic and ChIP Analysis of RA-Treated and CT hiPSC-CMs Reveal Differential Expression of Calcium Channel Genes Associated with COUP-TFII (A) Hierarchical clustering of DEGs in CT and RA hiPSC-CMs. (B) Volcano plot of RA-treated hiPSC-CMs (red) and CT (green) showing DEG with an absolute log2 of fold change >2 (x axis) and p < 0.05 (y axis). (C) Bar graph showing log2 fold change RPKM (reads per kilobase of coding sequence per million mapped) of RA-treated hiPSC-CMs relative to CT hiPSC-CMs. Levels of ventricular, atrial, nodal, and Ca channel genes were significantly differentially expressed with p < 0.05. (D) Real-time qPCR of NR2F2, CACNA1G, and CACNA1C, SERCA, and RyR2 in RA-treated and CT cells. (E) Representative western blots showing protein expression levels of COUP-TFII, Cav3.1, and Cav1.2, SERCA2A, and RyR2. (F) Densitometry analysis of COUP-TFII, HCN4, Cav3.1, and Cav1.2. (G–I) NR2F2 gene expression throughout the differentiation of hiPSC-L1-CMs (G). (H) ChIP-qPCR showing enrichment of CACNA1G and (I) CACNA1C followed by immunoprecipitation of COUP-TFII in RA-treated and CT hiPSC-L1-CMs at day 10 of differentiation. IgG, immunoglobulin G. Data shown in all panels represent three pooled independent biological experiments displayed as mean ± SD, n = 3; p < 0.05, ∗∗p < 0.01, ∗∗∗p < 0.001.
Figure 3
Figure 3
RA Treatment Increases Proportion of Atrial-like AP Morphologies and Atrial-Specific IK,ACh Response to Carbachol and Adenosine (A) Representative images of three major types of AP morphologies observed in hiPSC-L1-CMs: atrial-, nodal-, and ventricular-like. AP morphologies were recorded using intracellular sharp microelectrode recordings of single cells within monolayers. (B) Pie graphs displaying the percentage of morphologies observed in RA-treated (n = 32 cells) and CT hiPSC-L1-CMs (n = 42 cells). (C) Representative recordings of 10 μM carbachol (Cch) sensitive current (IK,ACh) in ventricular-like (CT) and atrial-like CMs (RA); voltage protocol is shown in inset. (D) Current-voltage relationship (I-V curve) for Cch sensitive IK,ACh densities in ventricular-like and atrial-like CMs; n = 3 cells each group. (E) Quantification of IK,ACh densities at −120 mV in ventricular-like and atrial-like CMs; n = 3 cells each group. (F) Representative recordings of 100 μM adenosine sensitive current (IK,ACh) in ventricular-like (CT) and atrial-like CMs (RA). (G) Current-voltage relationship (I-V curve) for adenosine sensitive IK,ACh densities in ventricular-like and atrial-like CMs; n = 4 cells each group. (H) Quantification of IK,ACh densities at −120 mV in ventricular-like and atrial-like CMs; n = 4 cells each group. Data shown in all panels represent pooled independent biological experiments displayed as mean ± SD, p < 0.05.
Figure 4
Figure 4
RA Treatment of hiPSC-CMs Increases Rate of Calcium Uptake and Release, Reduces L-type Calcium Current, and Limits Channel Availability (A) Space-averaged calcium transients illustrating the parameters to be analyzed. (B) Representative line scans showing the sCaREs in CT and RA hiPSC-L1-CMs. (C) Space-averaged calcium transients comparing spontaneous activity between CT (blue line) and RA (red line) hiPSC-CMs. (D) Overlap of normalized calcium transients from CT and RA CMs showing differences in TTP, duration, and decay. Comparison of sCaRE parameters from CT- and RA-treated CMs. (E) Cycle length (CL); n = 25 cells per group. (F) Peak amplitude; n = 25 cells per group. (G) Slope; n = 25 cells per group. (H and I) Duration, n = 25 cells per group (H); TTP, n = 25 cells per group (I). (J) Representative recordings of the voltage-gated ICa,L in hiPSC-CMs in CT (left panel) and RA-treated cells (right panel); currents were measured from a holding potential of −90 mV to test potentials ranging from −60 to 0 mV in 10 mV steps; n = 5 cells. (K) Peak current-voltage relationship (I-V curve) for ICa,L recorded in hiPCS-CMs treated with RA versus CT cells; n = 5 cells. (L) Peak current amplitudes; n = 5 cells. (M) Densities measured at 0 mV; n = 5 cells. (N) Voltage dependence of activation with a conductance-voltage (G-V curve) for ICa,L recorded in hiPCS-CMs treated with RA versus CT cells; n = 5 cells. Data shown in all panels represent pooled independent biological experiments displayed as means ± SD, p < 0.05, ∗∗∗p < 0.001.

References

    1. Chelu M.G., Sarma S., Sood S., Wang S., van Oort R.J., Skapura D.G., Li N., Santonastasi M., Muller F.U., Schmitz W. Calmodulin kinase II-mediated sarcoplasmic reticulum Ca2+ leak promotes atrial fibrillation in mice. J. Clin. Invest. 2009;119:1940–1951. - PMC - PubMed
    1. Chugh S.S., Havmoeller R., Narayanan K., Singh D., Rienstra M., Benjamin E.J., Gillum R.F., Kim Y.H., McAnulty J.H., Jr., Zheng Z.J. Worldwide epidemiology of atrial fibrillation: a Global Burden of Disease 2010 study. Circulation. 2014;129:837–847. - PMC - PubMed
    1. Darbar D., Roden D.M. Genetic mechanisms of atrial fibrillation: impact on response to treatment. Nat. Rev. Cardiol. 2013;10:317–329. - PMC - PubMed
    1. Devalla H.D., Schwach V., Ford J.W., Milnes J.T., El-Haou S., Jackson C., Gkatzis K., Elliott D.A., Chuva de Sousa Lopes S.M., Mummery C.L. Atrial-like cardiomyocytes from human pluripotent stem cells are a robust preclinical model for assessing atrial-selective pharmacology. EMBO Mol. Med. 2015;7:394–410. - PMC - PubMed
    1. Faggioni M., Savio-Galimberti E., Venkataraman R., Hwang H.S., Kannankeril P.J., Darbar D., Knollmann B.C. Suppression of spontaneous ca elevations prevents atrial fibrillation in calsequestrin 2-null hearts. Circ. Arrhythm. Electrophysiol. 2014;7:313–320. - PMC - PubMed

Publication types

MeSH terms