. 2018 Apr 20:9:696.
doi: 10.3389/fimmu.2018.00696. eCollection 2018.

Macrophage Lamin A/C Regulates Inflammation and the Development of Obesity-Induced Insulin Resistance

Affiliations

Macrophage Lamin A/C Regulates Inflammation and the Development of Obesity-Induced Insulin Resistance

Youngjo Kim et al. Front Immunol. .

Abstract

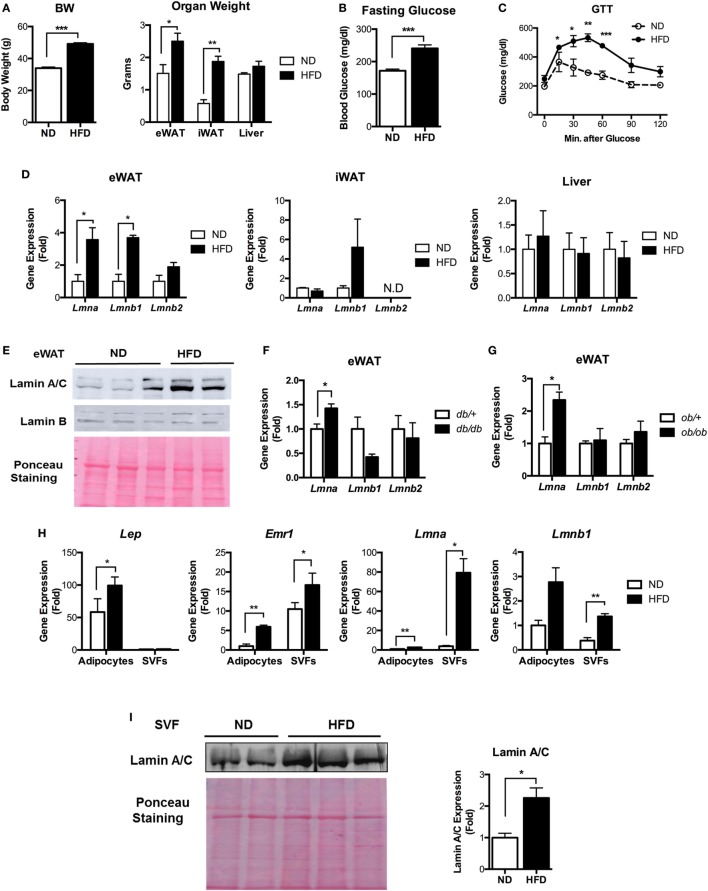
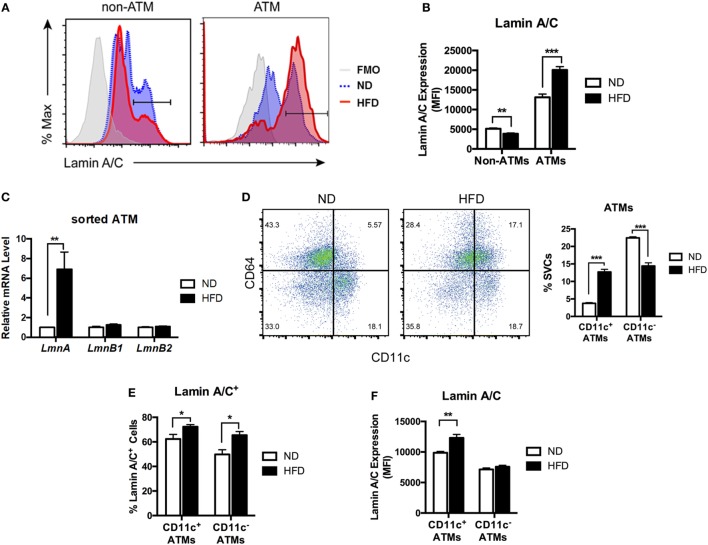
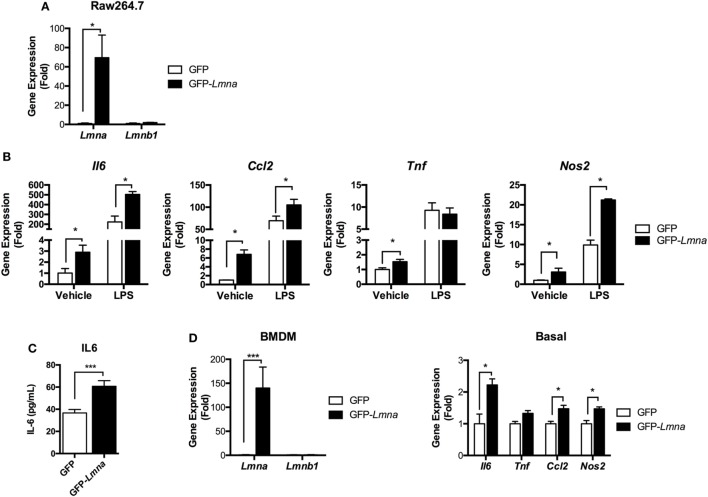
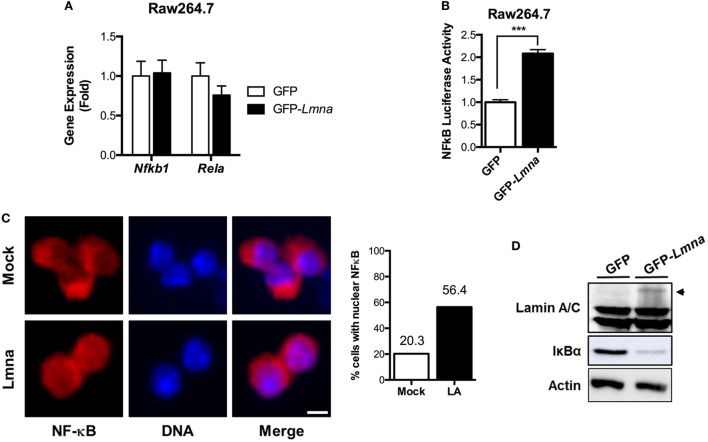
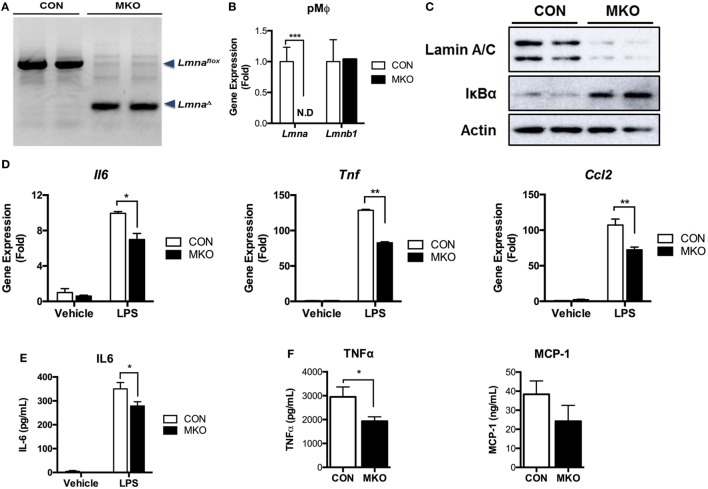
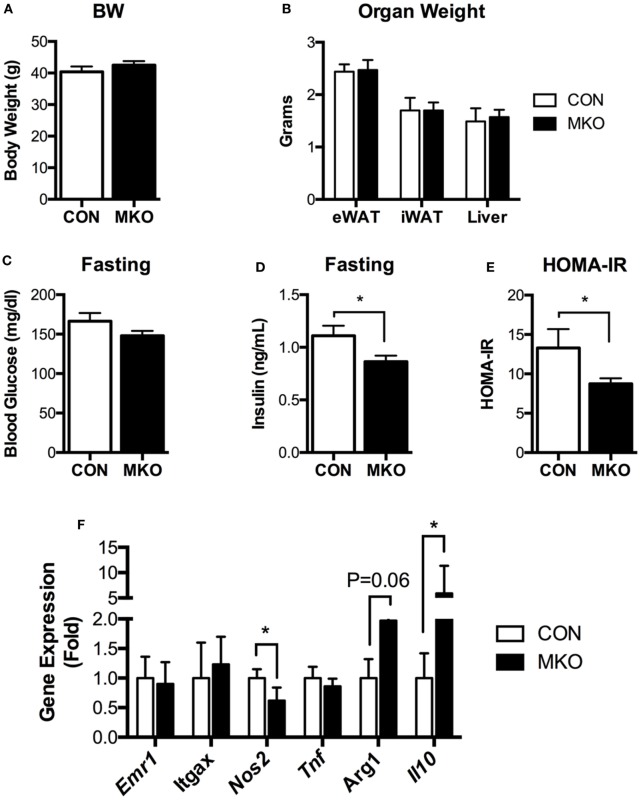
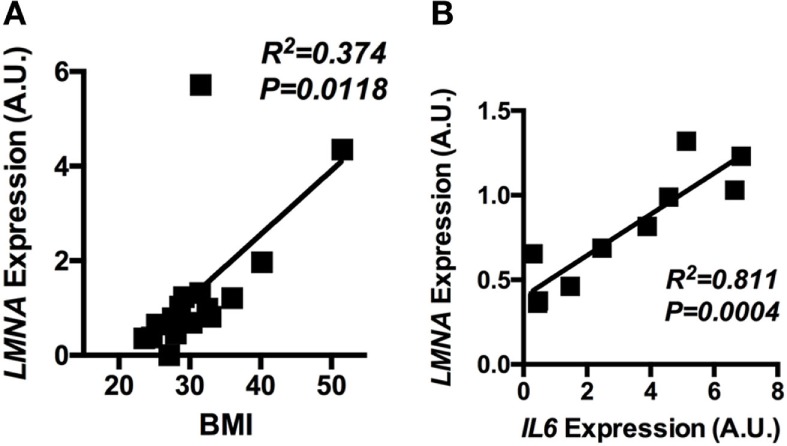
Obesity-induced chronic low-grade inflammation, in particular in adipose tissue, contributes to the development of insulin resistance and type 2 diabetes. However, the mechanism by which obesity induces adipose tissue inflammation has not been completely elucidated. Recent studies suggest that alteration of the nuclear lamina is associated with age-associated chronic inflammation in humans and fly. These findings led us to investigate whether the nuclear lamina regulates obesity-mediated chronic inflammation. In this study, we show that lamin A/C mediates inflammation in macrophages. The gene and protein expression levels of lamin A/C are significantly increased in epididymal adipose tissues from obese rodent models and omental fat from obese human subjects compared to their lean controls. Flow cytometry and gene expression analyses reveal that the protein and gene expression levels of lamin A/C are increased in adipose tissue macrophages (ATMs) by obesity. We further show that ectopic overexpression of lamin A/C in macrophages spontaneously activates NF-κB, and increases the gene expression levels of proinflammatory genes, such as Il6, Tnf, Ccl2, and Nos2. Conversely, deletion of lamin A/C in macrophages reduces LPS-induced expression of these proinflammatory genes. Importantly, we find that myeloid cell-specific lamin A/C deficiency ameliorates obesity-induced insulin resistance and adipose tissue inflammation. Thus, our data suggest that lamin A/C mediates the activation of ATM inflammation by regulating NF-κB, thereby contributing to the development of obesity-induced insulin resistance.

Keywords: adipose tissue; inflammation; insulin resistance; lamin A/C; macrophages; obesity.


Figures

Figure 1
Figure 1
Lamin A/C expression is upregulated in adipose tissue from obese mice. (A–E) Male C57BL/6 mice were fed a normal chow diet (ND) or a high-fat diet (HFD) for 12 weeks to induce obesity (n = 14 per group). (A) Total body weights (left) and organ weights (right), (B) fasting blood glucose, (C) glucose tolerance test, and (D) quantitative real-time RT-PCR (qRT-PCR) analysis of Lmna, Lmnb1, and Lmnb2 in eWAT, iWAT, and liver from ND- and HFD-fed mice. Amounts of transcripts for each gene in HFD tissues relative to those in ND tissues are presented. (E) Western blotting analysis of epididymal white adipose tissues (eWAT) lysate from ND- and HFD-fed mice. Lamin A/C (upper), lamin B1 (middle) protein levels are presented. Equal amount of total proteins as measured by Ponceau S staining (lower) of each lane. (F) qRT-PCR analysis of Lmna, Lmnb1, and Lmnb2 in eWAT from db/+ and db/db male mice (8 weeks, n = 5 per group). (G) qRT-PCR analysis of Lmna, Lmnb1, and Lmnb2 in eWAT from ob/+ and ob/ob male mice (10 weeks, n = 4 per group). (H) qRT-PCR analysis of Lep, Emr1, Lmna, and Lmnb1 in adipocyte fractions and stromal vascular cell fractions from eWAT of ND and HFD mice (n = 6 per group). (I) Immunoblots of lysates from the stromal vascular fraction (SVF) of eWAT from ND and HFD mice for lamin A/C antibody (upper left), Ponceau S staining (lower left) and quantitation of lamin A/C (right) were presented. Error bars represent SEM. *p < 0.05, **p < 0.01, ***p < 0.001.
Figure 2
Figure 2
Lamin A/C expression is elevated in adipose tissue macrophages (ATMs) from obese mice. Male C57BL/6 mice were fed a normal diet (ND) or a high-fat diet (HFD) for 12 weeks (n = 6 per group). (A) Histogram of lamin A/C in non-ATM (CD45+CD64) and ATM (CD45+CD64+) from ND- and HFD-fed mice. (B) Lamin A/C expression level as determined by mean fluorescence intensity (MFI) in the non-ATM and ATM populations from epididymal white adipose tissues (eWAT) of ND and HFD mice (n = 5 per group). (C) Quantitative real-time RT-PCR analysis of Lmna, Lmnb1, and Lmnb2 in sorted ATMs from eWAT of ND- and HFD-fed mice (n = 3 per groups). (D) A representative flow cytometry plot showing ATMs (CD64+CD11c and CD64+CD11c+) and ATDCs (CD64CD11c+) in stromal vascular cell (left) and frequency of CD11c+ ATMs and CD11c ATMs from eWAT of ND- and HFD-fed mice (right). (E) The frequency of lamin A/C+ cells in the CD11c+ and CD11c ATM populations in eWAT from ND and HFD mice. (F) Lamin A/C expression level as determined by MFI in the CD11c+ and CD11c ATM populations from eWAT of ND and HFD mice. Error bars represent SEM. *p < 0.05, **p < 0.01, ***p < 0.001.
Figure 3
Figure 3
Lamin A/C overexpression induces proinflammatory cytokine expression in macrophages. (A–C) Raw 264.7 cells were transfected with GFP or GFP-Lmna. After 24 h, transfected cells were cultured in the absence or presence of 100 ng/ml LPS for 6 h. (A) Quantitative real-time RT-PCR (qRT-PCR) analysis of Lmna and Lmnb1 in GFP or GFP-Lmna-transfected cells. (B) qRT-PCR analysis of Il6, Tnf, Ccl2, and Nos2 in GFP or GFP-Lmna transfected cells. (C) ELISA of IL-6 in supernatant of Raw 264.7 cells transfected with GFP or GFP-Lmna in the absence of LPS. (D) Characterization of bone marrow-derived macrophages (BMDMs) transfected GFP-Lmna. qRT-PCR analysis of Lmna and Lmnb1 (left) and Il6, Tnf, Ccl2, and Nos2 in GFP or GFP-Lmna transfected BMDMs (right). Error bars represent SEM. *p < 0.05, ***p < 0.001.
Figure 4
Figure 4
Lamin A/C increases NF-κB activity via nuclear translocation of p65/Rel A, a NF-κB complex subunit. (A) qRT-PCR analysis of Nfkb1 and Rela in Raw 264.7 cells transfected with either GFP or GFP-Lmna. (B) NF-κB luciferase activity in Raw 264.7 cells co-transfected with GFP or GFP-Lmna together with pNF-κB-Luc, a luciferase reporter construct that has κB responsible elements in the promoter. Luciferase activities were normalized by those in cells co-transfected with a non-reporter plasmid, pRL-SV40. (C) Immunofluorescence images of bone marrow-derived macrophages transfected with GFP (Mock) or GFP-Lmna (Lmna) and quantitation for cells with nuclear NF-κB p65/Rel A. Cells with nuclear NF-κB were defined based on the presence of nuclear signal and obvious lack of cytoplasmic signal as shown in the representative images (Scale bar: 5 μm). (D) Immunoblots of lysates from transfected Raw 264.7 cells with anti-Lamin A/C (top), anti-IκBα (middle), or anti-actin (bottom). Arrowhead marks GFP fusion lamin A protein size.
Figure 5
Figure 5
Depletion of lamin A/C suppresses proinflammatory gene activation upon LPS treatment in macrophages. (A–E) Analyses of peritoneal macrophages from control and myeloid cell-specific Lmna KO mice (MKO) mice. (A) PCR genotyping of peritoneal macrophages from WT control (CON, Lmnaflox/flox) and MKO (LysM-Cre; Lmnaflox/flox) mice. Arrowheads mark Lmnaflox (uncleaved) and LmnaΔ (cleaved) alleles. (B) qRT-PCR analysis of Lmna and Lmnb1 in peritoneal macrophages isolated from CON and MKO mice. (C) Immunoblots of lysates from peritoneal macrophages for lamin A/C (top), IκBα (middle), or actin (bottom). (D,E) Peritoneal macrophages were isolated from control and MKO mice and then treated with vehicle or 10 ng/ml LPS for 2 h. (D) qRT-PCR analysis of Il6, Tnf, and Ccl2 in peritoneal macrophages isolated from CON and MKO mice. (E) Level of IL-6 in supernatant of CON and MKO peritoneal macrophages treated with vehicle or 10 ng/ml LPS for 6 h. (F) Plasma TNFα and MCP-1 levels after i.p. injection of LPS (20 mg/kg BW) were measured in CON and MKO mice (n = 6 per group). Error bars represent SEM. *p < 0.05, **p < 0.01.
Figure 6
Figure 6
Deletion of Lmna in myeloid tissues attenuates high-fat diet-induced insulin resistance in mice. CON and myeloid cell-specific Lmna KO mice (MKO) male mice (6 weeks) were fed a high-fat diet (HFD) for 12 weeks (CON, n = 4; MKO, n = 9). (A) Body weight, (B) organ weights of epididymal white adipose tissues (eWAT), inguinal white adipose tissue, and liver, (C) fasting blood glucose, (D) fasting plasma insulin, (E) homeostatic model assessment for insulin resistance index, (F) gene expression in eWAT from CON and MKO mice. Error bars represent SEM. *p < 0.05.
Figure 7
Figure 7
The adipose LMNA expression levels correlate with BMI and IL6 expressions in human subjects. Human omental adipose tissue samples were obtained by surgical biopsy from 30 individuals, and LMNA and IL6 mRNA levels were determined by quantitative real-time RT-PCR. Linear regression analyses of LMNA mRNA level in human omental adipose tissue with respect to (A) BMI and (B) IL6 mRNA levels are presented. Pearson’s correlation coefficients (r) between LMNA and either BMI or IL6 level are presented in each graph.

Similar articles

Cited by

References

    1. Chiang SH, Bazuine M, Lumeng CN, Geletka LM, Mowers J, White NM, et al. The protein kinase IKKepsilon regulates energy balance in obese mice. Cell (2009) 138(5):961–75.10.1016/j.cell.2009.06.046 - DOI - PMC - PubMed
    1. Lee BC, Kim MS, Pae M, Yamamoto Y, Eberie D, Shimada T, et al. Adipose natural killer cells regulate adipose tissue macrophages to promote insulin resistance in obesity. Cell Metab (2016) 23(4):685–98.10.1016/j.cmet.2016.03.002 - DOI - PMC - PubMed
    1. Weisberg SP, McCann D, Desai M, Rosenbaum M, Leibel RL, Ferrante AW, Jr. Obesity is associated with macrophage accumulation in adipose tissue. J Clin Invest (2003) 112(12):1796–808.10.1172/JCI19246 - DOI - PMC - PubMed
    1. Lumeng CN, Bodzin JL, Saltiel AR. Obesity induces a phenotypic switch in adipose tissue macrophage polarization. J Clin Invest (2007) 117(1):175–84.10.1172/JCI29881 - DOI - PMC - PubMed
    1. Lumeng CN, DelProposto JB, Westcott DJ, Saltiel AR. Phenotypic switching of adipose tissue macrophages with obesity is generated by spatiotemporal differences in macrophage subtypes. Diabetes (2008) 57(12):3239–46.10.2337/db08-0872 - DOI - PMC - PubMed

Publication types