

Conversion of epithelial-to-mesenchymal transition to mesenchymal-to-epithelial transition is mediated by oxygen concentration in pancreatic cancer cells
- PMID: 29731878
- PMCID: PMC5921234
- DOI: 10.3892/ol.2018.8219
Conversion of epithelial-to-mesenchymal transition to mesenchymal-to-epithelial transition is mediated by oxygen concentration in pancreatic cancer cells
Retraction in
-
Conversion of epithelial-to-mesenchymal transition to mesenchymal-to-epithelial transition is mediated by oxygen concentration in pancreatic cancer cells.Oncol Lett. 2022 Apr;23(4):107. doi: 10.3892/ol.2022.13227. Epub 2022 Feb 4. Oncol Lett. 2022. PMID: 35242235 Free PMC article.
Abstract
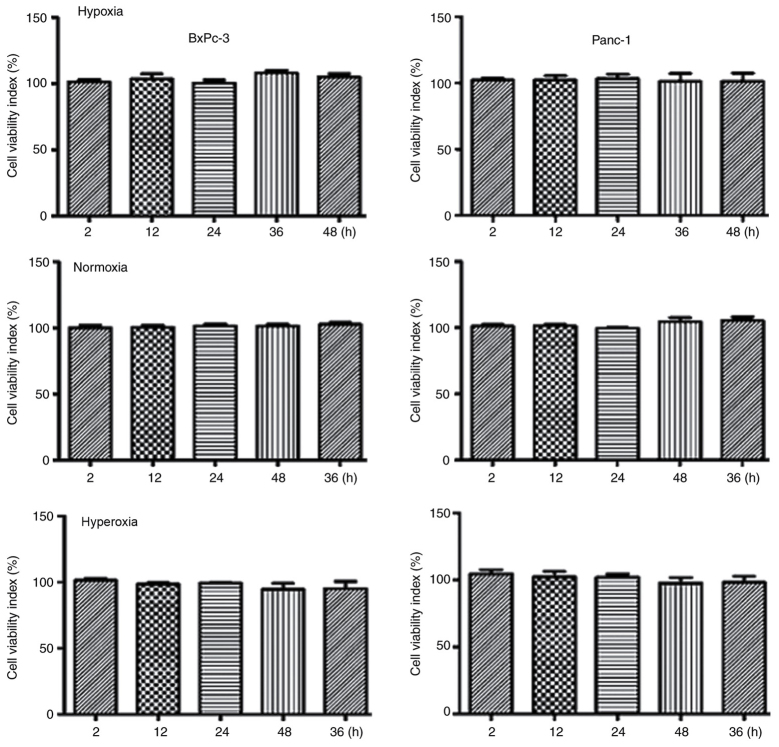
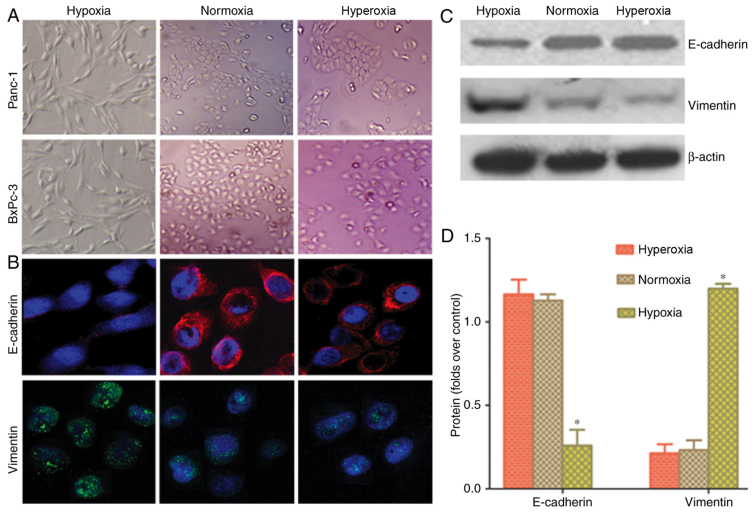
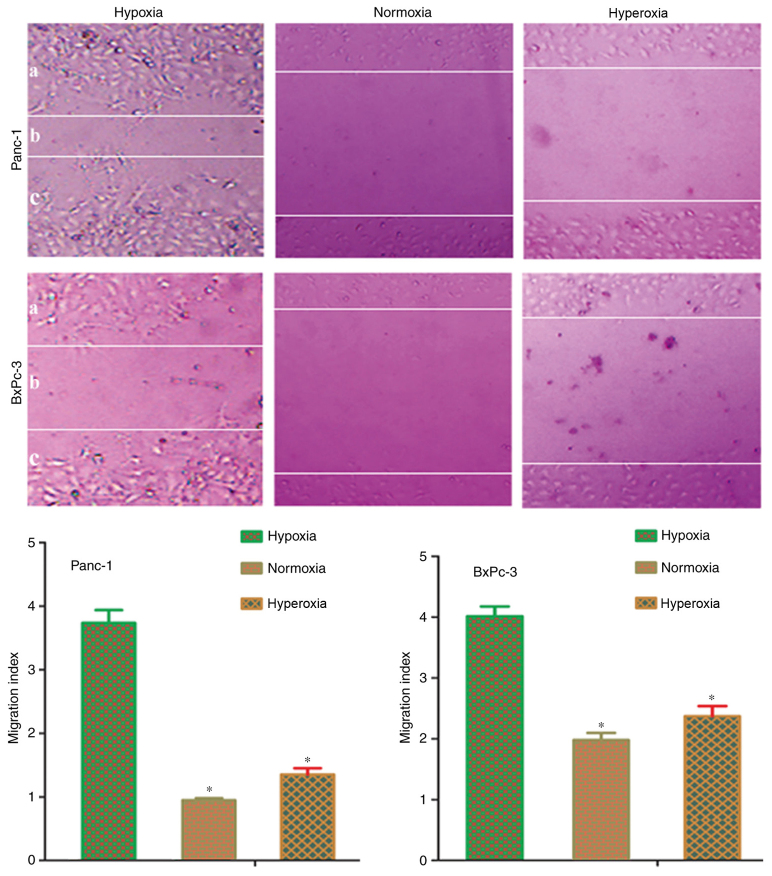
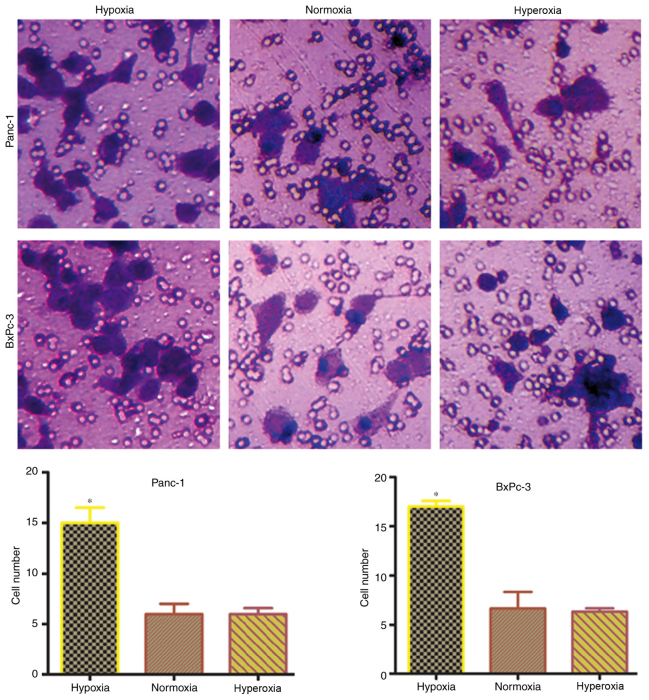
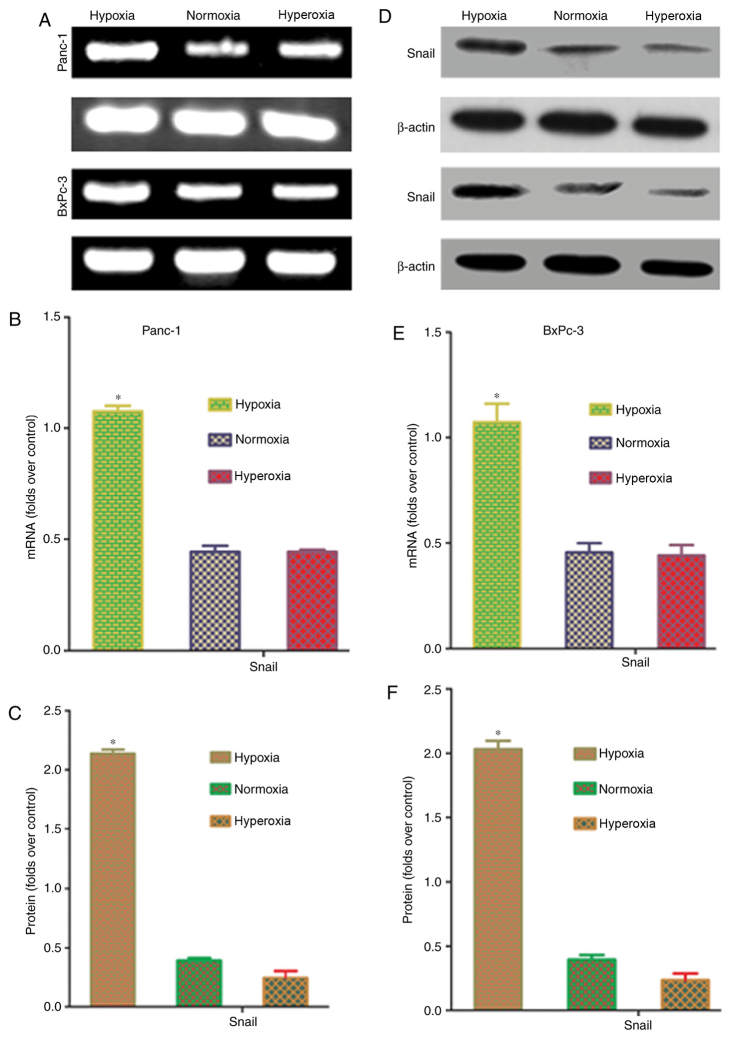
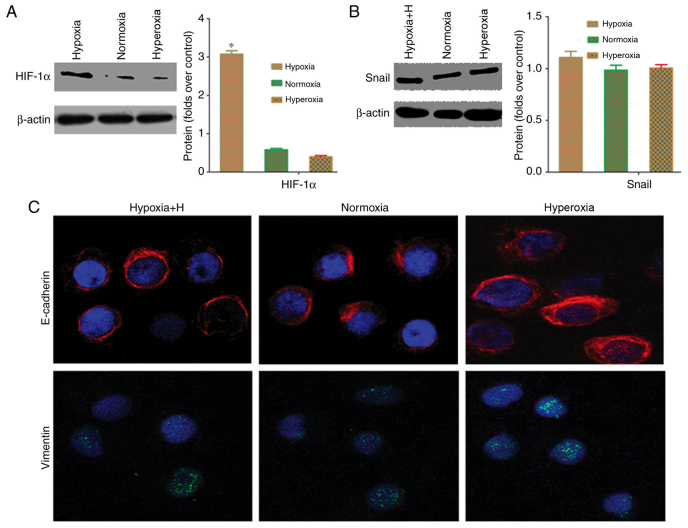
Tumor metastasis is accompanied by a two-stage process of epithelial-to-mesenchymal transition (EMT) and mesenchymal-to-epithelial transition (MET). Currently, the exact mechanisms underlying EMT-MET conversion are unclear. In the present study, the mechanisms by which primary sites (hypoxic) and homing sites (normoxic or hyperoxic) participate in EMT-MET conversion were evaluated. Pancreatic cancer cells were grown under different oxygenation conditions. Cell morphology and epithelial (E)-cadherin and vimentin expression were examined. Transwell chambers were used to examine tumor invasiveness, and scratch assays were performed to examine cell migration. Reverse transcription-polymerase chain reaction and western blot analysis were used to quantitate the mRNA and protein expression of E-cadherin, vimentin, Snail and hypoxia-inducible factor (HIF)-1α. BxPc-3 and Panc-1 cells grown under hypoxic conditions demonstrated increased partial EMT, reduced E-cadherin expression, and increased vimentin expression, compared with cells grown under normoxic or hyperoxic conditions. Cells grown under hypoxic conditions also indicated increased migration and invasiveness. HIF-1α mRNA and protein expression was increased in cells grown under hypoxic conditions. These changes were reversed when a specific inhibitor of the HIF-1α receptor was used to block HIF-1α signaling. Differences in oxygen concentration at primary sites and homing sites are important in the EMT-MET process, and the underlying mechanism may involve HIF-1α-Snail signaling.
Keywords: epithelial-to-mesenchymal transition; hypoxia; hypoxia-inducible factor-1α; mesenchymal- to-epithelial transition; pancreatic cancer.
Figures
Similar articles
-
Hypoxia, partial EMT and collective migration: Emerging culprits in metastasis.Transl Oncol. 2020 Nov;13(11):100845. doi: 10.1016/j.tranon.2020.100845. Epub 2020 Aug 8. Transl Oncol. 2020. PMID: 32781367 Free PMC article. Review.
-
Hypoxia-inducible factor 1α-induced epithelial-mesenchymal transition of endometrial epithelial cells may contribute to the development of endometriosis.Hum Reprod. 2016 Jun;31(6):1327-38. doi: 10.1093/humrep/dew081. Epub 2016 Apr 19. Hum Reprod. 2016. PMID: 27094478
-
Upregulation of the long noncoding RNA UBOX5 antisense RNA 1 (UBOX5-AS1) under hypoxic conditions promotes epithelial-mesenchymal transition in endometriosis.Ann Transl Med. 2021 May;9(9):790. doi: 10.21037/atm-20-4546. Ann Transl Med. 2021. PMID: 34268403 Free PMC article.
-
HIF-1α induces the epithelial-mesenchymal transition in gastric cancer stem cells through the Snail pathway.Oncotarget. 2017 Feb 7;8(6):9535-9545. doi: 10.18632/oncotarget.14484. Oncotarget. 2017. PMID: 28076840 Free PMC article.
-
Hypoxia Induces Epithelial-Mesenchymal Transition in Follicular Thyroid Cancer: Involvement of Regulation of Twist by Hypoxia Inducible Factor-1α.Yonsei Med J. 2015 Nov;56(6):1503-14. doi: 10.3349/ymj.2015.56.6.1503. Yonsei Med J. 2015. PMID: 26446630 Free PMC article.
Cited by
-
Epithelial-to-Mesenchymal Transition in the Light of Plasticity and Hybrid E/M States.J Clin Med. 2021 May 29;10(11):2403. doi: 10.3390/jcm10112403. J Clin Med. 2021. PMID: 34072345 Free PMC article. Review.
-
Hypoxia, partial EMT and collective migration: Emerging culprits in metastasis.Transl Oncol. 2020 Nov;13(11):100845. doi: 10.1016/j.tranon.2020.100845. Epub 2020 Aug 8. Transl Oncol. 2020. PMID: 32781367 Free PMC article. Review.
-
Establishment of primary human breast cancer cell lines using "pulsed hypoxia" method and development of metastatic tumor model in immunodeficient mice.Cancer Cell Int. 2019 Feb 28;19:46. doi: 10.1186/s12935-019-0766-5. eCollection 2019. Cancer Cell Int. 2019. PMID: 30858763 Free PMC article.
-
Insulin-producing organoids engineered from islet and amniotic epithelial cells to treat diabetes.Nat Commun. 2019 Oct 3;10(1):4491. doi: 10.1038/s41467-019-12472-3. Nat Commun. 2019. PMID: 31582751 Free PMC article.
-
Colony‑stimulating factor CSF2 mediates the phenotypic plasticity of small‑cell lung cancer by regulating the p‑STAT3/MYC pathway.Oncol Rep. 2022 Jul;48(1):122. doi: 10.3892/or.2022.8333. Epub 2022 May 18. Oncol Rep. 2022. PMID: 35583004 Free PMC article.
References
Publication types
LinkOut - more resources
Full Text Sources
Other Literature Sources
Research Materials
Miscellaneous