

Donor variability among anti-inflammatory pre-activated mesenchymal stromal cells
- PMID: 29732384
- PMCID: PMC5932627
- DOI: 10.1142/S2339547816500084
Donor variability among anti-inflammatory pre-activated mesenchymal stromal cells
Abstract
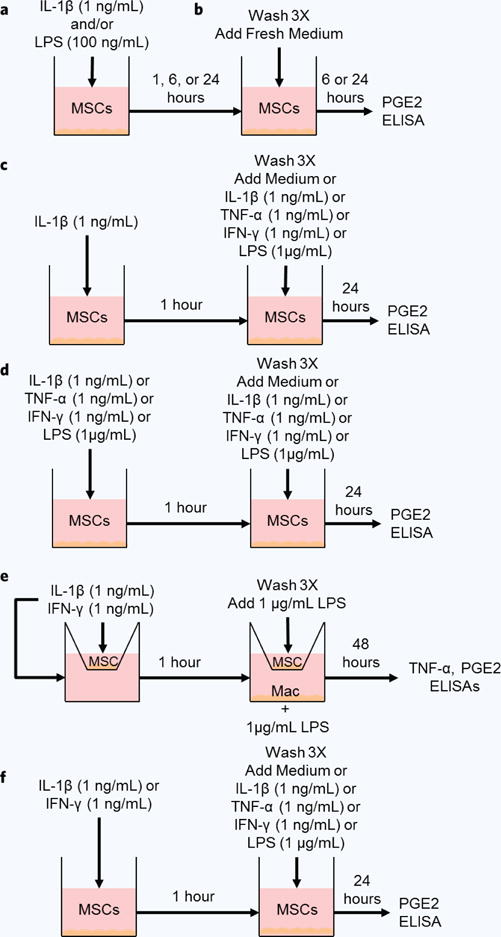
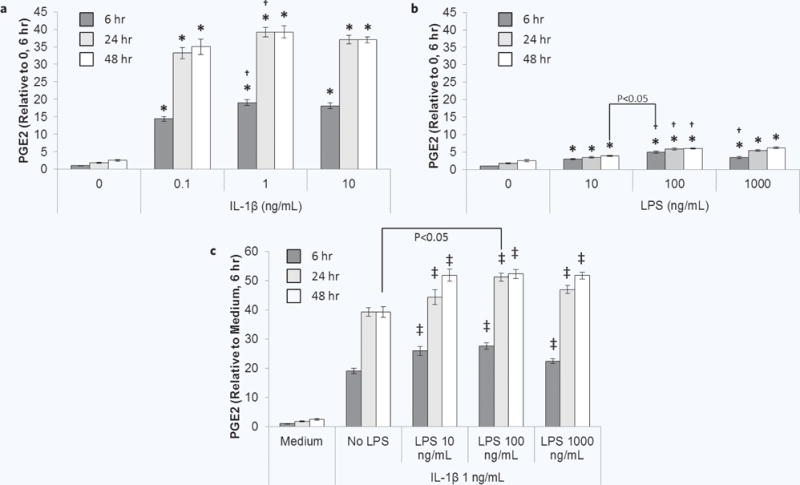
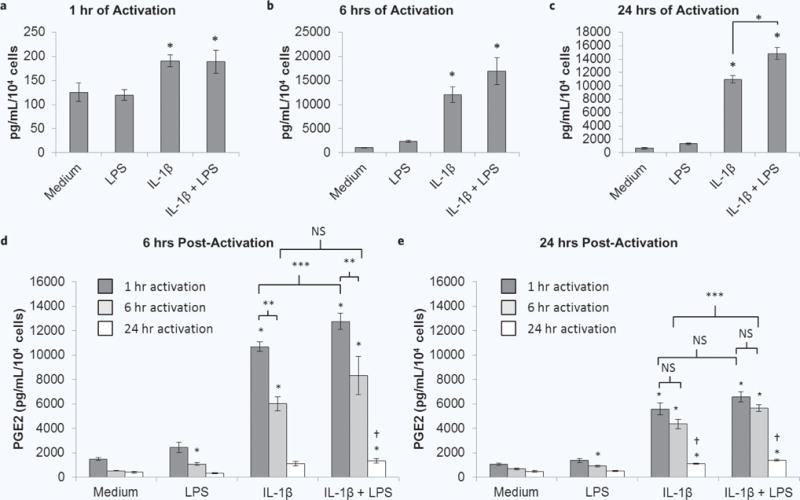
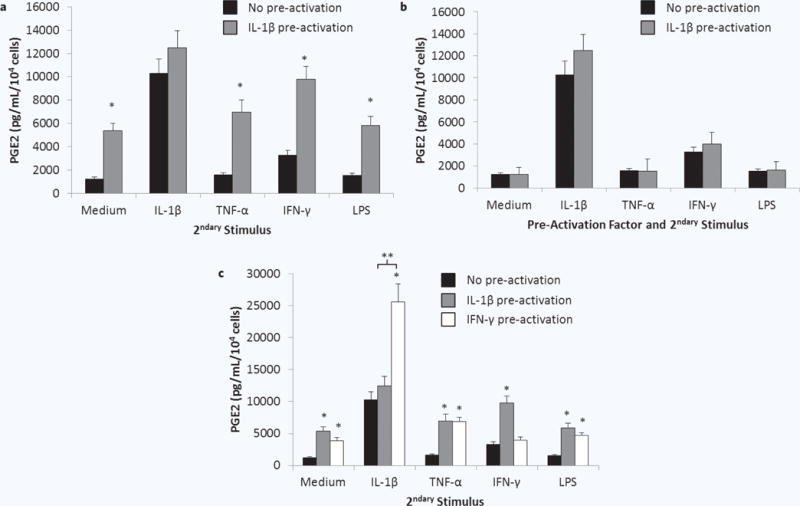
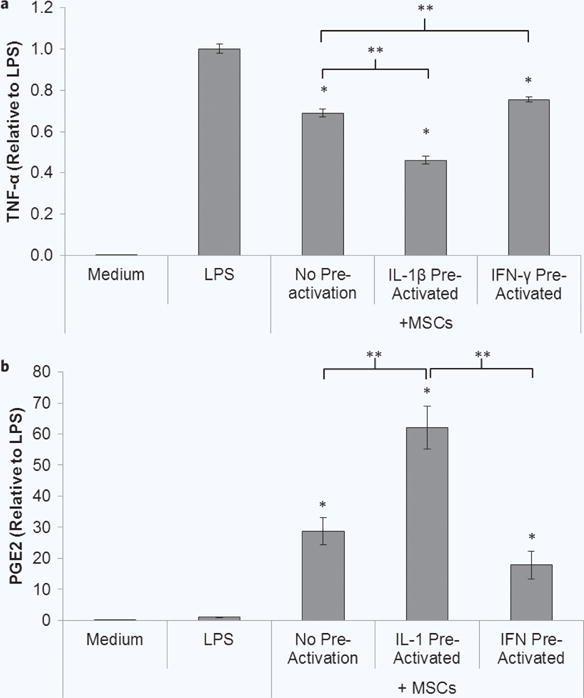
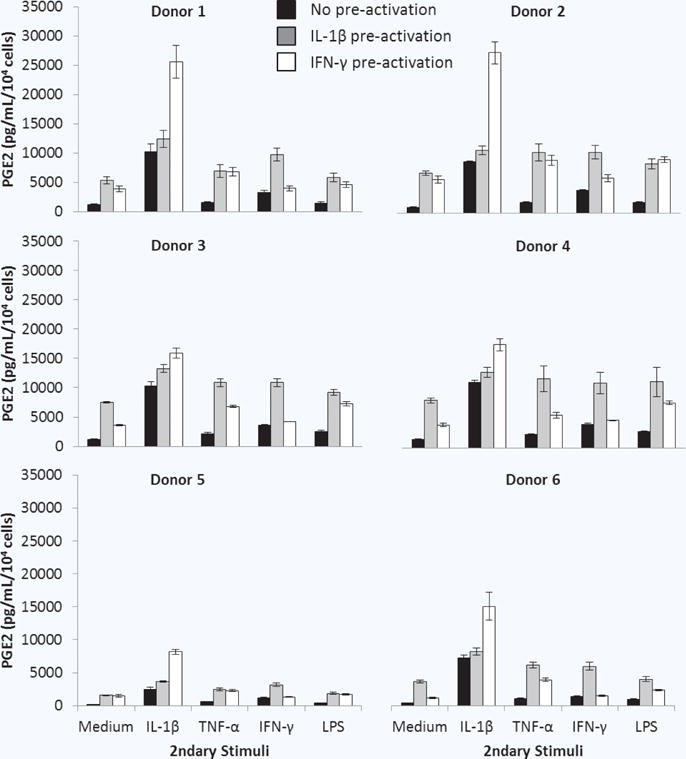
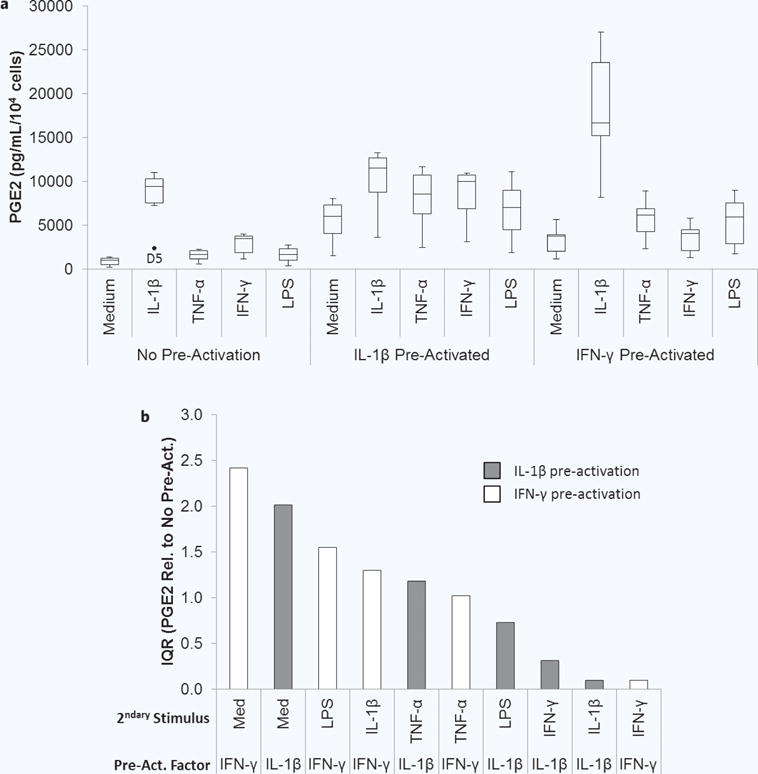
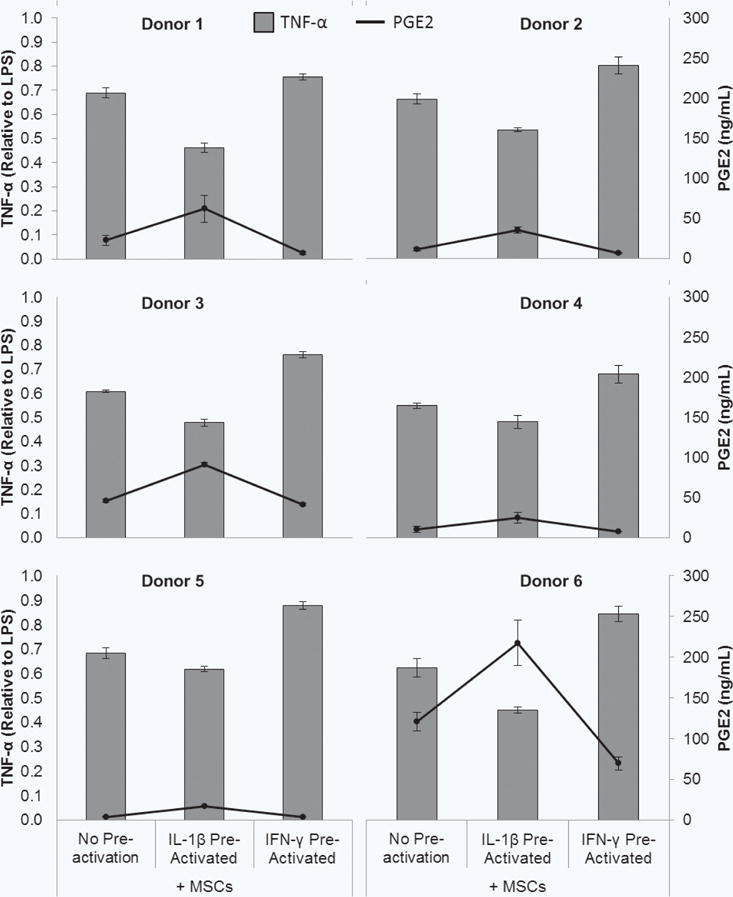
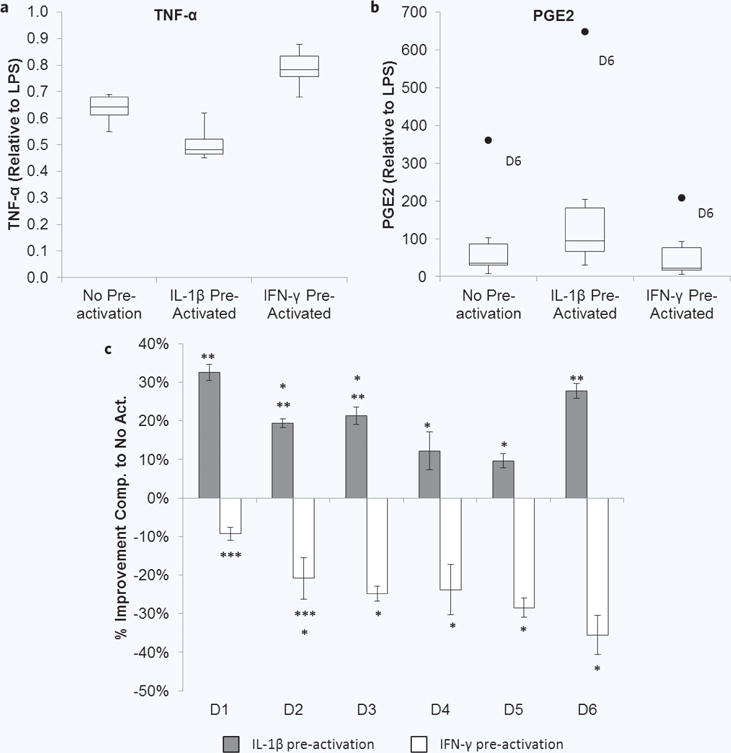
Therapeutic mesenchymal stromal cells (MSCs) are attractive in part due to their immunomodulatory properties, achieved by their paracrine secretion of factors including prostaglandin E2 (PGE2). Despite promising pre-clinical data, demonstrating clinical efficacy has proven difficult. The current studies were designed to develop approaches to pre-induce desired functions from naïve MSCs and examine MSC donor variability, two factors contributing to this disconnect. MSCs from six human donors were pre-activated with interleukin 1 beta (IL-1β) at a concentration and duration identified as optimal or interferon gamma (IFN-γ) as a comparator. Their secretion of PGE2 after pre-activation and secondary exposure to pro-inflammatory molecules was measured. Modulation of tumor necrosis factor alpha (TNF-α) secretion from M1 pro-inflammatory macrophages by co-cultured pre-activated MSCs was also measured. Our results indicated that pre-activation of MSCs with IL-1β resulted in upregulated PGE2 secretion post exposure. Pre-activation with IL-1β or IFN-γ resulted in higher sensitivity to induction by secondary stimuli compared to no pre-activation. While IL-1β pre-activation led to enhanced MSC-mediated attenuation of macrophage TNF-α secretion, IFN-γ pre-activation resulted in enhanced TNF-α secretion. Donor variability was noted in PGE2 secretion and upregulation and the level of improved or impaired macrophage modulation.
Keywords: Donor Variability; Immunomodulation; Interleukin 1 Beta; Macrophages; Mesenchymal Stromal Cells; Prostaglandin E2.
Figures
Similar articles
-
Identification of IL-1β and LPS as optimal activators of monolayer and alginate-encapsulated mesenchymal stromal cell immunomodulation using design of experiments and statistical methods.Biotechnol Prog. 2015 Jul-Aug;31(4):1058-70. doi: 10.1002/btpr.2103. Epub 2015 May 28. Biotechnol Prog. 2015. PMID: 25958832 Free PMC article.
-
Pre-conditioning mesenchymal stromal cell spheroids for immunomodulatory paracrine factor secretion.Cytotherapy. 2014 Mar;16(3):331-45. doi: 10.1016/j.jcyt.2013.09.004. Epub 2013 Nov 9. Cytotherapy. 2014. PMID: 24219905
-
The effect of local anesthetic on pro-inflammatory macrophage modulation by mesenchymal stromal cells.Int Immunopharmacol. 2016 Apr;33:48-54. doi: 10.1016/j.intimp.2016.01.019. Epub 2016 Feb 6. Int Immunopharmacol. 2016. PMID: 26854576 Free PMC article.
-
Activated T-cells and pro-inflammatory cytokines differentially regulate prostaglandin E2 secretion by mesenchymal stem cells.Biochem Biophys Res Commun. 2012 Mar 9;419(2):215-20. doi: 10.1016/j.bbrc.2012.01.150. Epub 2012 Feb 7. Biochem Biophys Res Commun. 2012. PMID: 22333568
-
The Role of COX-2 and PGE2 in the Regulation of Immunomodulation and Other Functions of Mesenchymal Stromal Cells.Biomedicines. 2023 Feb 3;11(2):445. doi: 10.3390/biomedicines11020445. Biomedicines. 2023. PMID: 36830980 Free PMC article. Review.
Cited by
-
In vitro inflammatory multi-cellular model of osteoarthritis.Osteoarthr Cartil Open. 2024 Jan 5;6(1):100432. doi: 10.1016/j.ocarto.2023.100432. eCollection 2024 Mar. Osteoarthr Cartil Open. 2024. PMID: 38288345 Free PMC article.
-
The Impact of Various Culture Conditions on Human Mesenchymal Stromal Cells Metabolism.Stem Cells Int. 2021 Mar 1;2021:6659244. doi: 10.1155/2021/6659244. eCollection 2021. Stem Cells Int. 2021. PMID: 33727935 Free PMC article.
-
Characterizing human mesenchymal stromal cells' immune-modulatory potency using targeted lipidomic profiling of sphingolipids.Cytotherapy. 2022 Jun;24(6):608-618. doi: 10.1016/j.jcyt.2021.12.009. Epub 2022 Feb 19. Cytotherapy. 2022. PMID: 35190267 Free PMC article.
-
Umbilical cord as a long-term source of activatable mesenchymal stromal cells for immunomodulation.Stem Cell Res Ther. 2019 Sep 23;10(1):285. doi: 10.1186/s13287-019-1376-9. Stem Cell Res Ther. 2019. PMID: 31547865 Free PMC article.
-
The Effect of Inflammatory Priming on the Therapeutic Potential of Mesenchymal Stromal Cells for Spinal Cord Repair.Cells. 2021 May 25;10(6):1316. doi: 10.3390/cells10061316. Cells. 2021. PMID: 34070547 Free PMC article.
References
-
- Keating A. Mesenchymal stromal cells: New directions. Cell Stem Cell. 2012;10(6):709–716. - PubMed
-
- Dominici M, et al. Minimal criteria for defining multipotent mesenchymal stromal cells. The International Society for Cellular Therapy position statement. Cytotherapy. 2006;8(4):315–317. - PubMed
-
- Meirelles Lda S, et al. Mechanisms involved in the therapeutic properties of mesenchymal stem cells. Cytokine Growth Factor Rev. 2009;20(5–6):419–427. - PubMed
Grants and funding
LinkOut - more resources
Full Text Sources
Other Literature Sources