. 2018 Jun 1;128(6):2519-2534.
doi: 10.1172/JCI97053. Epub 2018 May 7.

Human herpesvirus-encoded kinase induces B cell lymphomas in vivo

Affiliations

Human herpesvirus-encoded kinase induces B cell lymphomas in vivo

Penny M Anders et al. J Clin Invest. .

Abstract

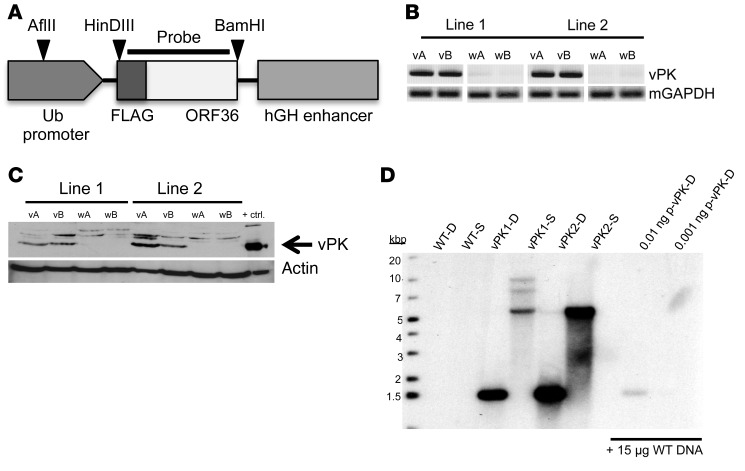
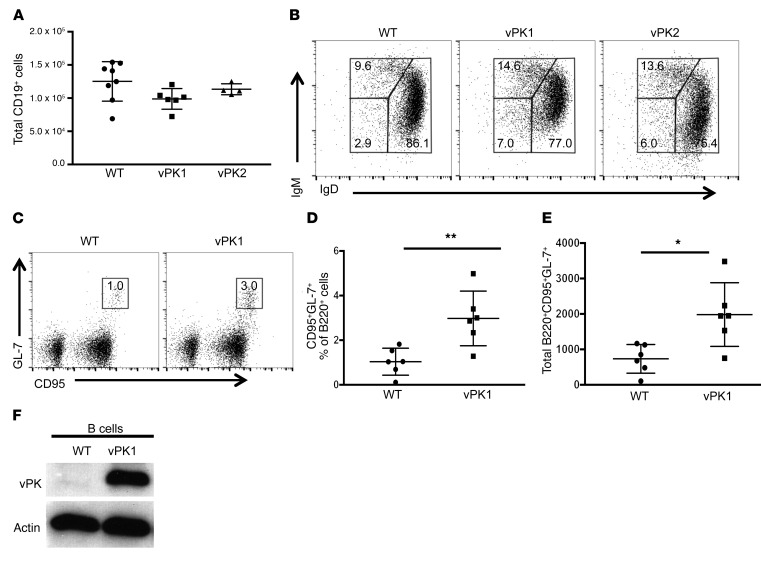
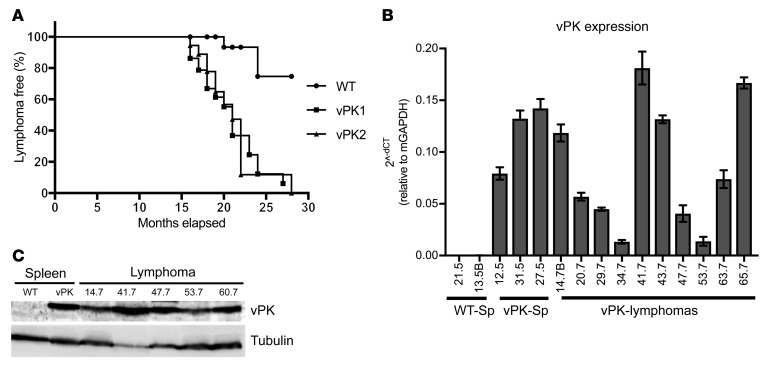
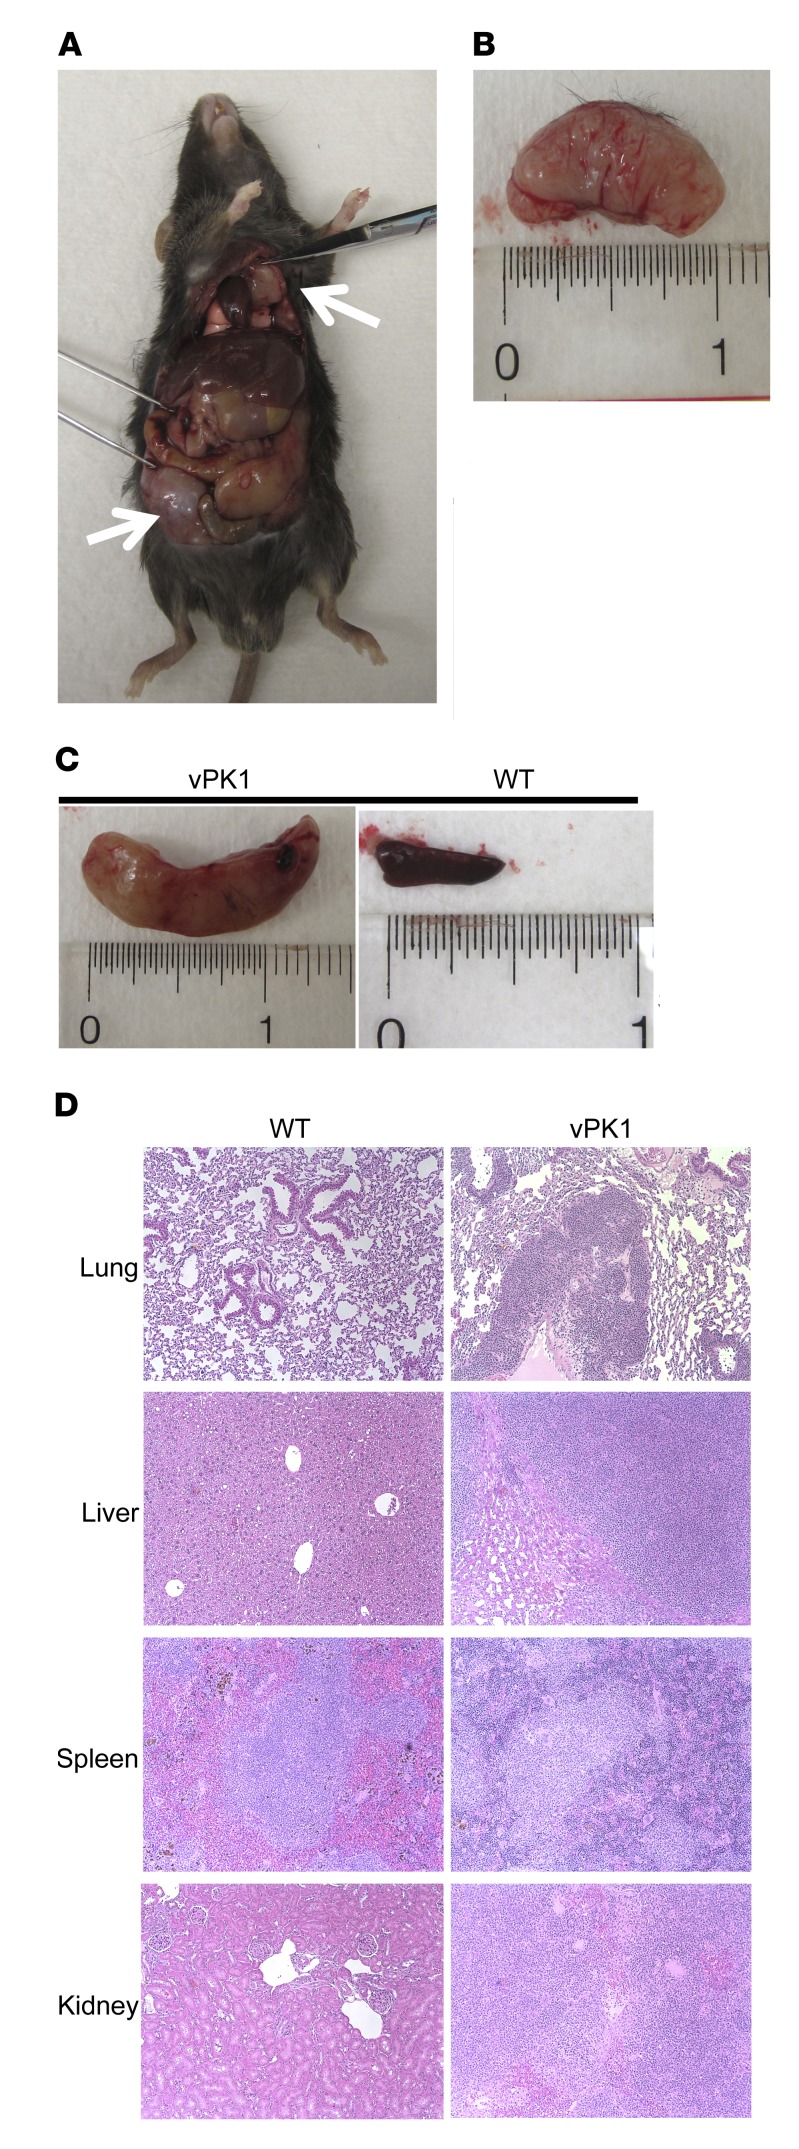
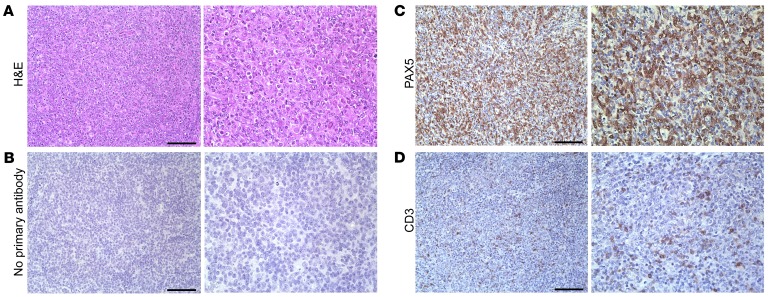
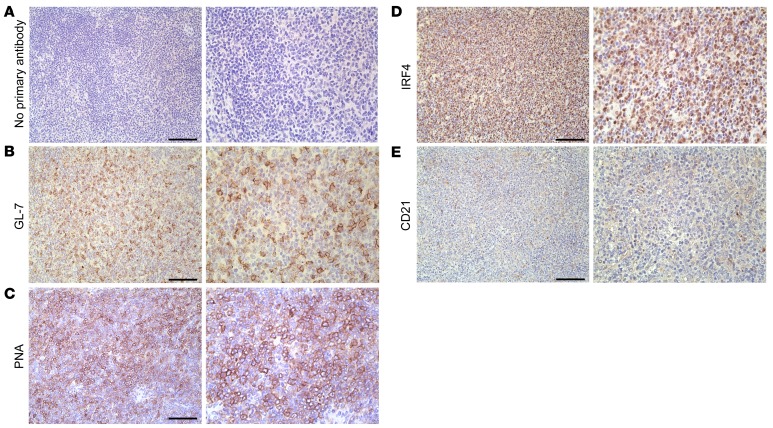
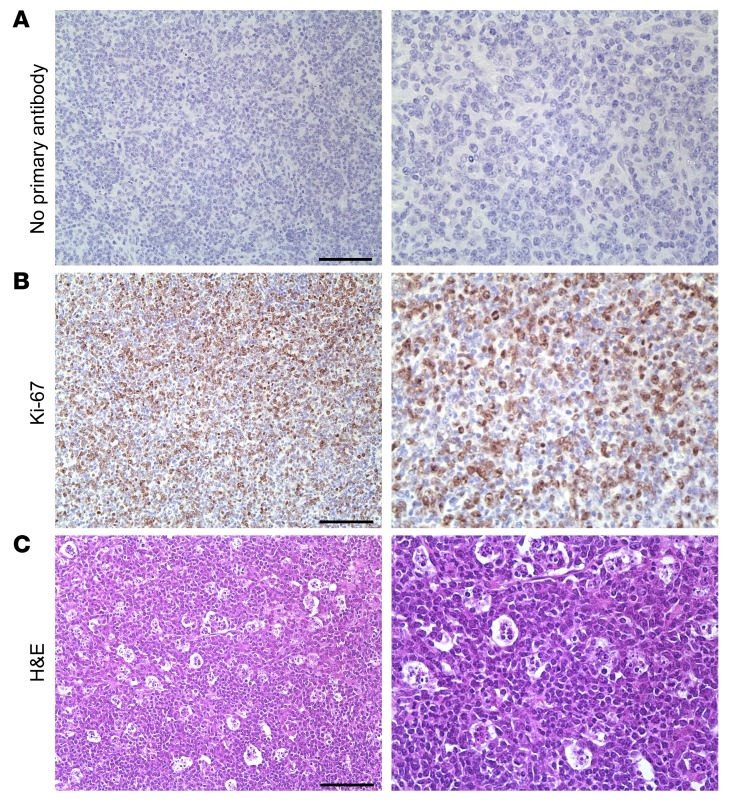
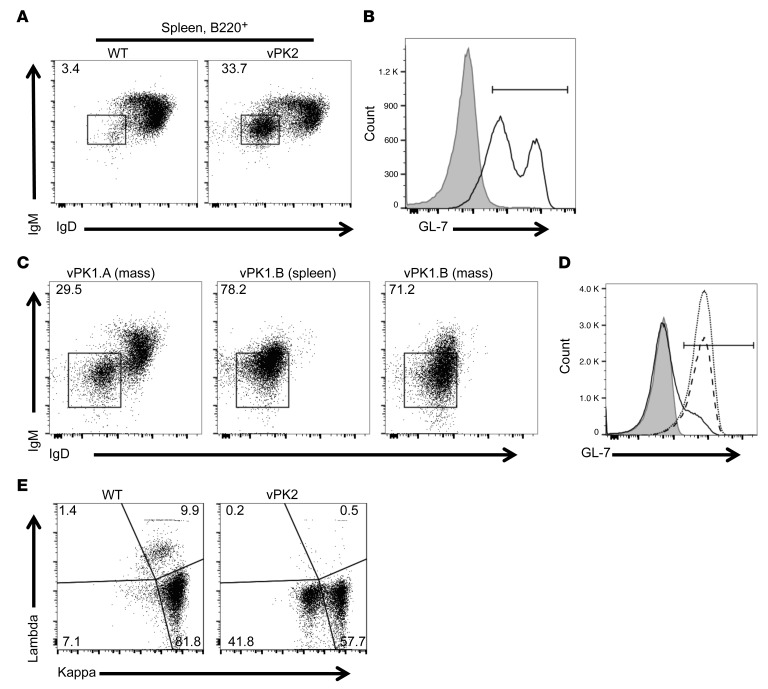
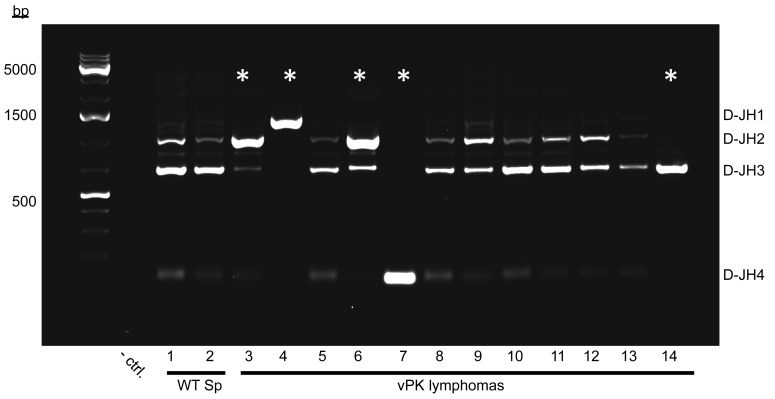
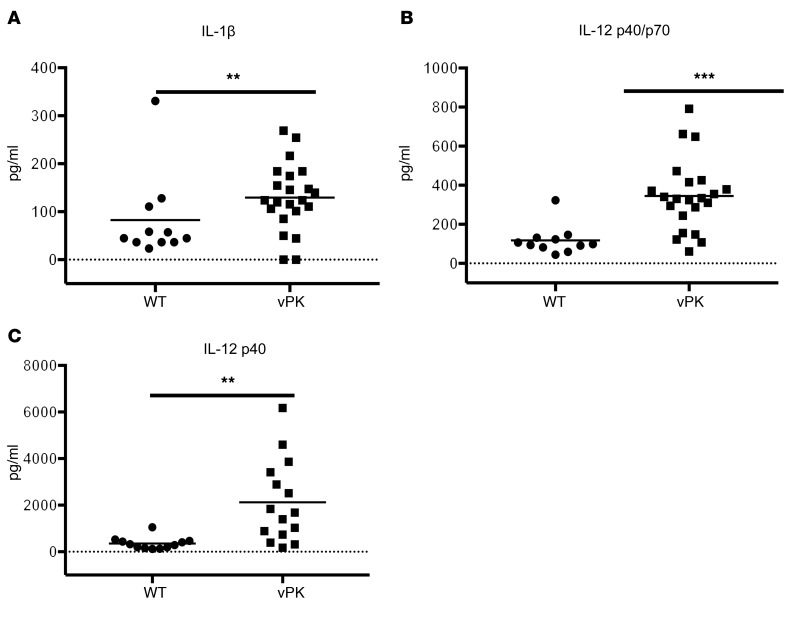
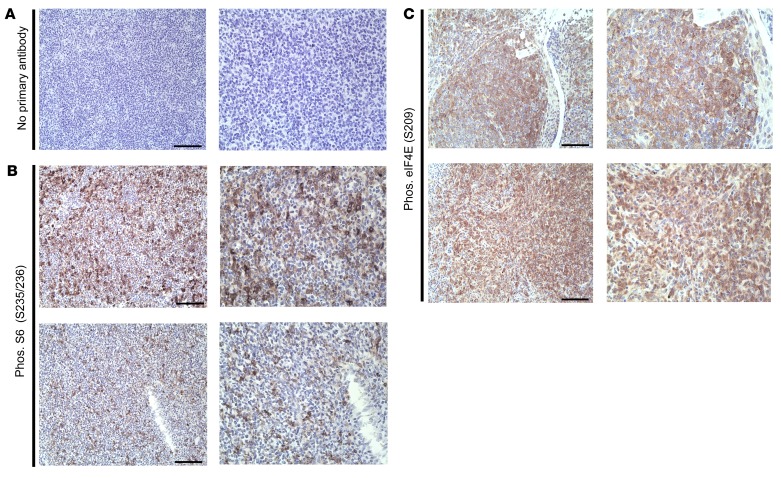
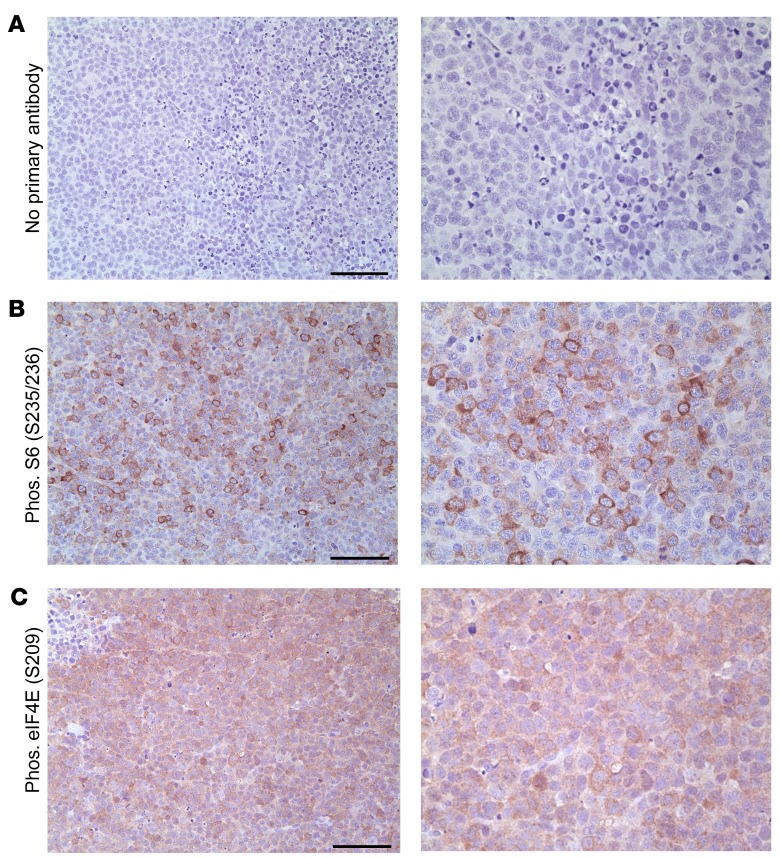
Kaposi's sarcoma-associated herpesvirus (KSHV) is a gammaherpesvirus that is the etiological agent of the endothelial cell cancer Kaposi's sarcoma (KS) and 2 B cell lymphoproliferative disorders, primary effusion lymphoma (PEL) and multicentric Castleman's disease (MCD). KSHV ORF36, also known as viral protein kinase (vPK), is a viral serine/threonine kinase. We previously reported that KSHV vPK enhances cell proliferation and mimics cellular S6 kinase to phosphorylate ribosomal protein S6, a protein involved in protein synthesis. We created a mouse model to analyze the function of vPK in vivo. We believe this is the first mouse tumor model of a viral kinase encoded by a pathogenic human virus. We observed increased B cell activation in the vPK transgenic mice compared with normal mice. We also found that, over time, vPK transgenic mice developed a B cell hyperproliferative disorder and/or a high-grade B cell non-Hodgkin lymphoma at a greatly increased incidence compared with littermate controls. This mouse model shows that a viral protein kinase is capable of promoting B cell activation and proliferation as well as augmenting lymphomagenesis in vivo and may therefore contribute to the development of viral cancers.

Keywords: Lymphomas; Oncogenes; Oncology; Virology.


Conflict of interest statement

Conflict of interest: The authors have declared that no conflict of interest exists.

Figures

Figure 1
Figure 1. Generation of vPK transgenic mice.
FLAG-tagged vPK was cloned, using HinDIII-HF and BamHI-HF, into a plasmid containing a Ub- and hGH-stabilization element. The linearized transgene fragment was microinjected into the embryos of C57BL/6 mice and implanted into pseudopregnant female mice. Each vPK line was developed from breeding a vPK founder to a C57BL/6 mouse. (A) Schematic of the linearized construct used to generate the vPK transgenic mice, as well as the cut sites and probe for the Southern blot in D. (B) DNA from the tails of 2 WT (wA and wB) and 2 vPK transgenic mice (vA and vB) for lines 1 and 2 was isolated and evaluated by PCR for the vPK transgene. (C) Expression of vPK protein in lysates from spleens of the mice in B as determined by SDS-PAGE and Western blot. Lysate from HEK-293 cells that transiently express vPK was used as a positive control for vPK expression. (D) Southern blot of WT, vPK1, and vPK2. DNA was isolated from the spleens of WT and vPK lines 1 and 2. D, double digest with HinDIII-HF and BamHI-HF; S, single digestion with AFlII; p-vPK, plasmid Ub.vPK.hGH.
Figure 2
Figure 2. vPK transgenic mice have increased class-switched and germinal center B cells compared with WT controls.
The total number and frequencies of B cells and B cell subsets from the spleens of WT, vPK1, and vPK2 mice was determined by flow cytometry. Data represent mean ± SD. (A) The total number of B cells (CD19+) in gated live splenocytes from WT, vPK1, and vPK2. These data represent 3 experiments in which n = 17 WT, n = 12 vPK1, and n = 7 vPK2. (B) Frequencies of class-switched B cells (IgMIgD) of live CD19+ splenocytes shown in A. (C) Representative figure for the gating strategy to determine the frequencies of live germinal center B cells (B220+CD95+GL-7+) in spleens. (D) Frequencies of live germinal center B cells (B220+CD95+GL-7+). n = 6 per group. (E) Total number of live germinal center B cells (B220+CD95+GL-7+). n = 6 per group. (F) Representative Western blot for vPK protein expression in enriched B cells using a vPK polyclonal antibody. n = 7 WT; n = 4 vPK. *P = 0.01; **P = 0.006, Student’s 2-tailed t test.
Figure 3
Figure 3. Aged vPK transgenic mice develop a greater incidence of lymphoma than aged WT mice, and these lymphomas express vPK.
(A) Kaplan-Meier curve showing the percentages of lymphoma-free aged vPK mice (n = 29 vPK1; n=18 vPK2) compared with lymphoma-free aged WT mice (n = 25). χ2 = 17.71 (vPK1 vs. WT); χ2 = 17.85 (vPK2 vs. WT), log-rank (Mantel-Cox) test; degree of freedom, 1. (B) vPK transcript expression in spleens (Sp) from WT and in spleens and masses (vPK-Lymphomas) from vPK transgenic mice. Each sample was normalized to murine GAPDH expression. Numbers along the x axis are labels for individual mice. Data represent mean ± SD. (C) vPK protein expression was determined by SDS-PAGE and Western blot in lysates from 5 masses. Numbers indicate individual mice.
Figure 4
Figure 4. Aged vPK transgenic mice develop lymphomas throughout the body and in multiple organs.
Mice with more than 2 lymphomas. n = 12. (A) vPK1 transgenic mouse with lymphomas at 18 months. White arrows indicate masses. (B) Abdominal mass from A. (C) Left panel shows a spleen from mouse in A. Right panel shows an 18-month-old WT mouse spleen. (D) H&E-stained sections of lung, liver, spleen, and kidney from 20-month-old WT and vPK1 transgenic mouse with lymphoma. Original magnification, ×100.
Figure 5
Figure 5. Aged vPK transgenic mouse lymphomas are composed predominantly of B cells with interspersed T cells.
(A) H&E, (B) no primary antibody, (C) PAX5, and (D) CD3. Scale bars: 100 μm. Original magnification, ×200 (left panels); ×400 (right panels). Representative of 9 stained tissues with lymphoma, including nodes, spleen, lung, and kidney.
Figure 6
Figure 6. Lymphomas from aged vPK transgenic mice are of germinal center and post–germinal center origin.
Stained tissue sections of the same mass shown in Figure 5. Representative images for (A) no primary antibody, (B) GL-7, (C) PNA, (D) IRF4, and (E) CD21. Scale bars: 100 μm. Original magnification, ×200 (left panels); ×400 (right panels). Representative of 9 stained tissues with lymphoma, including nodes, spleen, lung, and kidney.
Figure 7
Figure 7. Aged vPK transgenic mouse lymphomas have robust proliferation.
Tissue sections from the same mass shown in Figure 5. Images show (A) no primary antibody, (B) Ki-67, (C) H&E staining showing tingible body macrophages. Scale bars: 100 μm. Original magnification, ×200 (left panels); ×400 (right panels). Representative of 9 stained tissues with lymphoma, including nodes, spleen, lung, and kidney.
Figure 8
Figure 8. Increased class-switched B cells from aged vPK transgenic versus age-matched WT mice.
(A) Frequency of B220+IgMIgD cells WT spleen (3.4%) and vPK with splenic lymphoma (33.7%). (B) Frequency of B220+GL-7+ from the mice shown in A, WT (gray, 2.1%) and vPK (black line, 77.4%). (C) Frequency of B220+IgMIgD cells in a mass (vPK1.A, 29.5%), lymphoma spleen (vPK1.B, 78.2%), and mass (vPK1.B, 71.2%). n = 12 vPK. (D) Frequency of B220+GL-7+-expressing cells from the lymphomas shown in C. Gray, unstained, 0.074%; solid line, vPK1.A, 15.1%; dotted line, vPK1.B spleen, 91.7%; dashed line. vPK1.B mass, 89.7%. (E) Representative of frequency of κ/λ B220+ cells from WT spleen and vPK spleen with lymphoma (n = 9 total, 5 spleens and 4 nodes). n = 3 normal WT spleens.
Figure 9
Figure 9. Lymphomas from individual aged vPK mice are monoclonal or polyclonal.
D–JH segments of IgH in genomic DNA were PCR amplified, electrophoresed, and stained with ethidium bromide. D–JH segments of IgH in normal WT spleens (WT Sp) and vPK lymphomas. Node, mouse 3; liver, mice 4, 7, and 13; spleen, mice 6, 8–12, and 14. Asterisks indicate the preferential amplification of 1 D–JH segment. A total of 20 lymphoma tissues each from a different aged vPK mouse were evaluated. Polyclonal, n = 12; monoclonal, n = 8.
Figure 10
Figure 10. Aged vPK transgenic mice have increased inflammatory cytokines in the serum compared with age-matched WT.
The cytokine levels in the serum were determined by Luminex. Mean is represented. n = 11 WT; n = 15–22 vPK. (A) IL-1β levels, (B) IL-12 p40/p70 levels, (C) IL-12 p40 levels. Solid line indicates the mean. **P < 0.005; ***P < 0.0005, Mann-Whitney U test.
Figure 11
Figure 11. Expression of phosphorylated S6 and eIF4E in lymphomas from aged vPK transgenic mice.
(A) No primary antibody. (B) Phosphorylated S6 (S235/236). (C) Phosphorylated eIF4E (S209). Each row shows 1 mouse. Scale bars: 100 μm. Original magnification, ×200 (left panels); ×400 (right panels). Representative 2 of 9 stained tissues with lymphoma, including nodes, spleen, lung, and kidney.
Figure 12
Figure 12. Expression of phosphorylated S6 and eIF4E in mouse xenograft PEL tumors.
(A) No primary antibody, (B) phosphorylated S6 (S235/236), n = 3 (C) phosphorylated eIF4E (S209). n = 7. Scale bars: 100 μm. Original magnification, ×200 (left panels); ×400 (right panels).

Comment in

References

    1. Cesarman E, Chang Y, Moore PS, Said JW, Knowles DM. Kaposi’s sarcoma-associated herpesvirus-like DNA sequences in AIDS-related body-cavity-based lymphomas. N Engl J Med. 1995;332(18):1186–1191. doi: 10.1056/NEJM199505043321802. - DOI - PubMed
    1. Soulier J, et al. Kaposi’s sarcoma-associated herpesvirus-like DNA sequences in multicentric Castleman’s disease. Blood. 1995;86(4):1276–1280. - PubMed
    1. Gessain A, et al. Kaposi sarcoma-associated herpes-like virus (human herpesvirus type 8) DNA sequences in multicentric Castleman’s disease: is there any relevant association in non-human immunodeficiency virus-infected patients? Blood. 1996;87(1):414–416. - PubMed
    1. Chadburn A, Cesarman E, Nador RG, Liu YF, Knowles DM. Kaposi’s sarcoma-associated herpesvirus sequences in benign lymphoid proliferations not associated with human immunodeficiency virus. Cancer. 1997;80(4):788–797. doi: 10.1002/(SICI)1097-0142(19970815)80:4<788::AID-CNCR18>3.0.CO;2-P. - DOI - PubMed
    1. Chang Y, et al. Identification of herpesvirus-like DNA sequences in AIDS-associated Kaposi’s sarcoma. Science. 1994;266(5192):1865–1869. doi: 10.1126/science.7997879. - DOI - PubMed

Publication types

MeSH terms

Substances

Supplementary concepts