. 2018 Jul 6;46(12):5996-6008.
doi: 10.1093/nar/gky340.

An integrative model for alternative polyadenylation, IntMAP, delineates mTOR-modulated endoplasmic reticulum stress response

Affiliations

An integrative model for alternative polyadenylation, IntMAP, delineates mTOR-modulated endoplasmic reticulum stress response

Jae-Woong Chang et al. Nucleic Acids Res. .

Abstract

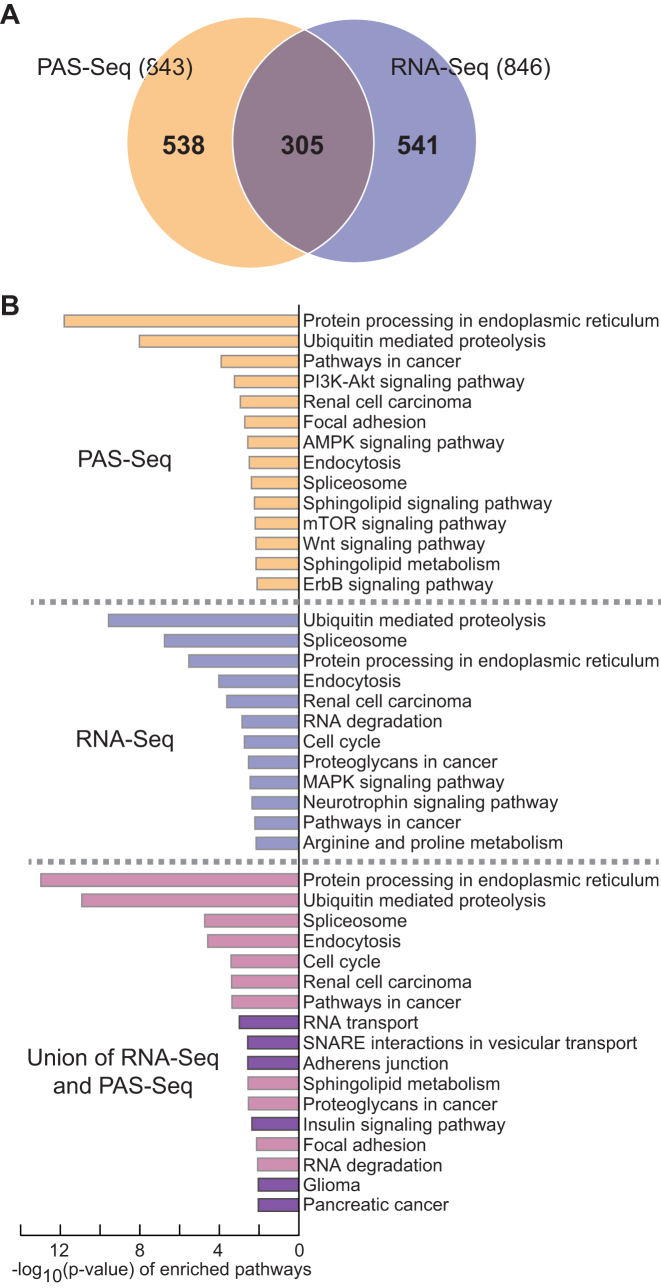
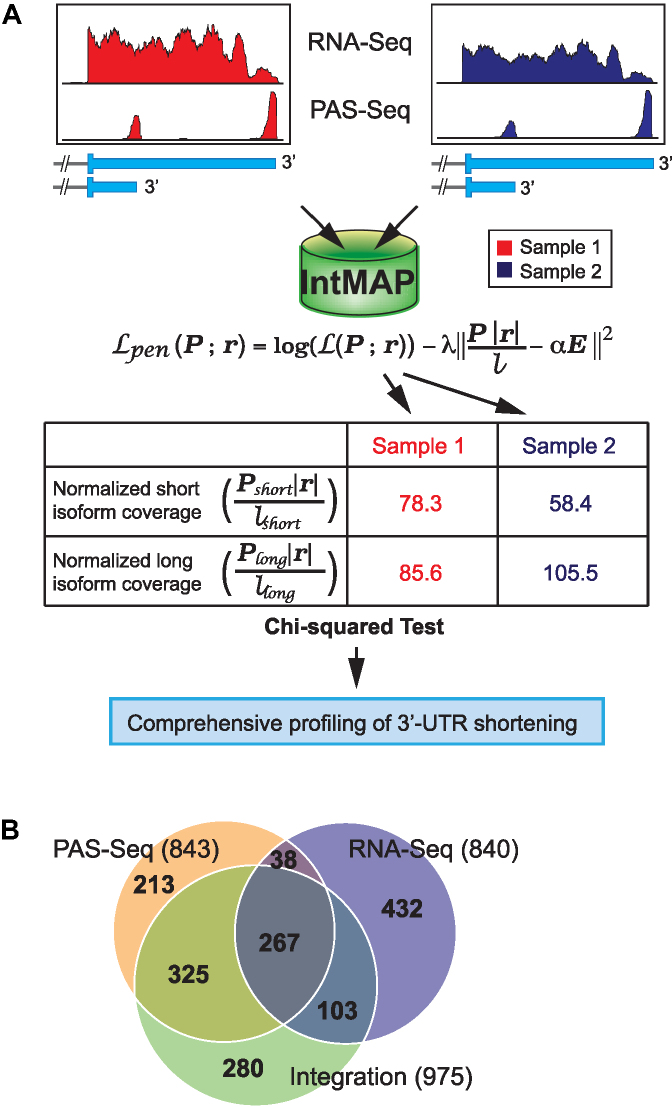
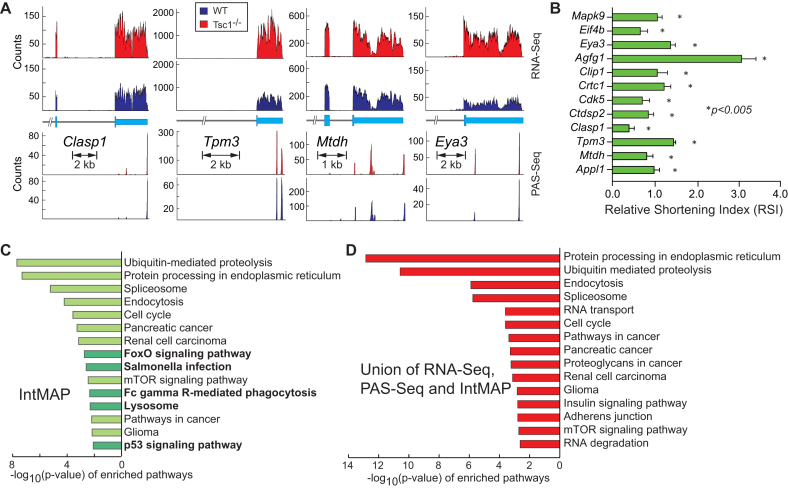
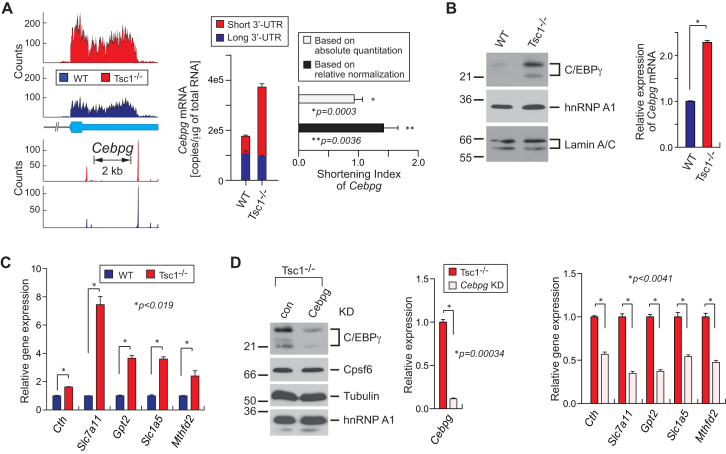
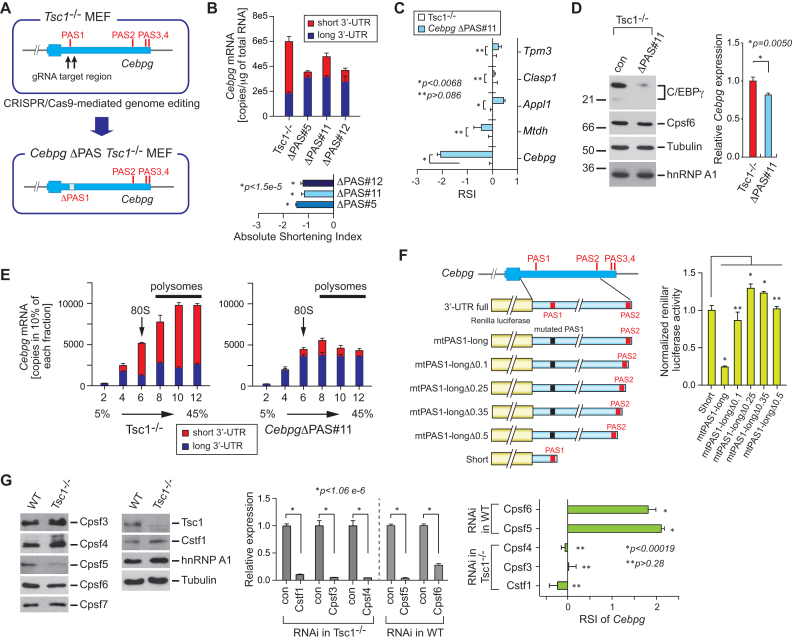
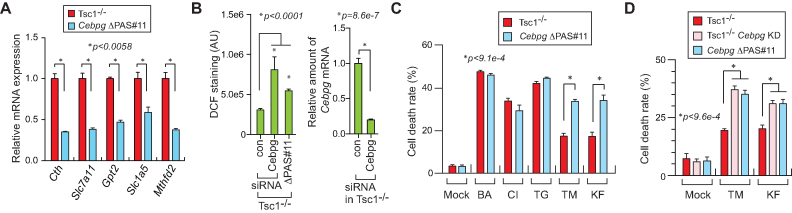
3'-untranslated regions (UTRs) can vary through the use of alternative polyadenylation sites during pre-mRNA processing. Multiple publically available pipelines combining high profiling technologies and bioinformatics tools have been developed to catalog changes in 3'-UTR lengths. In our recent RNA-seq experiments using cells with hyper-activated mammalian target of rapamycin (mTOR), we found that cellular mTOR activation leads to transcriptome-wide alternative polyadenylation (APA), resulting in the activation of multiple cellular pathways. Here, we developed a novel bioinformatics algorithm, IntMAP, which integrates RNA-Seq and PolyA Site (PAS)-Seq data for a comprehensive characterization of APA events. By applying IntMAP to the datasets from cells with hyper-activated mTOR, we identified novel APA events that could otherwise not be identified by either profiling method alone. Several transcription factors including Cebpg (CCAAT/enhancer binding protein gamma) were among the newly discovered APA transcripts, indicating that diverse transcriptional networks may be regulated by mTOR-coordinated APA. The prevention of APA in Cebpg using the CRISPR/cas9-mediated genome editing tool showed that mTOR-driven 3'-UTR shortening in Cebpg is critical in protecting cells from endoplasmic reticulum (ER) stress. Taken together, we present IntMAP as a new bioinformatics algorithm for APA analysis by which we expand our understanding of the physiological role of mTOR-coordinated APA events to ER stress response. IntMAP toolbox is available at http://compbio.cs.umn.edu/IntMAP/.


Figures

Figure 1.
Figure 1.
Profiling of 3′-UTR APA events in the mTOR-activated transcriptome using Poly(A) Site sequencing (PAS-Seq). (A) A Venn diagram of 3′-UTR shortened transcripts in Tsc1−/− MEFs using two independent profiling methods. (B) KEGG pathway analysis of 3′-UTR shortened transcripts identified by PAS-Seq, RNA-Seq and the union of the two methods. The KEGG pathways only enriched after combining two profiling methods are highlighted in dark violet.
Figure 2.
Figure 2.
Development of a novel algorithm IntMAP by integrating RNA-Seq and PAS-Seq dataset. (A) A schematic of the experimental workflow and algorithm to integrate RNA-Seq and PAS-Seq data. An algorithm integrating two datasets was developed for comprehensive profiling of 3′-UTR APA events. (B) A Venn diagram of 3′-UTR shortened transcripts in Tsc1−/− MEFs using IntMAP. The number of genes producing 3′-UTR shortened transcripts in each section of Venn diagram is indicated.
Figure 3.
Figure 3.
Identification of novel 3′-UTR APA events by IntMAP. (A) Examples of RNA-Seq and PAS-Seq alignments for genes showing 3′-UTR APA events identified by IntMAP. Read alignments of the 3′-most exon or last two exons of RNA- and PAS-Seq are shown. The orientation of genes is presented from 5′ (left) to 3′ (right). (B) The relative shortening index (RSI) of genes based on the comparison between WT and Tsc1−/− MEFs was measured using qPCR to validate the analysis done by IntMAP. qPCR results are from four technical replicates. Data represent the mean ± SEM. Two-tailed student t-tests were performed for statistical significance. (C) KEGG pathway analysis using 975 genes identified by IntMAP is shown. The KEGG pathways only enriched in IntMAP analysis are highlighted in dark green. (D) KEGG pathway analysis of 3′-UTR APA events in the union of RNA-Seq, PAS-Seq and IntMAP analyses is shown. The complete list of KEGG pathways is shown in Supplementary Figure S2.
Figure 4.
Figure 4.
mTOR-coordinated cellular stress response network identified by IntMAP. (A) RNA- and PAS-Seq read alignments of Cebpg are shown. An absolute quantitation of long 3′-UTR and total (long+short 3′-UTR) Cebpg mRNAs was made using qPCR. The amounts of short versus long 3′-UTR transcripts are presented by copies/μg of total RNAs. The shortening index of Cebpg in the Tsc1−/− transcriptome was calculated based on absolute or normalized quantitation. qPCR results are from 4 technical replicates. Data represent the mean ± SEM. Two-tailed Student's t-tests were performed for statistical significance. (B) Western blotting for Cebpg, hnRNP A1 and Lamin A/C using WT and Tsc1−/− cell extracts. Relative amounts of Cebpg mRNA were measured by qPCR. qPCR results are from four technical replicates. Data represent the mean ± SEM. Two-tailed student t-tests were performed for statistical significance. *P = 7.97e–007. (C) Relative gene expression of Cebpg target genes in WT and Tsc1−/− MEFs was measured using qPCR. qPCR results are from 4 technical replicates. Data represent the mean ± SEM. Two-tailed Student's t-tests were performed for statistical significance. (D) RNAi knockdown (KD) of Cebpg in Tsc1−/− MEFs and the analysis of Cebpg target genes. Western blotting was conducted for Cebpg, Cpsf6, Tubulin, and hnRNP A1 using con or Cebpg KD Tsc1−/− cell extracts. Relative amounts of Cebpg mRNA in the KD cells compared to control cells were measured using qPCR. Expression of Cebpg target genes in the KD and control cells were quantitated using qPCR. qPCR results are from four technical replicates. Data represent the mean ± SEM. Two-tailed Student's t-tests were performed for statistical significance.
Figure 5.
Figure 5.
A regulatory role of 3′-UTR APA in Cebpg gene expression. (A) Schematic of proximal PAS knockout (KO) in Tsc1−/− MEFs. Using the CRISPR/Cas9-mediated genome editing tool, two juxtaposed proximal PASs in the 3′-UTR of Cebpg were deleted and CebpgΔPAS Tsc1−/− MEFs were established. (B) An absolute quantitation of total Cebpg mRNAs and Cebpg mRNA with long 3′-UTR was measured and presented by copies/μg total RNAs. The quantitation was made using three CebpgΔPAS Tsc1−/− MEF clones (#5, #11 and #12). The shortening index of Cebpg in these clones was calculated based on the absolute quantitation. qPCR results are from four technical replicates. Data represent the mean ± SEM. Two-tailed Student's t-tests were performed for statistical significance. (C) The RSI of selected genes in CebpgΔPAS#11 Tsc1−/− MEFs compared to control Tsc1−/− MEFs was measured using qPCR. qPCR results are from four technical replicates. Data represent the mean ± SEM. Two-tailed Student's t-tests were performed for statistical significance. (D) CebpgΔPAS Tsc1−/− MEFs were characterized using western blotting. Expression of C/EBPγ, Cpsf6, Tubulin and hnRNP A1 protein was analyzed using total cell extracts from CebpgΔPAS and control Tsc1−/− MEFs. qPCR using the same set of cell lines was performed to measure the relative level of Cebpg mRNA. qPCR results are from 4 technical replicates. Data represent the mean ± SEM. Two-tailed Student's t-tests were performed for statistical significance. (E) Total and long 3′-UTR Cebpg mRNAs were analyzed using polysome profiling. Cytoplasmic extracts from Tsc1−/− and CebpgΔPAS Tsc1−/− MEFs were fractionated by 5–45% sucrose gradients. Percentage of total and long 3′-UTR Cebpg mRNAs was calculated in each fraction using qPCR. 80S monosome and polysomes in the fractionation were indicated. qPCR results are from four technical replicates. Data represent the mean ± SEM. (F) A serial deletion of the Cebpg 3′-UTR was tested for the regulation of Renilla luciferase expression. 100 (Δ0.1), 250 (Δ0.25), 350 (Δ0.35) and 500 (Δ0.5) nucleotide deletion constructs were tested. Renilla luciferase activity was normalized to firefly luciferase activity which was used as a transfection control. The assay was conducted four technical replicates. Three independent experiments showed similar results. One representative result is shown. Data represent the mean ± SEM. Two-tailed Student's t-tests were performed for statistical significance. P-values were obtained by comparing Short versus each deletion construct. *P < 0.00054. **P > 0.05. (G) Western blot analysis of multiple polyadenylation factors using WT and Tsc1−/− MEFs extracts is shown (left panel). RNAi-mediated knockdown of polyadenylation factors in WT MEFs were conducted (middle panel). The knockdown effect of those polyadenylation factors on the RSI was measured by qRT-PCR (right panel).
Figure 6.
Figure 6.
ER stress response network modulated by Cebpg 3′-UTR APA events. (A) Analysis of Cebpg target gene expression in CebpgΔPAS#11 Tsc1−/− MEFs compared to control Tsc1−/− MEFs was carried out using qPCR. qPCR results are from 4 technical replicates. Data represent the mean ± SEM. Two-tailed Student's t-tests were performed for statistical significance. (B) DCF staining (2′,7′-dichlorofluorescein) was conducted to measure the level of ROS in Tsc1−/− MEFs with control or Cebpg RNAi KD and CebpgΔPAS#11 Tsc1−/− MEFs (left panel). Relative amount of Cebpg mRNAs in control or Cebpg RNAi KD is shown (right panel). (C) Cellular response of CebpgΔPAS and control Tsc1−/− MEFs to ER stress-inducing drugs. CebpgΔPAS and control Tsc1−/− MEFs were treated with Brefeldin A (BA; 5 μg/ml), Calcium ionophore A23187 (CI; 2 μM), Thapsigargin (TG; 1 μM), Tunicamycin (TM; 1 μM), or Kifunensine (KF; 50 μg/ml) for 24 h. Cell death rate was measured using Trypan Blue staining followed by cell counting. The data are from three biological repeats in which each repeat contains 4 technical replicates. Data represent the mean ± SEM. Two-tailed Student's t-tests were performed for statistical significance. (D) Cellular response of CebpgΔPAS, Cebpg KD and control Tsc1−/− MEFs to ER stress-inducing drugs. Cells were treated with Tunicamycin (TM) or Kifunensine (KF) and cell death rate was measured as described in (A). The data are from three biological repeats in which each repeat contains four technical replicates. Data represent the mean ± SEM. Two-tailed Student's t-tests were performed for statistical significance.

References

    1. Darnell J.E. Reflections on the history of pre-mRNA processing and highlights of current knowledge: a unified picture. RNA. 2013; 19:443–460. - PMC - PubMed
    1. Bentley D.L. Coupling mRNA processing with transcription in time and space. Nat. Rev. Genet. 2014; 15:163–175. - PMC - PubMed
    1. Manley J.L. Polyadenylation of mRNA precursors. BBA - Gene Struct. Expr. 1988; 950:1–12. - PubMed
    1. Tian B., Manley J.L.. Alternative cleavage and polyadenylation: the long and short of it. Trends Biochem. Sci. 2013; 38:312–320. - PMC - PubMed
    1. Yeh H.-S., Yong J.. Alternative polyadenylation of mRNAs: 3′-Untranslated region matters in gene expression. Mol. Cells. 2016; 39:281–285. - PMC - PubMed

Publication types

Substances