. 2018 May 7;48(3):571-589.
doi: 10.1002/jmri.26171. Online ahead of print.

Pseudoprogression of brain tumors

Affiliations

Pseudoprogression of brain tumors

Stefanie C Thust et al. J Magn Reson Imaging. .

Abstract

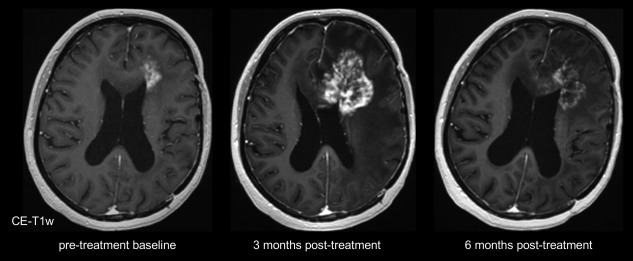
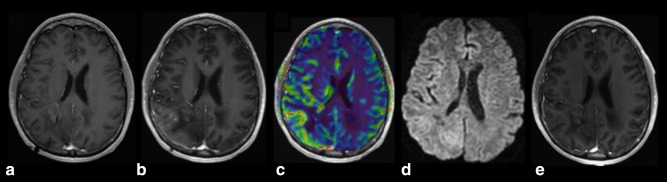
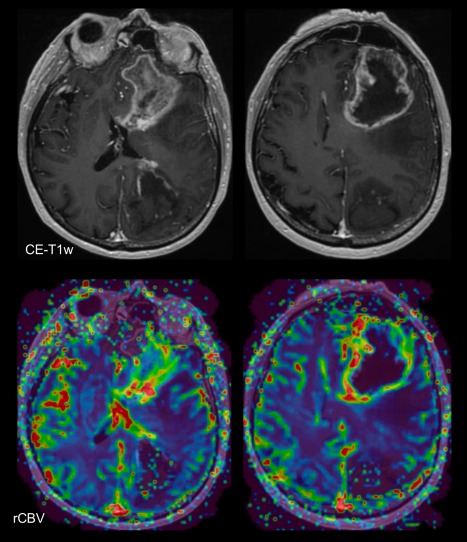
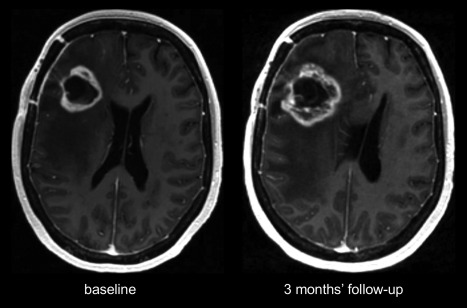
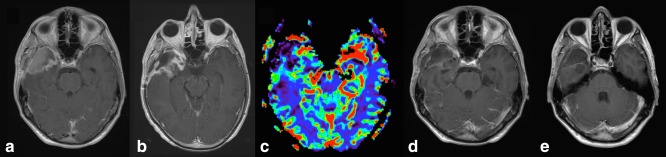
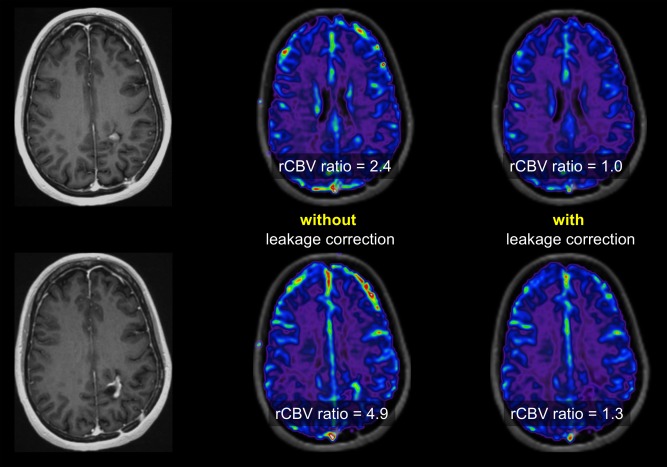
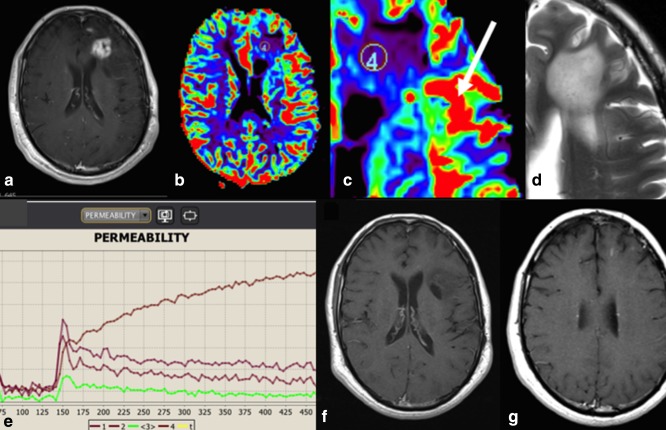
This review describes the definition, incidence, clinical implications, and magnetic resonance imaging (MRI) findings of pseudoprogression of brain tumors, in particular, but not limited to, high-grade glioma. Pseudoprogression is an important clinical problem after brain tumor treatment, interfering not only with day-to-day patient care but also the execution and interpretation of clinical trials. Radiologically, pseudoprogression is defined as a new or enlarging area(s) of contrast agent enhancement, in the absence of true tumor growth, which subsides or stabilizes without a change in therapy. The clinical definitions of pseudoprogression have been quite variable, which may explain some of the differences in reported incidences, which range from 9-30%. Conventional structural MRI is insufficient for distinguishing pseudoprogression from true progressive disease, and advanced imaging is needed to obtain higher levels of diagnostic certainty. Perfusion MRI is the most widely used imaging technique to diagnose pseudoprogression and has high reported diagnostic accuracy. Diagnostic performance of MR spectroscopy (MRS) appears to be somewhat higher, but MRS is less suitable for the routine and universal application in brain tumor follow-up. The combination of MRS and diffusion-weighted imaging and/or perfusion MRI seems to be particularly powerful, with diagnostic accuracy reaching up to or even greater than 90%. While diagnostic performance can be high with appropriate implementation and interpretation, even a combination of techniques, however, does not provide 100% accuracy. It should also be noted that most studies to date are small, heterogeneous, and retrospective in nature. Future improvements in diagnostic accuracy can be expected with harmonization of acquisition and postprocessing, quantitative MRI and computer-aided diagnostic technology, and meticulous evaluation with clinical and pathological data.

Level of evidence: 3 Technical Efficacy: Stage 2 J. Magn. Reson. Imaging 2018.

Keywords: MRI; brain neoplasms; diffusion; glioma; magnetic resonance imaging; perfusion weighted; proton magnetic resonance spectroscopy.


Figures

Figure 1
Figure 1
Serial contrast‐enhanced (CE) T1‐weighted (T1w) imaging showing increase 3 months and spontaneous decrease 6 months after combined radiotherapy and temozolomide of contrast‐enhancement, edema, and mass effect.
Figure 2
Figure 2
Serial postcontrast T1‐weighted imaging of a 34‐year‐old male patient with dural metastasis from melanoma, treated with pembrolizumab. Treatment was continued despite initial increase of the lesion, which eventually responded. This patient also exhibited extracranial immune response to the treatment. Images courtesy of Drs. M. Jasperse and H. van Thienen at the Netherlands Cancer Institute, Amsterdam (NL).
Figure 3
Figure 3
Postcontrast T1‐weighted images of a 41‐year‐old male patient 3 years after radiotherapy for low‐grade glioma. Compared with (A) there is an increase in—predominantly cortical—enhancement (B). Note that there is also increased rCBV (C) and no diffusion abnormalities (D). Follow‐up imaging after 2 months (E) demonstrates spontaneous resolution of findings, consistent with SMART syndrome.
Figure 4
Figure 4
iRANO diagnostic algorithm for progressive imaging findings in brain tumor immunotherapy recipients (adapted from Ref. 30).
Figure 5
Figure 5
MRI features of histopathologically proven glioblastoma: Contrast‐enhanced (CE) T1‐weighted (T1w) sequences shows an enhancing lesion in the left frontal lobe, with areas of central necrosis. There is increased rCBV (green/red) in the enhancing tumor portions. Note there also hemorrhage in the left parieto‐occipital region.
Figure 6
Figure 6
Histopathologically confirmed pseudoprogression, where postcontrast T1‐weighted images show a “swiss cheese” or “soap bubble” increase of the margin of the lesion in the right frontal lobe.
Figure 7
Figure 7
Postcontrast T1‐weighted images and rCBV map (C) demonstrating glioblastoma resection cavity containing blood with early postoperative rim enhancement (A), followed by pseudoprogression 2 months later (B,C) and spontaneous lesion resolution (D,E) over the course of 3 further months.
Figure 8
Figure 8
Postcontrast T1‐weighted images of the same patient showing an enhancing lesion that remained stable over 1 year follow‐up. DSC imaging was acquired with a preload bolus and rCBV maps were calculated. Without leakage correction, rCBV ratios are high; with leakage correction, rCBV ratios are low and more consistent with the clinically observed stable disease than active tumor tissue.
Figure 9
Figure 9
Postcontrast images (A), DSC‐rCBV maps (B,C), T2w image (D) and DCE signal intensity curves (E) showing coexisting radiation necrosis (region of interest 4, type 1 curve showing progressive enhancement) and tumor (arrow, type 3 curve showing rapid washout) in a patient with anaplastic astrocytoma 2.5 years following radiotherapy. This was followed by spontaneous enhancing lesion resolution (F,G).
Figure 10
Figure 10
Postcontrast T1‐weighted images show an enhancing lesion (arrow) in the left temporal lobe of a patient treated for recurrent glioblastoma. Images obtained 80 minutes postinjection show retention of the contrast agent, resulting in dark signal on the subtraction image, suggestive of nontumoral tissue. One year follow‐up shows spontaneous near complete lesion resolution.
Figure 11
Figure 11
Postcontrast T1‐weighted image (A), DSC derived rCBV (B), and ASL derived CBF (C) maps showing no perfusion abnormality in contrast enhancing radiation necrosis.
Figure 12
Figure 12
Postcontrast T1‐weighted images, DSC perfusion rCBV maps and MRS of radiation necrosis (A–C, MRS with short TE = 30 msec) versus glioblastoma (D–F, MRS with intermediate TE = 144 msec).

References

    1. Koshy M, Villano JL, Dolecek TA, et al. Improved survival time trends for glioblastoma using the SEER 17 population‐based registries. J Neurooncol 2012;107:207–212. - PMC - PubMed
    1. Stupp R, Hegi ME, Mason WP, et al. Effects of radiotherapy with concomitant and adjuvant temozolomide versus radiotherapy alone on survival in glioblastoma in a randomised phase III study: 5‐year analysis of the EORTC‐NCIC trial. Lancet Oncol 2009;10:459–466. - PubMed
    1. de Wit MCY, de Bruin HG, Eijkenboom W, Sillevis Smitt PAE, van den Bent MJ. Immediate post‐radiotherapy changes in malignant glioma can mimic tumor progression. Neurology 2004;63:535–537. - PubMed
    1. Chamberlain MC, Glantz MJ, Chalmers L, Van Horn A, Sloan AE. Early necrosis following concurrent Temodar and radiotherapy in patients with glioblastoma. J Neurooncol 2007;82:81–83. - PubMed
    1. Ruben JD, Dally M, Bailey M, Smith R, McLean CA, Fedele P. Cerebral radiation necrosis: incidence, outcomes, and risk factors with emphasis on radiation parameters and chemotherapy. Int J Radiat Oncol Biol Phys 2006;65:499–508. - PubMed

LinkOut - more resources