. 2018 Jun 1;17(6):2226-2236.
doi: 10.1021/acs.jproteome.8b00217. Epub 2018 May 16.

Streamlined Tandem Mass Tag (SL-TMT) Protocol: An Efficient Strategy for Quantitative (Phospho)proteome Profiling Using Tandem Mass Tag-Synchronous Precursor Selection-MS3

Affiliations

Streamlined Tandem Mass Tag (SL-TMT) Protocol: An Efficient Strategy for Quantitative (Phospho)proteome Profiling Using Tandem Mass Tag-Synchronous Precursor Selection-MS3

José Navarrete-Perea et al. J Proteome Res. .

Abstract

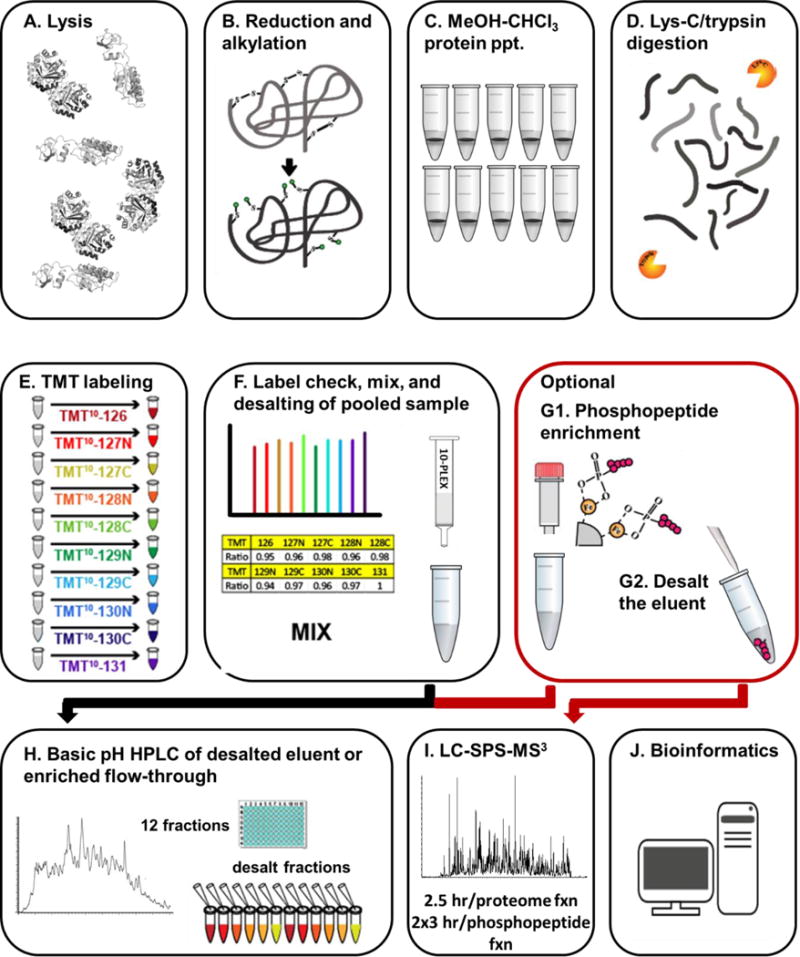
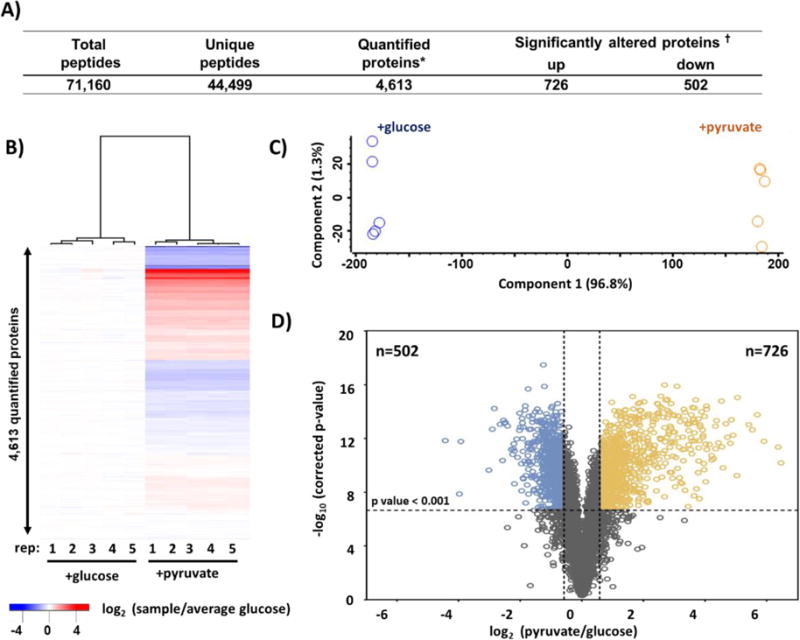
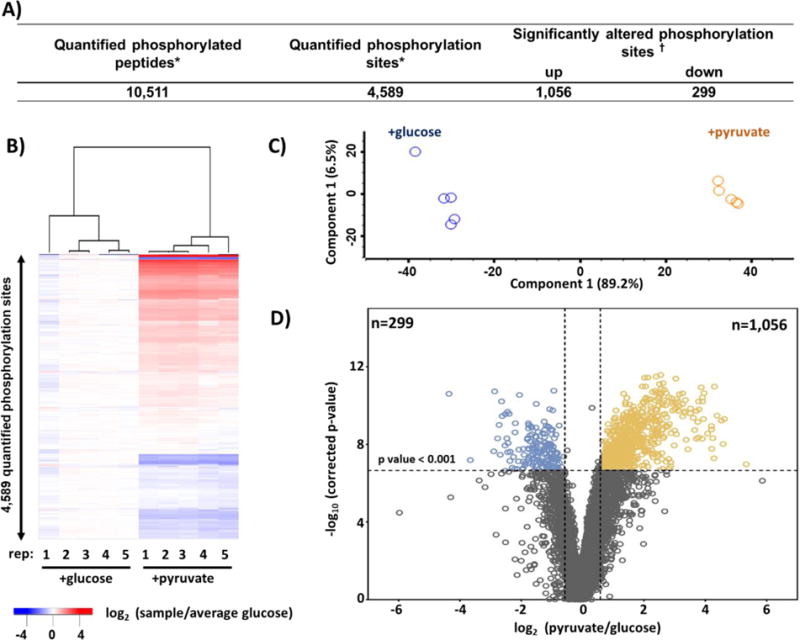
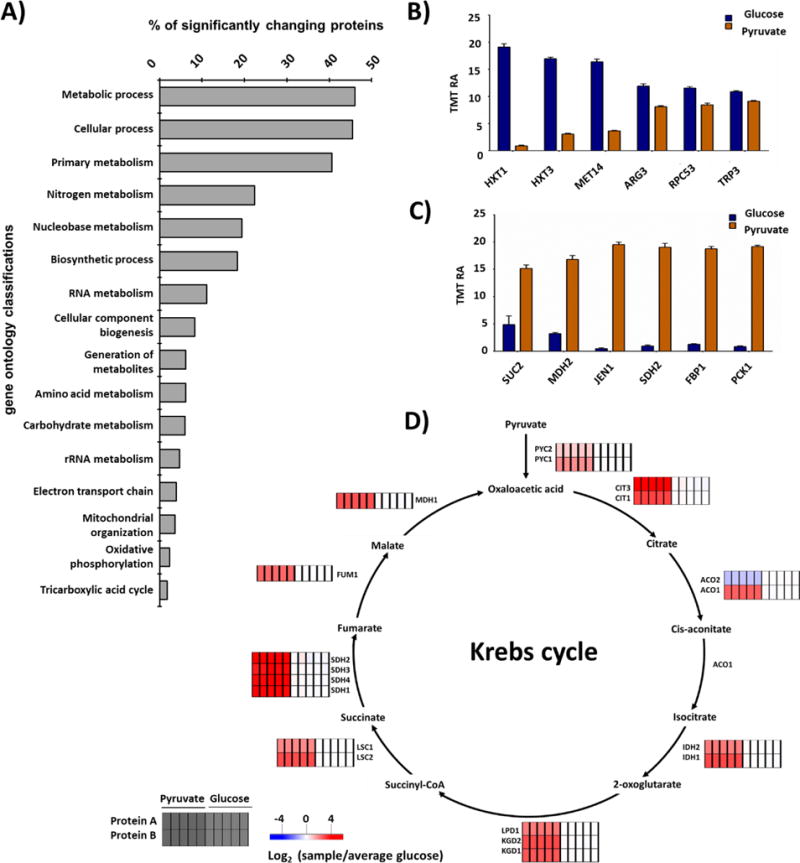
Mass spectrometry (MS) coupled toisobaric labeling has developed rapidly into a powerful strategy for high-throughput protein quantification. Sample multiplexing and exceptional sensitivity allow for the quantification of tens of thousands of peptides and, by inference, thousands of proteins from multiple samples in a single MS experiment. Accurate quantification demands a consistent and robust sample-preparation strategy. Here, we present a detailed workflow for SPS-MS3-based quantitative abundance profiling of tandem mass tag (TMT)-labeled proteins and phosphopeptides that we have named the streamlined (SL)-TMT protocol. We describe a universally applicable strategy that requires minimal individual sample processing and permits the seamless addition of a phosphopeptide enrichment step ("mini-phos") with little deviation from the deep proteome analysis. To showcase our workflow, we profile the proteome of wild-type Saccharomyces cerevisiae yeast grown with either glucose or pyruvate as the carbon source. Here, we have established a streamlined TMT protocol that enables deep proteome and medium-scale phosphoproteome analysis.

Keywords: Orbitrap Fusion Lumos; SPS; multi-notch; phosphoproteome; sample preparation; synchronous precursor selection; tandem mass tag.


Conflict of interest statement

CONFLICT OF INTEREST DISCLOSURE

The authors declare no competing financial interest.

Figures

Figure 1
Figure 1. General TMT protocol overview
A) Cells were lysed after which B) cysteine bonds were reduced and alkylated. C) Methanol-chloroform precipitation was performed to extract proteins which were D) digested using Lys-C followed by trypsin. E) The resulting peptides were labeled with TMT and F) a “label check” ensured that samples will be mixed 1:1 across all channels and a single desalting step is performed. G) Optionally, the dried, mixed, desalted sample was subjected to centrifugation-based phosphopeptide enrichment and desalted for SPS-M3 analysis. The flow-through from this enrichment was desalted and H) fractionated by basic pH reversed-phase (BPRP) HPLC. The fractions were desalted by StageTip and I) analyzed by SPS-MS3. J) Database searching, and reporter ion quantification was performed. In addition, bioinformatics analysis extracted meaningful biological information from the protein and phosphopeptide data.
Figure 2
Figure 2. Summary of deep proteome data set
A) Table of quantified proteins in this data set. B) Heatmap of hierarchical clustering and B) PCA (principal components analysis) of the replicate samples in the TMT10-plex that plots principal component 1 versus principal component 2. C) Volcano plot displaying the −log10 (p – value) versus log2 (average pyruvate/average glucose) for all quantified proteins. * Quantified across all 10 channels. † Benjamini-Hochberg-corrected p-value<0.001 and a fold change beyond ± 1.75.
Figure 3
Figure 3. Summary of medium-scale phosphoproteomics data set
A) Table of quantified phosphopeptides in this data set. B) Heatmap of hierarchical clustering and C) PCA (principal components analysis) of the replicate samples in the TMT10-plex that plots principal component 1 versus principal component 2. D) Volcano plot displaying the −log10 (p – value) versus log2 (average pyruvate/average glucose) for all quantified phosphopeptides. * Quantified across all 10 channels. † Benjamini-Hochberg-corrected p-value<0.001 and a fold change beyond ± 1.75.
Figure 4
Figure 4. Examples of phosphorylation sites and associated protein levels
Phosphorylation site profiles (bars) were overlaid on its associated protein profiles (circles) showing phosphorylation event profile for yeast culture with glucose (purple) and pyruvate (orange) as the carbon source. We provide examples of the protein and phosphorylation site relative abundance profiles for: A) - C) NUP159, D) - F) DCP2, G) - I) RGA1, J) PCK1, and K) DDR48. TMT RA, tandem mass tag relative abundance.
Figure 5
Figure 5. Bioinformatics data analysis
A) Gene ontology enrichment categories for all quantified proteins showing significant difference in protein abundance in this data set. The S. cerevisiae genome is used as the background. Canonical B) down- and C) up-regulated proteins in response to pyruvate versus glucose as the carbon source. Bars represent mean ± S.E.M, n=5. D) Krebs Cycle diagram showing the relative abundance of associated enzymes. S.E.M., standard error of the mean.

References

    1. Aebersold R, Mann M. Mass spectrometry-based proteomics. Nature. 2003;422(6928):198–207. - PubMed
    1. Rauniyar N, Yates JR., 3rd Isobaric labeling-based relative quantification in shotgun proteomics. J Proteome Res. 2014;13(12):5293–309. - PMC - PubMed
    1. Thompson A, Schafer J, Kuhn K, Kienle S, Schwarz J, Schmidt G, Neumann T, Johnstone R, Mohammed AK, Hamon C. Tandem mass tags: a novel quantification strategy for comparative analysis of complex protein mixtures by MS/MS. Anal Chem. 2003;75(8):1895–904. - PubMed
    1. Ting L, Rad R, Gygi SP, Haas W. MS3 eliminates ratio distortion in isobaric multiplexed quantitative proteomics. Nat Methods. 2011;8(11):937–40. - PMC - PubMed
    1. McAlister GC, Nusinow DP, Jedrychowski MP, Wuhr M, Huttlin EL, Erickson BK, Rad R, Haas W, Gygi SP. MultiNotch MS3 enables accurate, sensitive, and multiplexed detection of differential expression across cancer cell line proteomes. Anal Chem. 2014;86(14):7150–8. - PMC - PubMed

Publication types

MeSH terms

LinkOut - more resources