. 2018 May 29;115(22):5786-5791.
doi: 10.1073/pnas.1800367115. Epub 2018 May 7.

Long-distance electron transport in individual, living cable bacteria

Affiliations

Long-distance electron transport in individual, living cable bacteria

Jesper T Bjerg et al. Proc Natl Acad Sci U S A. .

Abstract

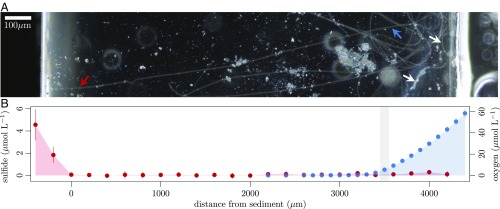
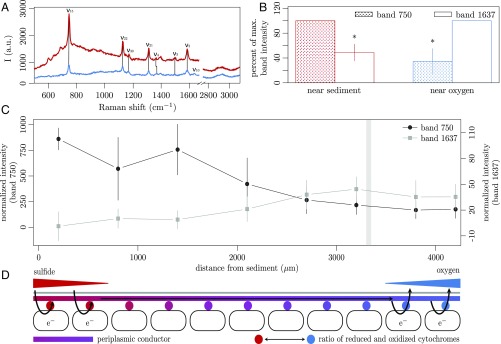
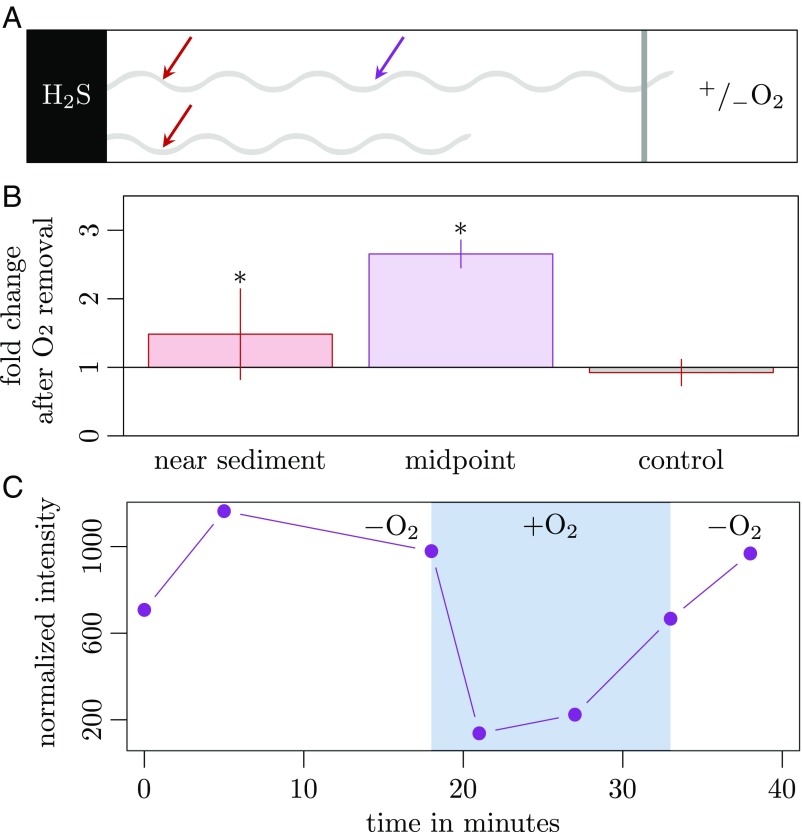
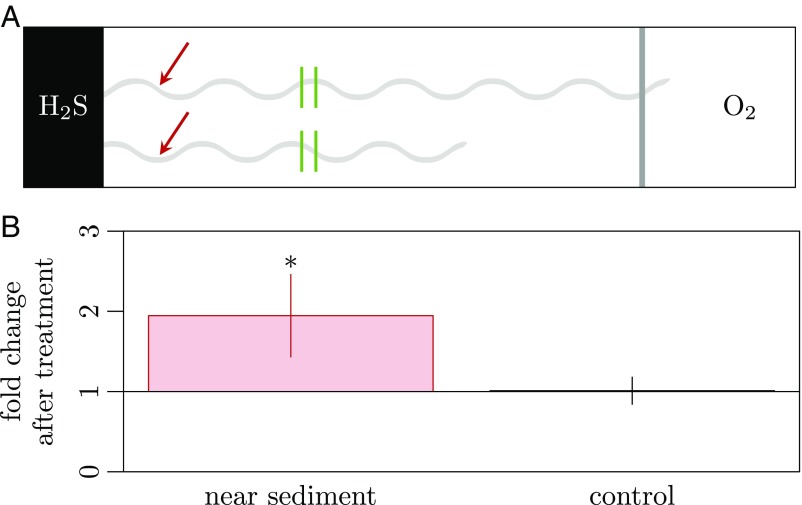
Electron transport within living cells is essential for energy conservation in all respiring and photosynthetic organisms. While a few bacteria transport electrons over micrometer distances to their surroundings, filaments of cable bacteria are hypothesized to conduct electric currents over centimeter distances. We used resonance Raman microscopy to analyze cytochrome redox states in living cable bacteria. Cable-bacteria filaments were placed in microscope chambers with sulfide as electron source and oxygen as electron sink at opposite ends. Along individual filaments a gradient in cytochrome redox potential was detected, which immediately broke down upon removal of oxygen or laser cutting of the filaments. Without access to oxygen, a rapid shift toward more reduced cytochromes was observed, as electrons were no longer drained from the filament but accumulated in the cellular cytochromes. These results provide direct evidence for long-distance electron transport in living multicellular bacteria.

Keywords: Raman spectroscopy; cable bacteria; conduction; cytochrome c; electromicrobiology.


Conflict of interest statement

The authors declare no conflict of interest.

Figures

Fig. 1.
Fig. 1.
(A) Dark-field micrograph of cable bacteria in the microscopic chamber setup reaching from sulfidic sediment (Left) to oxygen (Right). Arrows show the position of the veil composed of swarming microaerophilic microbes (white) and the positions, where the reduced (red) and oxidized (blue) Raman spectra shown in Fig. 2A were recorded. (B) Sulfide (red) and oxygen (blue) concentration gradients across the chamber setup as determined by microsensor measurements (n = 6). Gray shading indicates the microaerophilic veil.
Fig. 2.
Fig. 2.
(A) Raman spectra from an individual cable-bacterium filament (site Rattekaai, The Netherlands) near sediment (red) and near oxygen (blue). (B) Difference in normalized band intensity between either end of the suboxic zone. Red = data points closest to sediment (Fig. 1F and Fig. S4); blue = data points closest to microaerophilic veil and oxygen. Stippled and open bars display band intensities at 750 and 1,637 cm−1, respectively, given as percentage of the maximum band intensities (mean ± SD). Asterisks depict significant differences between cable-bacteria ends. n (for 750-cm−1/1,637-cm−1 band) = 15/6 filaments (379/200 spectra, Shapiro–Wilk test P value: 0.493/0.28, t test P value = 5.31 × 10⁻⁶/8.8 × 10−4). (C) Normalized band intensities (mean ± SD) showing the cytochrome redox gradient along a single cable-bacterium filament (Fig. S4M), reaching from sediment (to the left) toward oxygen. Gray shading indicates the microaerophilic veil. (D) Conceptual model of electron transport in cable bacteria. Cells in the sulfidic zone, with reduced cytochromes, upload electrons from H2S to periplasmic fibers, while cells in the oxic zone, with oxidized cytochromes, download electrons from these fibers to O2.
Fig. 3.
Fig. 3.
Effect of oxygen availability on cable-bacteria redox state. (A) Schematic of the setup for oxygen manipulation experiments. A filament (light-gray wave) reaches out from sulfidic sediment (Left) toward the air inlet (Right), from which oxygen can be removed; dark-gray shading indicates the position of the microaerophilic veil. Filaments that did not reach the veil were used as controls. Positions of Raman spectra recordings are marked with red (near sediment) and purple (midpoint) arrows. (B) Change in cytochrome redox state resulting from a change in oxygen availability. Bars represent fold change in normalized band intensities at 750 cm−1 relative to the intensity in the presence of oxygen (mean ± SD). Significant changes in redox state are marked by an asterisk. n = 16 filaments near sediment (1,666 spectra, Shapiro–Wilk test P value: 0.0003, Wilcoxon sign test P value: 0.000122), n = 4 filaments at midpoint (50 spectra, Shapiro–Wilk test P value: 0.551, t-test P value: 0.000488), and n = 6 control filaments near sediment (744 spectra, Shapiro–Wilk test P value: 0.903, t-test P value: 0.659). (C) Change in cytochrome redox state (band intensity at 750 cm−1) of a single cable-bacterium filament over time (42 min) during changes in oxygen availability. Measurements were done at midpoint. White area represents time when the air inlet was flushed with N2; shaded blue area represents time with oxygen available.
Fig. 4.
Fig. 4.
Effect of filament cutting on cable-bacteria redox state. (A) Schematic of the setup for laser-cut experiments. A filament (light-gray wave) reaches out from sulfidic sediment (Left) toward the air inlet (Right); dark-gray shading indicates the position of the microaerophilic veil. Filaments that did not reach the veil were used as controls. Positions of Raman spectra recordings are marked with red arrows (near sediment), positions of laser cuts are marked with green bars. (B) Change in cytochrome redox state in response to laser cutting of the filaments. Bars represent fold change in normalized band intensities at 750 cm−1 relative to the intensity before the cut (mean ± SD). A significant change in redox state is marked by an asterisk. n = 10 filaments (1,143 spectra, Shapiro–Wilk test P value: 0.117, t-test P value: 0.000517) and n = 5 control filaments (852 spectra, Shapiro–Wilk test P value: 0.84, t-test P value: 0.879).

Comment in

  • Biological electron transport goes the extra mile.
    Reguera G. Reguera G. Proc Natl Acad Sci U S A. 2018 May 29;115(22):5632-5634. doi: 10.1073/pnas.1806580115. Epub 2018 May 16. Proc Natl Acad Sci U S A. 2018. PMID: 29769327 Free PMC article. No abstract available.

References

    1. Pfeffer C, et al. Filamentous bacteria transport electrons over centimetre distances. Nature. 2012;491:218–221. - PubMed
    1. Malkin SY, et al. Natural occurrence of microbial sulphur oxidation by long-range electron transport in the seafloor. ISME J. 2014;8:1843–1854. - PMC - PubMed
    1. Risgaard-Petersen N, et al. Cable bacteria in freshwater sediments. Appl Environ Microbiol. 2015;81:6003–6011. - PMC - PubMed
    1. Trojan D, et al. A taxonomic framework for cable bacteria and proposal of the candidate genera Electrothrix and Electronema. Syst Appl Microbiol. 2016;39:297–306. - PMC - PubMed
    1. Burdorf LDW, et al. Long-distance electron transport occurs globally in marine sediments. Biogeosciences. 2017;14:683–701.

Publication types