. 2018 May 22;115(21):5594-5599.
doi: 10.1073/pnas.1720648115. Epub 2018 May 7.

Ultrafast glutamate sensors resolve high-frequency release at Schaffer collateral synapses

Affiliations

Ultrafast glutamate sensors resolve high-frequency release at Schaffer collateral synapses

Nordine Helassa et al. Proc Natl Acad Sci U S A. .

Abstract

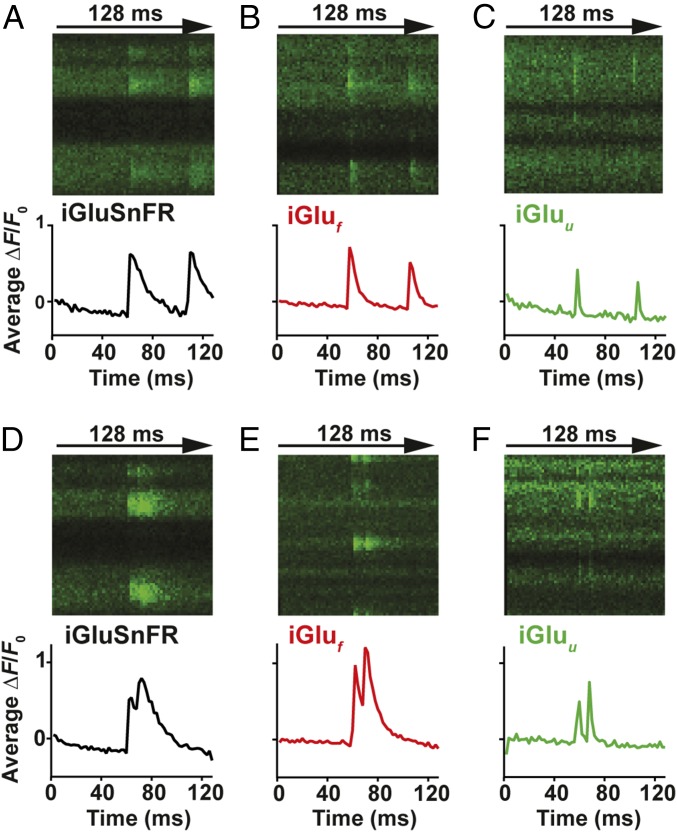
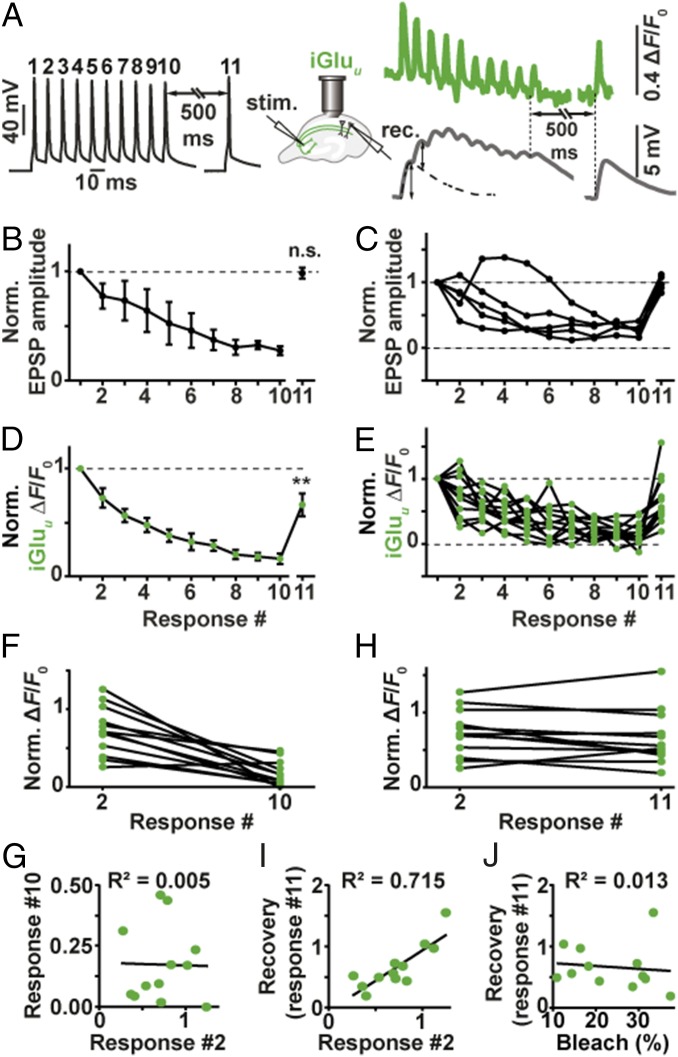
Glutamatergic synapses display a rich repertoire of plasticity mechanisms on many different time scales, involving dynamic changes in the efficacy of transmitter release as well as changes in the number and function of postsynaptic glutamate receptors. The genetically encoded glutamate sensor iGluSnFR enables visualization of glutamate release from presynaptic terminals at frequencies up to ∼10 Hz. However, to resolve glutamate dynamics during high-frequency bursts, faster indicators are required. Here, we report the development of fast (iGlu f ) and ultrafast (iGlu u ) variants with comparable brightness but increased Kd for glutamate (137 μM and 600 μM, respectively). Compared with iGluSnFR, iGlu u has a sixfold faster dissociation rate in vitro and fivefold faster kinetics in synapses. Fitting a three-state model to kinetic data, we identify the large conformational change after glutamate binding as the rate-limiting step. In rat hippocampal slice culture stimulated at 100 Hz, we find that iGlu u is sufficiently fast to resolve individual glutamate release events, revealing that glutamate is rapidly cleared from the synaptic cleft. Depression of iGlu u responses during 100-Hz trains correlates with depression of postsynaptic EPSPs, indicating that depression during high-frequency stimulation is purely presynaptic in origin. At individual boutons, the recovery from depression could be predicted from the amount of glutamate released on the second pulse (paired pulse facilitation/depression), demonstrating differential frequency-dependent filtering of spike trains at Schaffer collateral boutons.

Keywords: glutamate; hippocampus; synaptic transmission; two-photon imaging.


Conflict of interest statement

The authors declare no conflict of interest.

Figures

Fig. 1.
Fig. 1.
Genetically encoded glutamate indicators (GEGI). (A) Domain structure and design of FRET- and single fluorophore-based GEGI; key: GluBP (blue), cpEGFP (green), IgG kappa secretion tag (pink), hemagglutinin (HA) tag (purple), myc tag (gray), and a PDGFR transmembrane domain (brown); GluBP 1–253 and 254–279 fragments are in light and dark blue, respectively; Δ8 aa and Δ5 aa specify deletions at the N and C terminus of GluBP introduced in GluSnFR. (B) Design of selected iGluSnFR variants. Crystal structure of GluBP (PDB ID code 2VHA, adapted from ref. 8). Selected mutated residues around the glutamate site are shown as red and green backbone. Bound glutamate is represented in orange space filling display. (C) Equilibrium glutamate binding titrations at 20 °C for iGluSnFR (black circles), iGluSnFR E25D (iGluf) (red triangles), and iGluSnFR S72T (iGluu) (green squares) in vitro. (D) Glutamate titrations in situ at 37 °C. iGluSnFR, iGluf, and iGluu were expressed in HEK293T cells and titrated with glutamate. Data derived from iGluSnFR (n = 19), iGluf (n = 41), and iGluu (n = 33). (E) Representative images of HEK293T cells before glutamate addition and at saturating (1, 3, and 10 mM, respectively) glutamate. (Scale bar: 10 μm.) Glutamate dissociation kinetics of iGluSnFR (F), iGluf (G), and iGluu (H) determined by stopped-flow fluorimetry. Experimental data (dotted lines) are overlaid by curves fitted to single exponentials (solid lines). Fluorescence changes are normalized to Fmax of 1. Imaging glutamate release from single presynaptic terminals. (I) Schematic representation of hippocampal slice with transfected and patch-clamped CA3 pyramidal cell. (J) Spiral scan intersecting site of vesicular fusion. (K) Zoomed-in image of single trial iGluu response. (L) Decay time (τoff) measurements with bleach correction (dashed lines) for individual experiments by single exponential fit for iGluSnFR (n = 13 boutons, 500 Hz sampling rate) and variants iGluf (n = 7 boutons, 1 kHz sampling rate) and iGluu (n = 7 boutons, 1 kHz sampling rate).
Fig. 2.
Fig. 2.
Imaging glutamate release from single presynaptic terminals. Spiral line scans at 500 Hz were used to cover the entire surface of individual boutons, intersecting the release site multiple times. Averages of three to six responses of iGluSnFR (A and D), iGluf (B and E), and iGluu-expressing (C and F) boutons stimulated by two somatic APs at 48-ms (AC) and 10-ms interstimulus intervals (DF).
Fig. 3.
Fig. 3.
Depression and recovery of synaptic transmission during 100-Hz trains. (A) Example of patch-clamp recording from a connected pair of CA3-CA1 pyramidal cells. Black trace: induced APs in CA1 pyramidal cell, 100-Hz train and single AP. Gray trace: EPSPs in CA1 pyramidal cell (average of 50 sweeps). The single AP response (Right) was used to extract EPSP amplitudes from the burst response (dotted line). Green trace: average of 10 sweeps of single-bouton iGluu responses to identical stimulation. (B) EPSPs (deconvolved amplitudes) show strong depression during the 100-Hz train, followed by full recovery 500 ms later (n = 5 CA3-CA1 pairs); two-tailed Student’s t test comparing EPSP #1 and EPSP #11. (C) Individual paired recordings show consistent depression (response #10) and recovery (response #11). (D) Glutamate release shows strong depression during the 100-Hz train and partial recovery 500 ms later (n = 12 boutons, eight cells); two-tailed Student’s t test comparing response #1 and response #11 (P value: 0.0034). (E) Individual Schaffer collateral boutons show large variability in response #2 and in recovery response (#11) (F and G) responses by iGluu to the second AP (paired-pulse facilitation/depression) were not correlated with total depression (response #10 normalized to response #1). (H and I) iGluu responses to the second AP (response #2 normalized to response #1) were highly correlated with recovery after 500 ms (response #11 normalized to response #1). (J) Recovery was independent of indicator bleach (F0, response #11/F0, response #1).
Fig. 4.
Fig. 4.
Kinetics of glutamate binding by iGluSnFR variants (20 °C). (A, C, and E) Glutamate association kinetics of iGluSnFR, iGluf, and iGluu, respectively. Stopped-flow records of iGluSnFR, iGluf, and iGluu reacting with the indicated concentrations of glutamate. Experimental data (dotted lines) are overlaid with curves fitted to single exponentials (solid lines). (B, D, and F) Plot of observed association rates, kobs(on) of iGluSnFR, iGluf, and iGluu as a function of glutamate concentration. (G) Cartoon diagram depicting the putative molecular transitions of iGluSnFR and its fast variants to the fluorescent state. Key: cpEGFP (green), GluBP 1–253 (iGlul) (light blue) and 254–279 (iGlus) (dark blue) fragments, glutamate (orange).

References

    1. Markram H, Wang Y, Tsodyks M. Differential signaling via the same axon of neocortical pyramidal neurons. Proc Natl Acad Sci USA. 1998;95:5323–5328. - PMC - PubMed
    1. Regehr WG. Short-term presynaptic plasticity. Cold Spring Harb Perspect Biol. 2012;4:a005702. - PMC - PubMed
    1. Jenkins MA, Traynelis SF. PKC phosphorylates GluA1-Ser831 to enhance AMPA receptor conductance. Channels (Austin) 2012;6:60–64. - PMC - PubMed
    1. Best SL, Török K. Development of a fluorescent glutamate binding protein. Biophys J. 2005;88:46a.
    1. Chen GQ, Gouaux E. Overexpression of a glutamate receptor (GluR2) ligand binding domain in Escherichia coli: Application of a novel protein folding screen. Proc Natl Acad Sci USA. 1997;94:13431–13436. - PMC - PubMed

Publication types