. 2018 May 22;115(21):E4741-E4750.
doi: 10.1073/pnas.1714770115. Epub 2018 May 7.

Laterally confined growth of cells induces nuclear reprogramming in the absence of exogenous biochemical factors

Affiliations

Laterally confined growth of cells induces nuclear reprogramming in the absence of exogenous biochemical factors

Bibhas Roy et al. Proc Natl Acad Sci U S A. .

Abstract

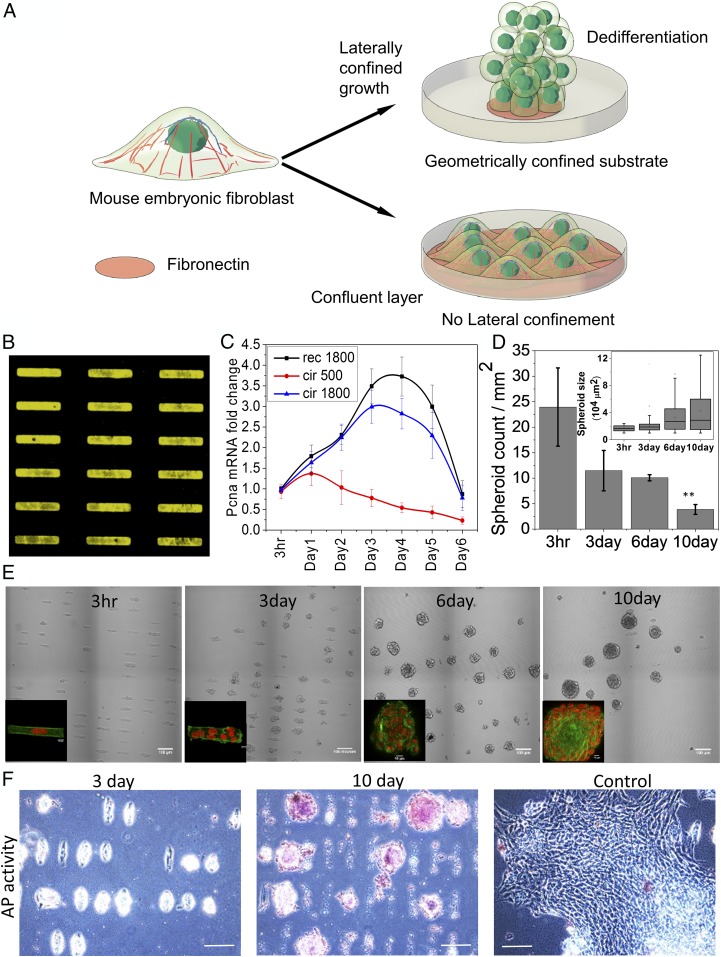
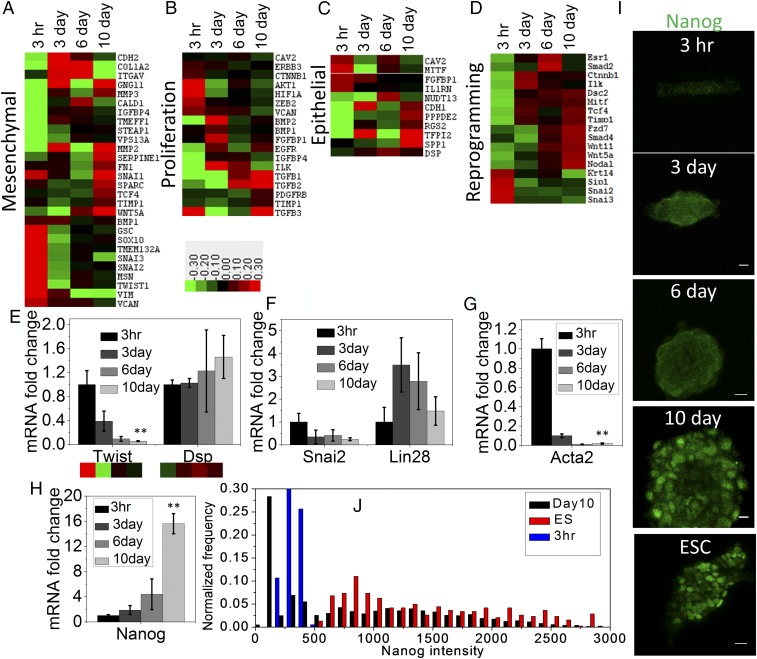
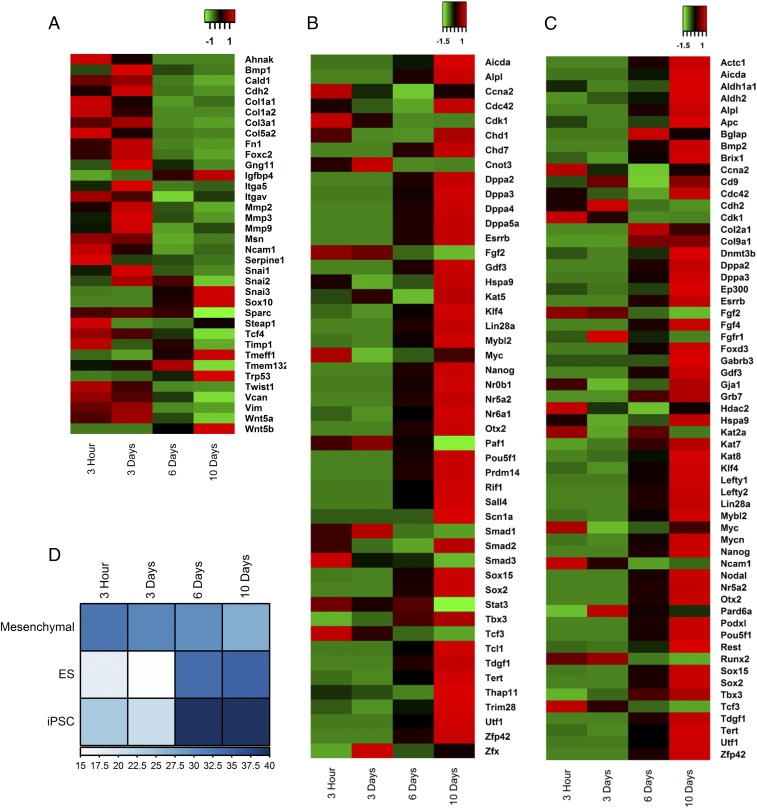
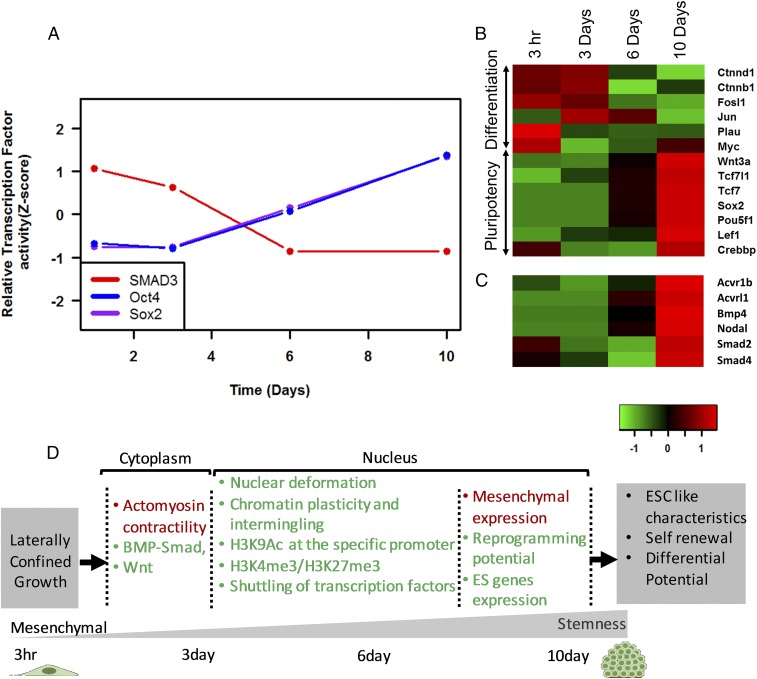
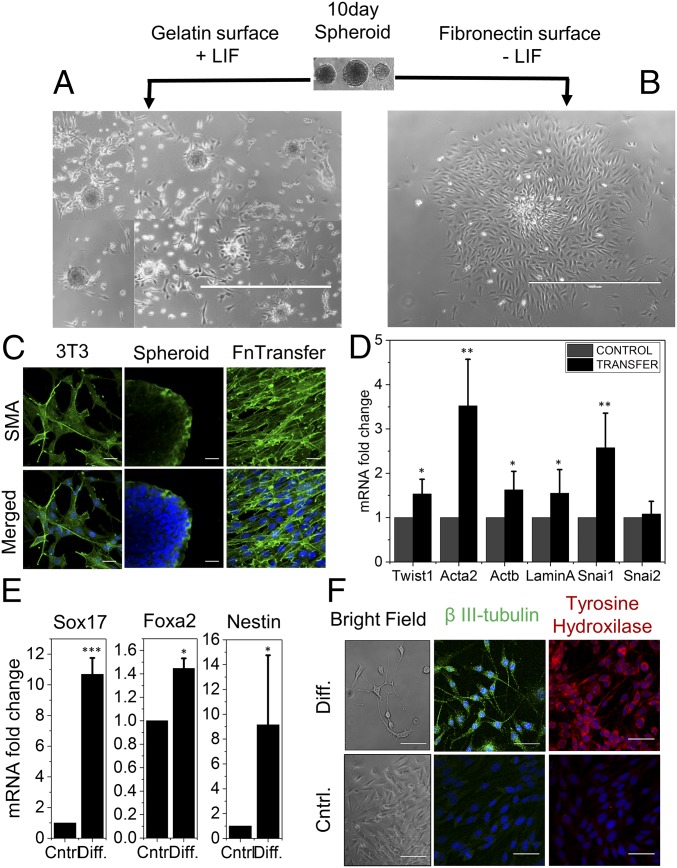
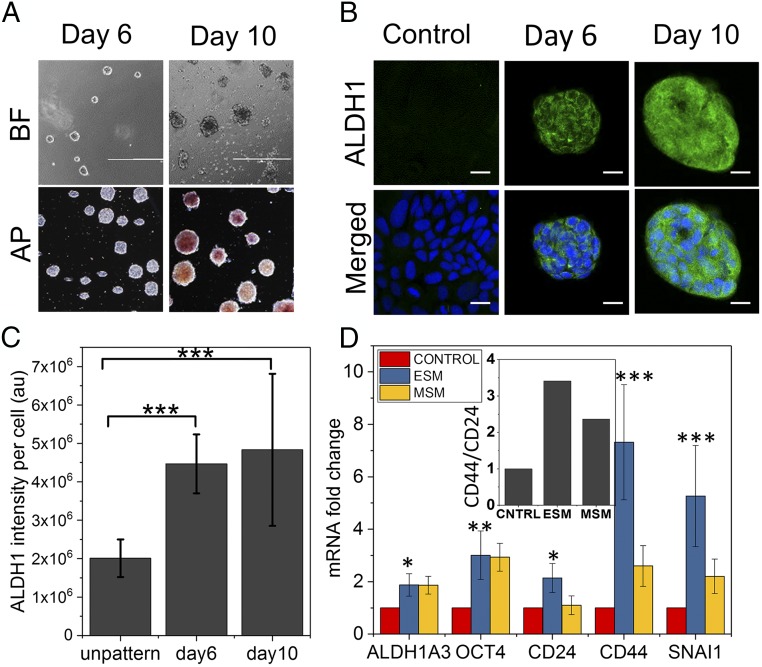
Cells in tissues undergo transdifferentiation programs when stimulated by specific mechanical and biochemical signals. While seminal studies have demonstrated that exogenous biochemical factors can reprogram somatic cells into pluripotent stem cells, the critical roles played by mechanical signals in such reprogramming process have not been well documented. In this paper, we show that laterally confined growth of fibroblasts on micropatterned substrates induces nuclear reprogramming with high efficiency in the absence of any exogenous reprogramming factors. We provide compelling evidence on the induction of stem cell-like properties using alkaline phosphatase assays and expression of pluripotent markers. Early onset of reprogramming was accompanied with enhanced nuclear dynamics and changes in chromosome intermingling degrees, potentially facilitating rewiring of the genome. Time-lapse analysis of promoter occupancy by immunoprecipitation of H3K9Ac chromatin fragments revealed that epithelial, proliferative, and reprogramming gene promoters were progressively acetylated, while mesenchymal promoters were deacetylated by 10 days. Consistently, RNA sequencing analysis showed a systematic progression from mesenchymal to stem cell transcriptome, highlighting pathways involving mechanisms underlying nuclear reprogramming. We then demonstrated that these mechanically reprogrammed cells could be maintained as stem cells and can be redifferentiated into multiple lineages with high efficiency. Importantly, we also demonstrate the induction of cancer stemness properties in MCF7 cells grown in such laterally confined conditions. Collectively, our results highlight an important generic property of somatic cells that, when grown in laterally confined conditions, acquire stemness. Such mechanical reprogramming of somatic cells demonstrated here has important implications in tissue regeneration and disease models.

Keywords: cancer stemness; chromosome intermingling; epigenetic erasure; lateral confined growth; nuclear reprogramming.


Conflict of interest statement

The authors declare no conflict of interest.

Figures

Fig. 1.
Fig. 1.
Laterally confined growth of cell facilitates induction of ES-like cells. (A) Schematic representation of the effect of geometry driven laterally confined growth of fibroblast on dedifferentiation. (B) Represents fibronectin RE micropatterns of 1,800 µm2 area. (C) Time course analysis of PCNA gene expression by qRT-PCR. (D) Plot represents number of cells or cell spheroids per unit area. (Inset) Plot represents the cells or spheroids area. Error bars represent SD. (E) The phase contrast images of NIH 3T3 mouse fibroblasts cells cultured on micropatterns up to 10 d. On tenth day, spheroids appear as ES-like colonies. Insets show fluorescent images of cells on the micropattern stained with nucleus (red) and actin (green). (Scale bar, 100 µm.) (F) These ES-like colonies on day 10 also show alkaline phosphatase (AP) activity, unlike cells cultured on RE for 3 d or culture flask for 10 d (control). (Scale bar, 100 µm.)
Fig. 2.
Fig. 2.
Time course transitions in epigenetic landscape facilitating nuclear reprogramming. Epitect ChIP-qPCR array for differential histone acetylation represented as heat maps shows relative changes of H3K9Ac occupancy at the promoter regions of genes characterizing (A) mesenchymal, (B) proliferation, (C) epithelium-like, and (D) reprogramming properties. Mean-normalized data were analyzed by Cluster 3.0. Ordering method is complete linkage. The heat map with clustering was acquired using Java Tree View. Positive, red; negative, green; zero, black. (E) Twist and Dsp mRNA in these four conditions obtained by qRT-PCR shows similar trend of their corresponding promoter occupancy of H3K9Ac. Error bars represent SD; **P < 0.01; Student’s t test. (F) The mRNA level of two transcription factors Snai2 and Lin28 obtained by qRT-PCR associated with negative and positive regulation, respectively, in nuclear reprogramming. (G and H) The mRNA level of mesenchymal and ESC characteristic genes Acta2 (αSMA) and Nanog, respectively, normalized with respect to NIH 3T3 grown on RE for 3 h cells (n = 3 samples). Error bars represent SD; **P < 0.01; Student’s t test. (I) Representative Nanog immunofluorescence micrographs of NIH 3T3 cells grown under laterally confined conditions for 10 d on RE and mouse ESC. (Scale bars, 10 µm.) (J) Normalized frequency distribution plot of nuclear Nanog fluorescence intensity in 3 h rectangle cells, 10 d spheroids, and ESCs.
Fig. 3.
Fig. 3.
Temporal changes in the transcriptome during the nuclear reprogramming. Heat maps showing the relative gene expression patterns of (A) mesenchymal, (B) ESC (ES), and (C) iPSC genes. (D) A heat map representing the number of transcripts of candidate genes in the highly expressed transcripts (top 10%) in each sample.
Fig. 4.
Fig. 4.
Transcriptome analysis reveals altered biological pathways leading to nuclear reprogramming. (A) The transcriptional activity of the target genes of the respective transcription factors’ gene expression changes that indicate transcriptional activation of (B) Wnt pathway and (C) BMP−SMAD pathway. (D) Schematic summary of the induction of reprogramming by laterally confined growth of cells. Red and green colors represent the events that decrease and increase, respectively.
Fig. 5.
Fig. 5.
Maintenance of stem cell-like state and differentiation potential of the reprogrammed spheroids. (A) Isolated 10-d-old spheroids maintain their cellular confinement memory or ES-like colony state for a few days upon culture on gelatin-coated dish in LIF media, as represented in the composite image obtained from different field of view of the same culture dish; (B) appearance of fibroblast morphology upon culture on fibronectin-coated dishes without LIF media. (Scale bar, 1 mm.) (C) Elevated level of αSMA in the fibronectin (Fn)-transferred reverse fibroblasts compared with parental NIH 3T3 and gelatin+LIF transferred spheroids. (Scale bar, 20 µm.) (D) Relative expression profile of gene by qPCR assay in fibronectin-transferred reverse fibroblasts and NIH 3T3. Error bars represent SD; *P < 0.05; **P < 0.01; Student’s t test. (E) Relative expression profile of endodermal lineage marker gene (Sox17 and Foxa2) and neuroectodermal marker gene (Nestin) upon differentiation of the 10-d spheroids in corresponding differentiation culture condition. Error bars represent SD; *P < 0.05; **P < 0.01; ***P < 0.001; Student’s t test. (F) Representative micrograph of dopaminergic neuronal markers β-III-tubulin and tyrosine hydroxylase in transformed spheroids taken through differentiation culture condition and without differentiation factors. (Bright Field: scale bar, 1 mm.) (IF: scale bar, 50 µm.)
Fig. 6.
Fig. 6.
Laterally confined growth of human breast cancer cell facilitates induction of cancer stemness. (A) The bright-field images (BF) of MCF7 cells cultured on RE micropatterns up to 10 d. These MCF7 spheroids on day 10 also show alkaline phosphatase (AP) activity, unlike cells cultured on RE for 6 d. (Scale bar, 1 mm.) (B) Representative confocal micrographs of MCF7 cells grown for 6 and 10 d under lateral confinement and in control cell grown on unpatterned culture plate for 10 d. Cells were immunostained for cancer stemness marker aldehyde dehydrogenase (ALDH1) (green). (Scale bar, 20 µm.) (C) Normalized ALDH1 fluorescence intensity plot on day 6 and day 10 compared with cell grown on unpatterned culture plate for 10 d. Error bars represent SD; ***P < 0.001; Student’s t test. (D) Cancer stemness-related gene expression profile in MCF7 cells grown in RE micropatterns up to 10 d (ESM) and in MCF7 mammosphere culture (MSM) compared with cell grown on unpatterned culture plate for 10 d (CONTROL). Error bars represent SD; *P < 0.05; **P < 0.01; ***P < 0.001; Student’s t test. (Inset) The ratio of expression between CD44 and CD24.

References

    1. Halley-Stott RP, Pasque V, Gurdon JB. Nuclear reprogramming. Development. 2013;140:2468–2471. - PubMed
    1. Reik W, Dean W, Walter J. Epigenetic reprogramming in mammalian development. Science. 2001;293:1089–1093. - PubMed
    1. Lamouille S, Xu J, Derynck R. Molecular mechanisms of epithelial-mesenchymal transition. Nat Rev Mol Cell Biol. 2014;15:178–196. - PMC - PubMed
    1. Takahashi K, Yamanaka S. Induction of pluripotent stem cells from mouse embryonic and adult fibroblast cultures by defined factors. Cell. 2006;126:663–676. - PubMed
    1. Gurdon JB, Melton DA. Nuclear reprogramming in cells. Science. 2008;322:1811–1815. - PubMed

Publication types