Review
. 2018 Jun 19;373(1749):20170187.
doi: 10.1098/rstb.2017.0187.

A non-equilibrium approach to allosteric communication

Affiliations
Review

A non-equilibrium approach to allosteric communication

Gerhard Stock et al. Philos Trans R Soc Lond B Biol Sci. .

Abstract

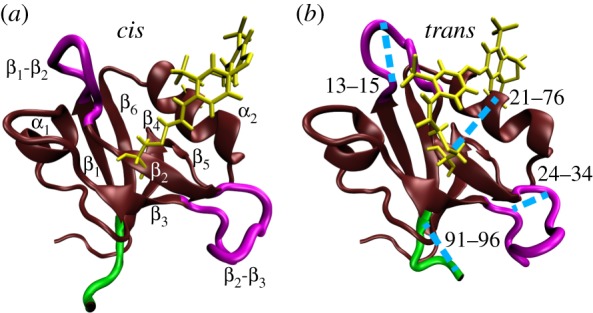
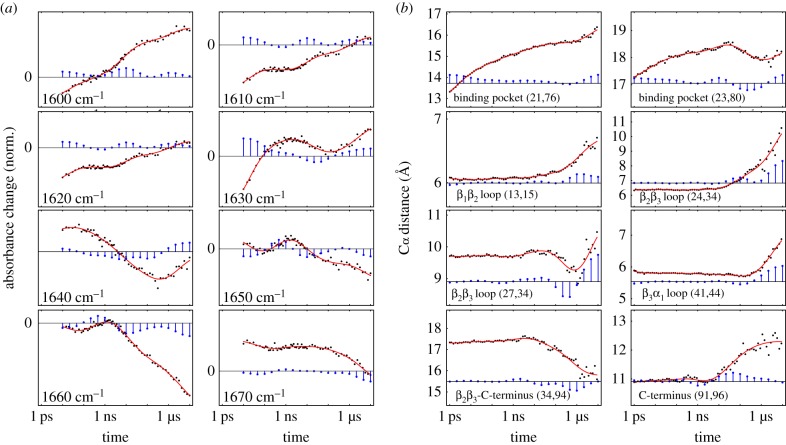
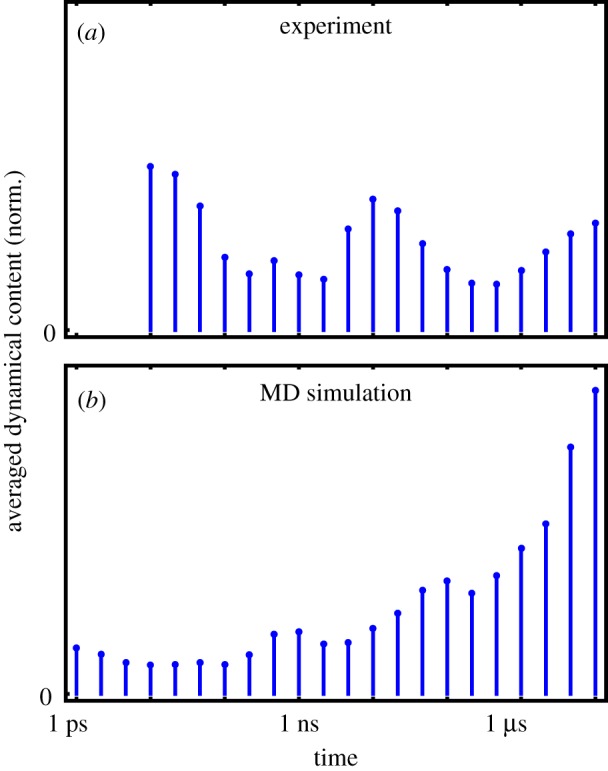
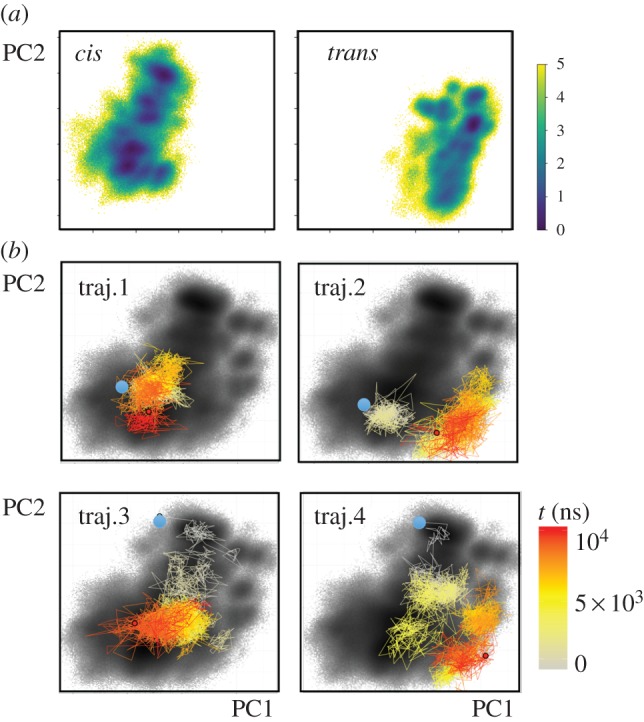
While the theory of protein folding is well developed, including concepts such as rugged energy landscape, folding funnel, etc., the same degree of understanding has not been reached for the description of the dynamics of allosteric transitions in proteins. This is not only due to the small size of the structural change upon ligand binding to an allosteric site, but also due to challenges in designing experiments that directly observe such an allosteric transition. On the basis of recent pump-probe-type experiments (Buchli et al. 2013 Proc. Natl Acad. Sci. USA110, 11 725-11 730. (doi:10.1073/pnas.1306323110)) and non-equilibrium molecular dynamics simulations (Buchenberg et al. 2017 Proc. Natl Acad. Sci. USA114, E6804-E6811. (doi:10.1073/pnas.1707694114)) studying an photoswitchable PDZ2 domain as model for an allosteric transition, we outline in this perspective how such a description of allosteric communication might look. That is, calculating the dynamical content of both experiment and simulation (which agree remarkably well with each other), we find that allosteric communication shares some properties with downhill folding, except that it is an 'order-order' transition. Discussing the multiscale and hierarchical features of the dynamics, the validity of linear response theory as well as the meaning of 'allosteric pathways', we conclude that non-equilibrium experiments and simulations are a promising way to study dynamical aspects of allostery.This article is part of a discussion meeting issue 'Allostery and molecular machines'.

Keywords: allosteric transition; downhill folding; dynamic content; free-energy landscape; non-equilibrium molecular dynamics simulations; time-resolved vibrational spectroscopy.


Conflict of interest statement

We declare we have no competing interests.

Figures

Figure 1.
Figure 1.
MD snapshots of PDZ2 in cis (a) and trans (b) equilibrium states, showing α-helices and β-sheets in brown, loop regions in purple, the C-terminal in green, and the azobenzene photoswitch including linker atoms in yellow. In a, labels indicate the regions β1 (residues 6–12), β2 (20–23), β3 (35–40), α1 (45–49), β4 (57–61), β5 (64–65), α2 (73–80) and β6 (84–90). Important loops connecting these regions include β12 (13–19), β23 (24–34), β31 (41–44) and α26 (81–83). In b, the blue lines indicate selected Cα-distances which characterize the conformational transition following cistrans photoisomerization of PDZ2. Adapted with permission from Buchenberg et al. [32].
Figure 2.
Figure 2.
Time-dependent description of the structural response of a photoswitchable PDZ2 domain, using a logarithmic scale for the time axis. (a) Normalized transient IR time traces (black circles and red fits) across the amide I band in steps of 10 cm−1, which are reproduced from Buchli et al. [31]. Owing to the limited time resolution, there are no experimental data for the first decade. (b) Time evolution (black circles and red fits) of selected Cα-distances of PDZ2, obtained from non-equilibrium MD simulations by Buchenberg et al. [32]. Blue bars indicate the associated dynamical content of experimental and MD data, i.e. the weight of timescale τi in a multiexponential response function. Adapted with permission from Buchli et al. [31] and Buchenberg et al. [32]. (Online version in colour.)
Figure 3.
Figure 3.
Averaged dynamical content D(τi) as a function of time constant τi, pertaining to (a) all available transient IR time traces from the experimental data [31] and (b) the time evolution of all Cα-distances from the MD data [32]. (Online version in colour.)
Figure 4.
Figure 4.
Two-dimensional representation of the free-energy landscape ΔG (in units of kBT), plotted as a function of the first two principal components PC1 and PC2. (a) Energy landscapes associated with the cis and trans equilibrium states of PDZ2. (b) Free-energy landscape associated with the non-equilibrium allosteric transition, drawn as black background. The coloured lines indicate the time evolution of selected single non-equilibrium trajectories. Adapted with permission from Buchenberg et al. [32].
Figure 5.
Figure 5.
Different reaction coordinates may discriminate the cis (red) and trans (green) equilibrium states of PDZ2 differently. Shown are distributions of Cα distances (21,76), (13,15) and (91,96) as well as of the first principle component PC1. Adapted with permission from Buchenberg et al. [32]. (Online version in colour.)

References

    1. Kern D, Zuiderweg E. 2003. The role of dynamics in allosteric regulation. Curr. Opin. Struct. Biol. 13, 748–757. (10.1016/j.sbi.2003.10.008) - DOI - PubMed
    1. Gunasekaran K, Ma B, Nussinov R. 2004. Is allostery an intrinsic property of all dynamic proteins? Proteins 57, 433–443. (10.1002/prot.20232) - DOI - PubMed
    1. Cui Q, Karplus M. 2008. Allostery and cooperativity revisited. Protein. Sci. 17, 1295–1307. (10.1110/ps.03259908) - DOI - PMC - PubMed
    1. Changeux J-P. 2012. Allostery and the Monod-Wyman-Changeux model after 50 years. Ann. Rev. Biophys. 41, 103–133. (10.1146/annurev-biophys-050511-102222) - DOI - PubMed
    1. Motlagh HN, Wrabl JO, Li J, Hilser VJ. 2014. The ensemble nature of allostery. Nature 508, 331–339. (10.1038/nature13001) - DOI - PMC - PubMed

Publication types

LinkOut - more resources