. 2018 Jun;50(6):865-873.
doi: 10.1038/s41588-018-0115-y. Epub 2018 May 7.

Locus-specific control of the de novo DNA methylation pathway in Arabidopsis by the CLASSY family

Affiliations

Locus-specific control of the de novo DNA methylation pathway in Arabidopsis by the CLASSY family

Ming Zhou et al. Nat Genet. 2018 Jun.

Abstract

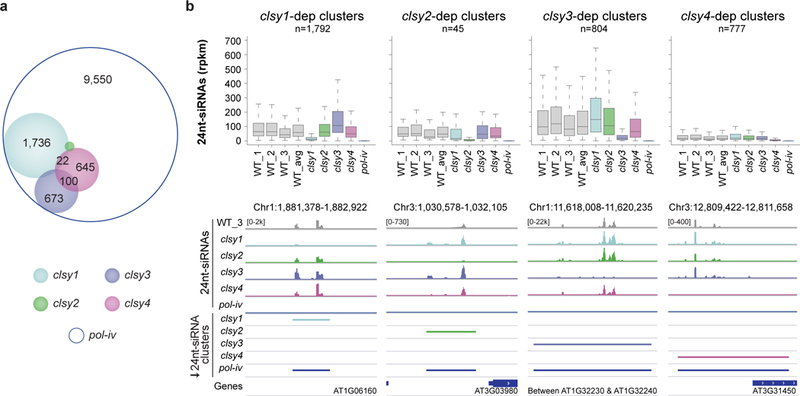
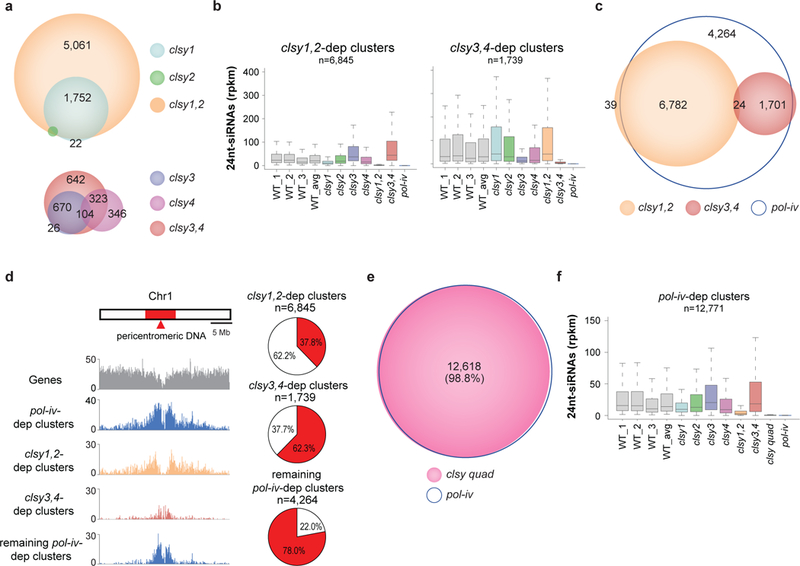
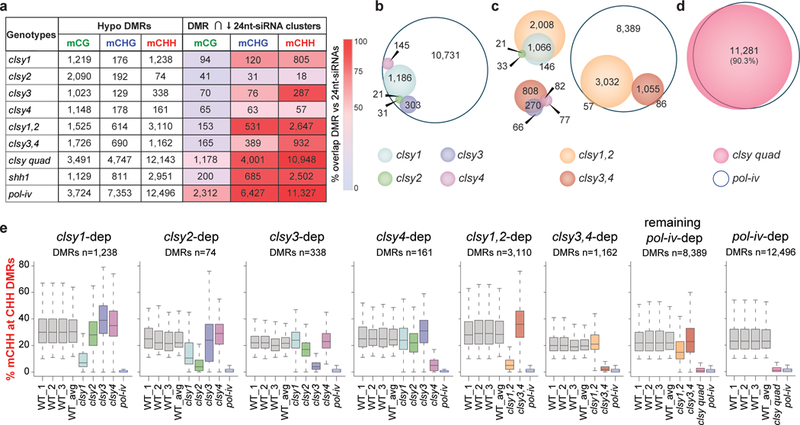
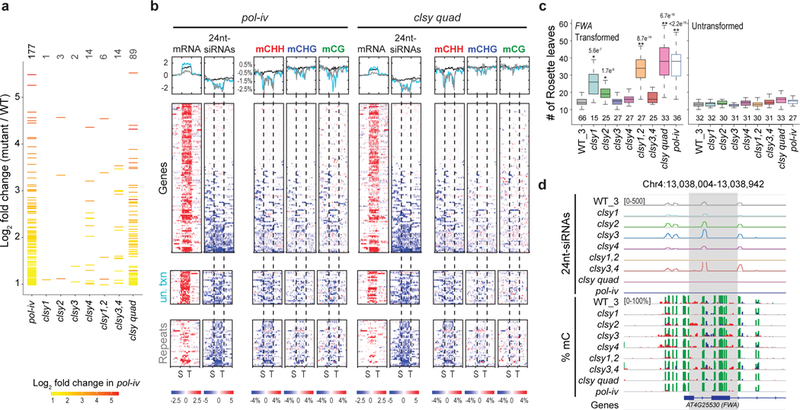
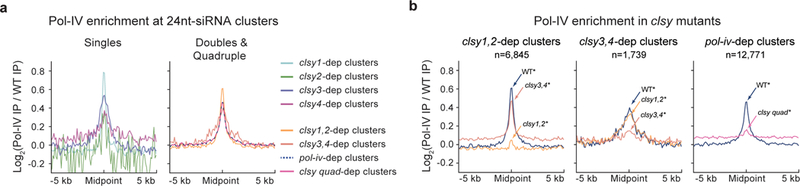
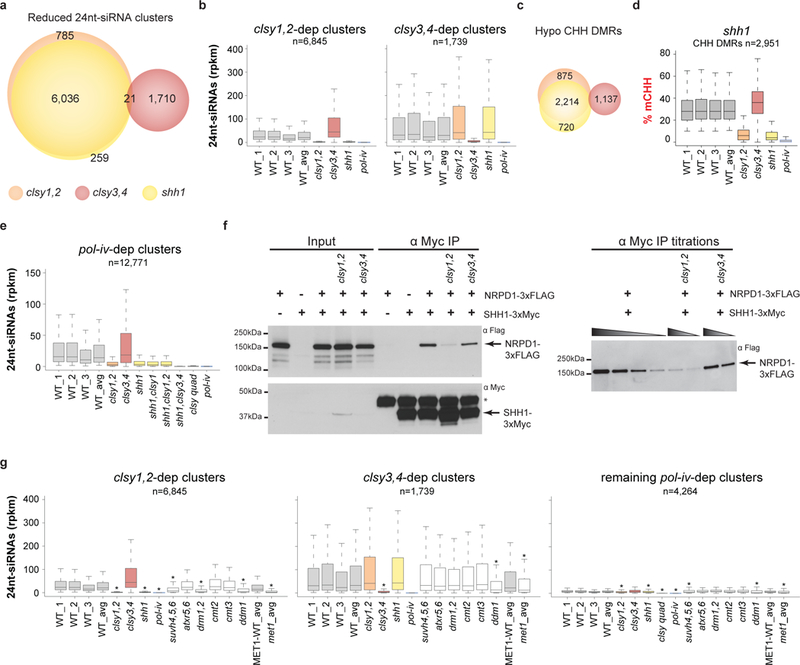
DNA methylation is essential for gene regulation, transposon silencing and imprinting. Although the generation of specific DNA methylation patterns is critical for these processes, how methylation is regulated at individual loci remains unclear. Here we show that a family of four putative chromatin remodeling factors, CLASSY (CLSY) 1-4, are required for both locus-specific and global regulation of DNA methylation in Arabidopsis thaliana. Mechanistically, these factors act in connection with RNA polymerase-IV (Pol-IV) to control the production of 24-nucleotide small interfering RNAs (24nt-siRNAs), which guide DNA methylation. Individually, the CLSYs regulate Pol-IV-chromatin association and 24nt-siRNA production at thousands of distinct loci, and together, they regulate essentially all 24nt-siRNAs. Depending on the CLSYs involved, this regulation relies on different repressive chromatin modifications to facilitate locus-specific control of DNA methylation. Given the conservation between methylation systems in plants and mammals, analogous pathways may operate in a broad range of organisms.


Conflict of interest statement

Competing Financial Interests Statement

The authors declare no competing interests.

Figures

Figure 1.
Figure 1.. The CLSY family controls 24nt-siRNA levels in a locus-specific manner.
(a) Scaled Venn diagram based on the reduced 24nt-siRNA clusters provided in Supplementary Table 4 showing the relationships between loci with reduced 24nt-siRNA levels in the clsy single mutants. For readability, only overlaps >20 are labeled. A small number of overlaps between clsy2 and clsy3 are not shown due to spatial constraints, but an unscaled Venn diagram showing all the overlaps is present in Supplementary Figure 1f. (b) Boxplots showing 24nt-siRNA levels (reads per kilobase per million; rpkm) in each clsy single mutant compared to each other, wild-type (WT) controls, and pol-iv. Here, and in all subsequent figures, the boxplots show the interquartile range (IQR) with the median shown as the black line and the whiskers corresponding to 1.5 times the IQR. Above each plot, the numbers of clusters (n) are indicated and biological replicates for the WT controls are designated as WT_1, WT_2, and WT_3, with the average signal from these replicates designated as the WT_avg. These boxplots represent a single experiment, but confirmatory data from an independent biological replicate and from additional alleles are presented in Supplementary Figs. 1i and 3, respectively. Below each boxplot are genome browser screen shots showing the levels of 24nt-siRNAs (reads per 10 million; rp10m) at representative clsy-dependent 24nt-siRNA clusters. The scale for each panel is indicated in brackets, where k indicates 1000.
Figure 2.
Figure 2.. Specific CLSY pairs regulate 24nt-siRNAs at non-overlapping and spatially distinct genomic loci.
(a, c, and e) Scaled Venn diagrams showing the relationships between loci with reduced 24nt-siRNA levels in the indicated clsy single, double, and quadruple mutants. For readability, only overlaps >20 are labeled except for panel e where the % overlap between both samples is shown instead. (b and f) Boxplots showing 24nt-siRNA levels in each clsy single, double or quadruple mutant compared to each other, WT controls and pol-iv, from a single experiment. Confirmatory data using additional alleles are presented in Supplementary Fig. 3. (d) Chromosome 1 view of 24nt-siRNA clusters dependent on the genotypes indicated on the left, where the scale is the number of clusters per 100kb bin. The red region corresponds to pericentromeric DNA. The pie charts represent the genome wide (i.e. Chr1–5) distributions. Chromosomal views for Chr2–5 are present in Supplementary Figure 2e.
Figure 3.
Figure 3.. 24nt-siRNA losses in clsy mutants result in reduced DNA methylation.
(a) Table showing the numbers of hypo DMRs in the genotypes and methylation contexts indicated, where H=A, T, or C. The number of these DMRs that overlap (∩) with reduced 24nt-siRNA clusters (“DMR ∩ ↓ 24nt-siRNA clusters”) is also indicated and shaded from light blue to red based on the percentage of total DMRs represented. (b-d) Scaled Venn diagrams of hypo CHH DMRs showing the relationships between loci regulated by the clsy single, double, and quadruple mutants, respectively. For readability, only overlaps >20 are labeled except for panel d where the % overlap is shown instead. For panel b, a small number of overlaps are not shown due to spatial constraints, but an unscaled Venn diagram showing all the overlaps is present in Supplementary Figure 5a. (e) Boxplots showing the levels of CHH methylation at the hypo CHH DMRs identified in each clsy single, double or quadruple mutant as compared to each other, WT controls, and pol-iv. These boxplots represent a single experiment including three independent WT controls.
Figure 4.
Figure 4.. The CLSY family controls the expression of RdDM targets.
(a) Plot showing the expression level of pol-iv-up-regulated loci (represented as horizontal slashes) in the clsy single, double and quadruple mutants. The slashes in all genotypes are colored based on the expression level of up-regulated loci in pol-iv and the number of up-regulated loci in each mutant is indicated above. (b) Heatmaps and profile plots showing the expression levels of the up-regulated TAIR10 genes (n=115), unannotated transcripts (un. txn; n=26), and TAIR10 repeats (n=36) shown in a as well as the corresponding 24nt-siRNA and DNA methylation levels at these same loci. For the mRNA and 24nt-siRNA analyses, the Log2 fold change in expression is plotted and for the DNA methylation analysis, the percent difference in methylation is plotted. Color bars indicating the scales are shown below. The heatmaps include 2kb flanking the transcription start site (S) and the transcription termination site (T) and were ranked based on the 24nt-siRNA and mCHH values in both mutants (pol-iv and the clsy quad). The profiles of the genes, un. txn, and repeats are in black, light blue, and grey, respectively. (c) Boxplots showing the number of leaves produced before flowering in FWA transformed T0 plants (Left) or untransformed plants (Right). The number of independent transformants (or untransformed plants) used for each genotype is shown below the boxplots. p-values ≤1e−4 calculated using Wilcoxon sum tests relative to the WT_3 control are shown above. (d) Genome browser screen shot showing the levels of 24nt-siRNAs (rp10m) and DNA methylation at the endogenous FWA gene in the indicated genotypes. For each set of data, the scale is indicated in brackets, with CG, CHG, and CHH methylation shown in green, blue, and red, respectively. The region showing the most prominent reduction in CHH methylation is highlighted in grey. The expression data presented in panels a, b, and d corresponds to two biological replicates of each genotype.
Figure 5.
Figure 5.. The CLSY proteins are required for Pol-IV chromatin association at 24nt-siRNA producing loci.
(a and b) Profile plots showing Pol-IV enrichment at all the different classes of clsy-dependent 24nt-siRNA clusters in a WT background (the pNRPD1::NRPD1–3xFLAG line) or the indicated clsy mutant backgrounds, respectively, from two sets of ChIP-seq data (see Supplementary Table 10). The asterisk (*) indicates that these lines are also homozygous for both the NRPD1–3xFLAG transgene and the nrpd1 mutant.
Figure 6.
Figure 6.. The CLSY1/2 and CLSY3/4 proteins regulate Pol-IV in connection with repressive chromatin marks.
(a and c) Scaled Venn diagrams of reduced 24nt-siRNA clusters and hypo CHH DMRs, respectively, showing the relationships between loci regulated by the shh1 single and clsy1,2 or clsy3,4 double mutants. For readability, only overlaps >20 are labeled. (b, e and g) Boxplots showing the levels of 24nt-siRNAs at the reduced 24nt-siRNA clusters identified in the clsy double mutants, b and g, or pol-iv single mutant, e, in the genotypes indicated below. In g, the asterisks (*) indicate a p-value <2.2e−16 calculated using a Wilcoxon sum test relative to the WT_avg control for all samples except for met1, which was calculated relative to the MET1-WT control. The p-values for all other samples are >0.05. These boxplots represent a single experiment including three independent WT controls. (d) Boxplot showing the levels of CHH methylation at the hypo CHH DMRs identified in the shh1 single mutant as compared to the clsy double mutants and pol-iv. This boxplot represents a single experiment including three independent WT controls. (f) Cropped Western blots showing the levels of NRPD1–3xFLAG or SHH1–3xMyc from co-immunoprecipitation (co-IP) experiments in the genetic backgrounds indicated above each lane. For each blot the antibody (α) used is indicated in the upper right corner and the sizes of the protein markers are indicated on the left. An asterisk (*) marks a background band present in the α-Myc IP and the bands corresponding to the NRPD1–3xFLAG and SHH1–3xMyc proteins are marked with arrows. For the IP titrations, the gradient triangles represent a series of 2-fold dilutions starting from undiluted IP samples. Uncropped images are shown in Supplementary Fig. 8.

References

    1. Castel SE & Martienssen RA RNA interference in the nucleus: roles for small RNAs in transcription, epigenetics and beyond. Nat Rev Genet 14, 100–12 (2013). - PMC - PubMed
    1. Holoch D & Moazed D RNA-mediated epigenetic regulation of gene expression. Nat Rev Genet 16, 71–84 (2015). - PMC - PubMed
    1. Haag JR & Pikaard CS Multisubunit RNA polymerases IV and V: purveyors of non-coding RNA for plant gene silencing. Nat Rev Mol Cell Biol 12, 483–92 (2011). - PubMed
    1. Zhou M & Law JA RNA Pol IV and V in gene silencing: Rebel polymerases evolving away from Pol II’s rules. Curr Opin Plant Biol 27, 154–64 (2015). - PMC - PubMed
    1. Law JA & Jacobsen SE Establishing, maintaining and modifying DNA methylation patterns in plants and animals. Nat Rev Genet 11, 204–20 (2010). - PMC - PubMed

Publication types