. 2018 Jun;24(6):782-791.
doi: 10.1038/s41591-018-0030-x. Epub 2018 May 7.

Adrenergic nerve degeneration in bone marrow drives aging of the hematopoietic stem cell niche

Affiliations

Adrenergic nerve degeneration in bone marrow drives aging of the hematopoietic stem cell niche

Maria Maryanovich et al. Nat Med. 2018 Jun.

Erratum in

Abstract

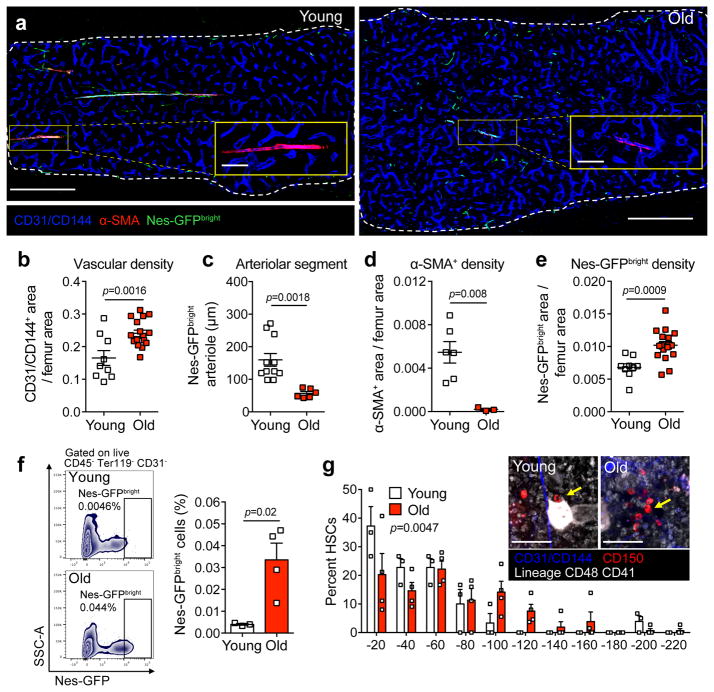
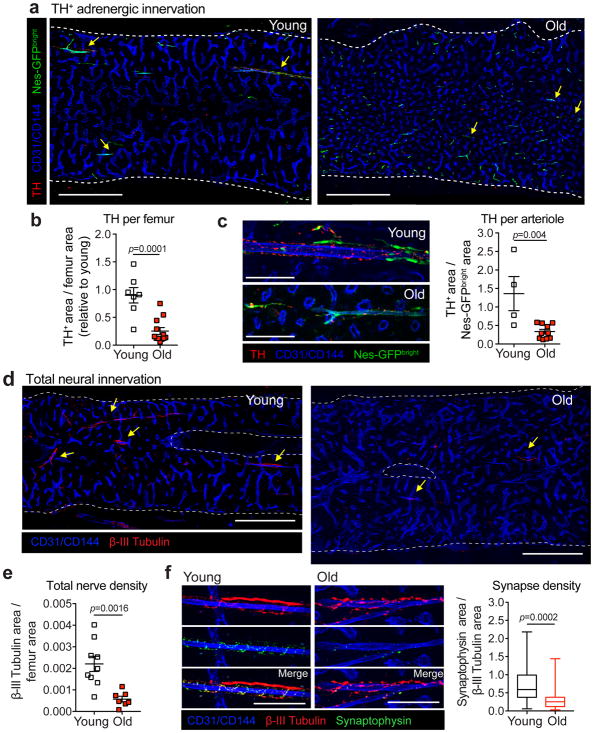
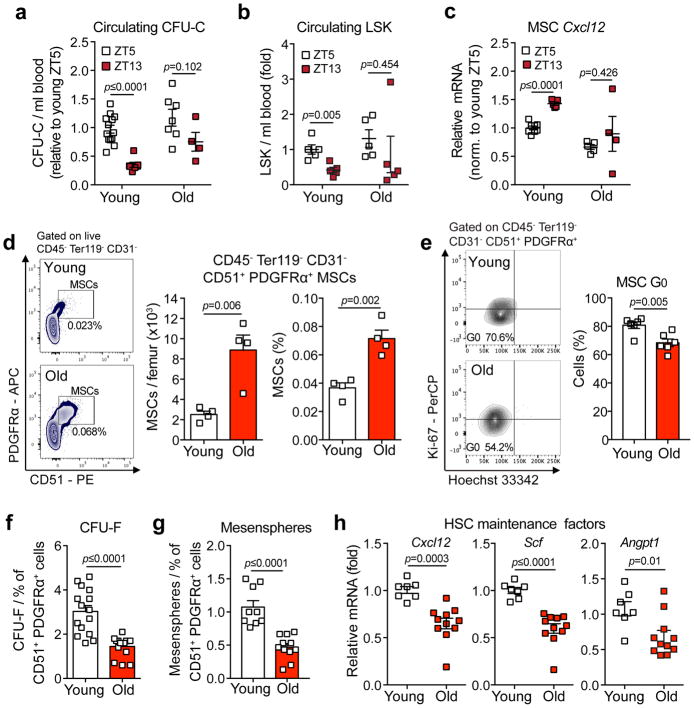
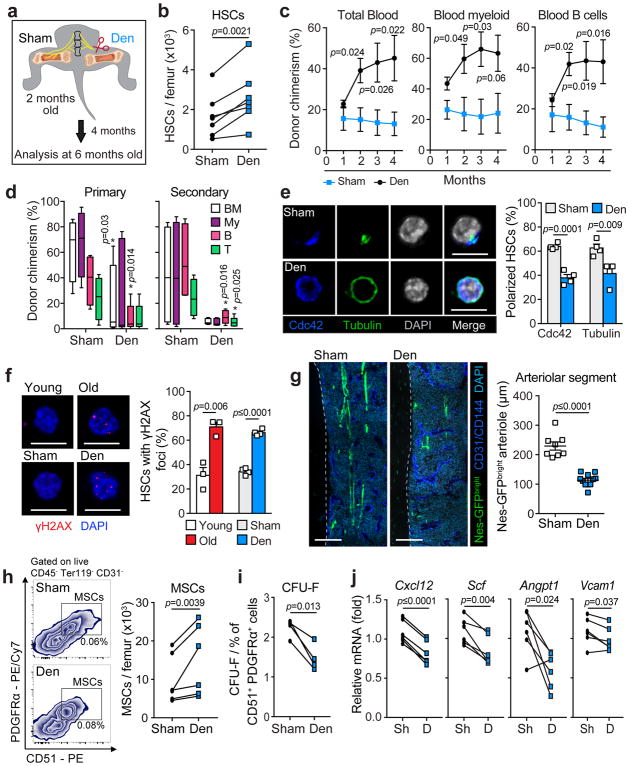
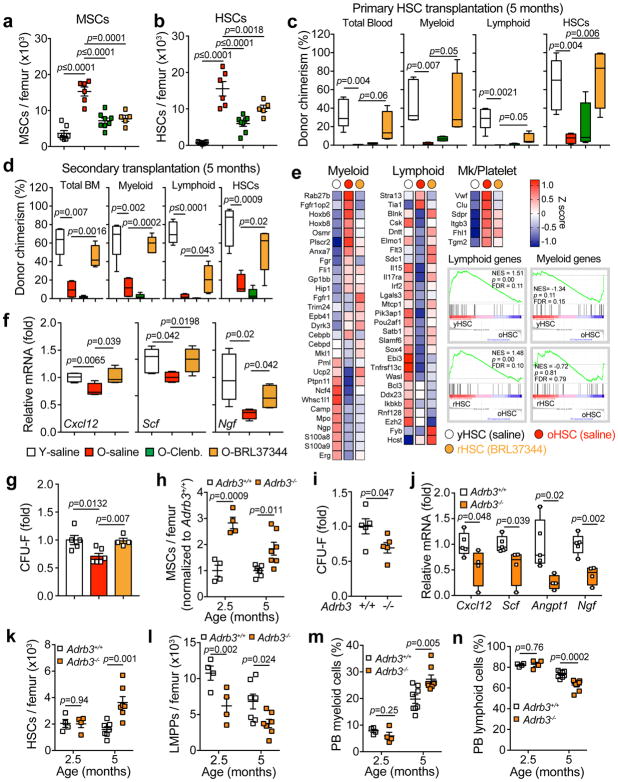
Aging of hematopoietic stem cells (HSCs) is associated with a decline in their regenerative capacity and multilineage differentiation potential, contributing to the development of blood disorders. The bone marrow microenvironment has recently been suggested to influence HSC aging, but the underlying mechanisms remain largely unknown. Here we show that HSC aging critically depends on bone marrow innervation by the sympathetic nervous system (SNS), as loss of SNS nerves or adrenoreceptor β3 signaling in the bone marrow microenvironment of young mice led to premature HSC aging, as evidenced by appearance of HSC phenotypes reminiscent of physiological aging. Strikingly, supplementation of a sympathomimetic acting selectively on adrenoreceptor β3 to old mice significantly rejuvenated the in vivo function of aged HSCs, suggesting that the preservation or restitution of bone marrow SNS innervation during aging may hold the potential for new HSC rejuvenation strategies.


Conflict of interest statement

Competing Financial Interests

The authors declare no competing financial interests.

Figures

Figure 1
Figure 1. Aging induces remodeling of the HSC niche
(a) Representative confocal z-stack projection montages of femurs from young (2 months) and old (20–24 months) Nestin-GFP mice stained for double positive CD31+/CD144+ vasculature and α-SMA+ cells with anti-CD31, anti-CD144 and anti-α-SMA antibodies. Scale bars, 500 μm for montages, 100 μm for zoomed projections, three independent experiments yielded similar results. (b) Vascular density in young and old mice, as assessed by quantification of CD31+/CD144+ double positive vascular area divided by total femur area (n=9 and 17 projections in young and old mice, respectively; 4 mice per group). (c) Arteriolar segment length in femurs of young and old Nestin-GFP mice, as assessed by quantification of the length of the Nestin-GFPbright signal covering CD31+/CD144+ double positive arterioles (n=11 and 6 projections in young and old mice, respectively; 4 mice per group). (d) α-SMA+ cell density in young and old mice, as assessed by quantification of α-SMA+ area divided by total femur area (1 projection per mouse in young (n=6) and old (n=3) mice). (e) Nestin-GFPbright density in young and old mice, as assessed by quantification of Nestin-GFPbright area divided by total femur area (n=9 and 17 projections in young and old mice, respectively; 4 mice per group) (f) Left, representative FACS plots of CD45 Ter119 CD31 Nes-GFPbright MSCs isolated from young (top) and old (bottom) Nestin-GFP mice. Right, the frequency of Nes-GFPbright MSCs from young and old Nestin-GFP mice (n=3 young, 4 old mice). (g) Representative whole-mount projections (inset) and quantification of the distribution of lineage CD41 CD48 CD150+ phenotypic HSCs in the sternal bone marrow relative to Nestin-GFPbright CD31+/CD144+ double positive arterioles in young and old C57BL/6 mice (n = 47 young HSCs; 148 old HSCs; 3 mice per group). Arrows denote HSCs. Two-sample Kolmogorov-Smirnov test, p = 0.0047. Scale bar, 100 μm. Data represented as mean ± s.e.m, p value determined by two-tailed t-test unless indicated otherwise.
Figure 2
Figure 2. Aging induces the loss of niche-associated adrenergic nerves
(a) Representative confocal z-stack projection montages from the bone marrow of young and old Nestin-GFP mice stained for CD31+ CD144+ double-positive vasculature and Tyrosine Hydroxylase (TH) positive nerve fibers. Scale bar, 500 μm. Arrows denote TH+ nerves. (b) Femoral adrenergic innervation quantified by TH+ area divided by total femur area (normalized to young; n=7 and 12 old projections in young and old mice, 4 mice per group). (c) Left, representative confocal z-stack projections from the bone marrow of young and old Nestin-GFP mice stained for CD31+ CD144+ double-positive vasculature and TH+ nerve fibers. Scale bar, 100 μm. Right arteriolar adrenergic innervation quantified by TH+ area divided by total Nestin-GFPbright arteriole area (normalized to young; n=4 and 10 projections in young and old mice, respectively; 4 mice per group). (d) Representative confocal z-stack projection montages from the femurs of young and old C57BL/6 mice stained for CD31+ CD144+ double-positive vasculature and β-III Tubulin+ nerve fibers. Scale bar, 500 μm. Arrows denote β-III Tubulin+ nerves. (e) Total femoral innervation quantified by β-III Tubulin+ area divided by total femur area (n=9 and 7 projections in young and old mice, respectively; 3 mice per group). (f) Left, representative confocal z-stack projections from femurs of young and old C57BL/6 mice stained for CD31+ CD144+ double-positive vasculature, β-III Tubulin+ nerve fibers and Synaptophysin+ synaptic vesicles. Scale bar, 100 μm. Right, synapse density as assessed by quantification of Synaptophysin+ area per β-III Tubulin+ nerve area (n=54 and 27 projections in young and old mice, respectively; 3 mice per group). Data represented as mean ± s.e.m, p value determined by two-tailed t-test. At least three independent experiments yielded similar results presented in (a) and (d). For box plots, the box spans from the 25th to 75th percentiles and the centerline is plotted at the median. Whiskers represent minimum to maximum range.
Figure 3
Figure 3. Aging expands MSCs and reduces their HSC maintenance activity
(a, b) Circadian oscillations of circulating CFU-C (normalized to young at ZT5; n=13 young ZT5, 7 old ZT5, 7 young ZT13 and 4 old ZT13 mice) (a) and lineage Sca-1+ c-Kit+ (LSK) progenitors (normalized to young at ZT5; n=5 mice per group) (b) in peripheral blood of young and old C57BL/6 mice. (c) Quantification of Cxcl12 mRNA levels relative to Actb in sorted MSCs from young and old C57BL/6 mice at ZT5 and ZT13 (normalized to young at ZT5; n=8 young ZT5, 5 old ZT5, 5 young ZT13 and 4 old ZT13 mice). (d) Left, representative FACS plots showing the gating strategy for CD45 Ter119 CD31 CD51+ PDGFRα+ MSCs in young (top) and old (bottom) C57BL/6 mice. Right, absolute numbers and frequency of MSCs in young and old C57BL/6 mice (n=4 mice per group). (e) Left, representative FACS plots showing the gating strategy for MSCs Ki-67 and Hoechst 33342 staining in young (top) and old (bottom) C57BL/6 mice. Right, quantification of Ki-67 G0 MSCs in young and old C57BL/6 mice (n=6 mice per group). (f, g) Frequency of CFU-F (n=15 cultures per group) (f) and mesenspheres (n=9 young, 11 old cultures) (g) from sorted MSCs plated at equal numbers and clonal densities under CFU-F or mesensphere culture conditions (n=5 mice per group). (h) Quantification of mRNA levels of Cxcl12, Scf and Angpt1 relative to Gapdh in sorted MSCs (normalized to young; n=7 young, 11 old mice). Data represented as mean ± s.e.m, p value determined by two-tailed t-test.
Figure 4
Figure 4. Surgical denervation of young bone marrow induces premature HSC and niche aging
(a) Schematic illustration of surgical denervation experiment. The sciatic and femoral nerves were transected in young (2 months old) C57BL/6 mice and the mice were analyzed 4 months post surgery, at 6 months of age. (b) Absolute numbers of HSCs (lineage Sca-1+ c-Kit+ CD48 CD150+) isolated from Sham and Denervated (Den) femurs (n=7 mice). (c, d) Total peripheral blood (CD45.2+), blood myeloid (Mac-1+ CD45.2+) and blood B cell (B220+ CD45.2+) donor chimerism at the indicated time points post transplantation (c) and bone marrow donor chimerism (Total CD45.2+ (BM); Myeloid (My), Mac-1+ CD45.2+; B cell (B), B220+ CD45.2+; and T cell (T), CD4+/CD8+ CD45.2+) 5 months after primary transplantation of 200 HSCs derived from either sham or denervated (Den) femurs and transplanted in competition with young BM competitor cells (n=4 sham, 6 denervated mice) (left) and 5 months after secondary transplantation of 3 × 10⁶ bone marrow from primary recipients (right) (d). (e) Left, representative confocal z-stack projections of HSCs sorted from sham or denervated femurs and stained with Cdc42, Tubulin and DAPI. Scale bar, 10 μm. Right, quantification of the percentage of Cdc42 and Tubulin polarized HSCs out of total HSCs scored (total of 356 sham and 353 denervated HSCs isolated from 4 mice per group). (f) Left, representative confocal z-stack projections of HSCs sorted from either young, old, sham or denervated femurs and stained with γH2AX and DAPI. Scale bar, 10 μm. Right, quantification of the percentage of HSCs with γH2AX foci (calculated as the mean percentage of a total of 164 young, 247 old, 381 sham and 355 Denervated HSCs isolated from 3 young, 3 old and 4 denervated mice). (g) Left, confocal z-stack projection montages from the femurs of sham and denervated tibiae from Nestin-GFP mice stained for CD31+/CD144+ double positive vasculature and DAPI. Scale bar, 500 μm. Right, assessment of arteriolar segment length as assessed by quantification of the length of the Nestin-GFPbright signal covering CD31+ CD144+ double-positive arteriole in sham and denervated tibiae (n=8 and 11 sham and denervated projections, respectively; 4 mice). (h) Left, representative gating strategy for FACS quantification and sorting of MSCs (CD45 Ter119 CD31 CD51+ PDGFRα+) in sham (top) and denervated (bottom) femurs. Right, quantification of MSCs isolated from sham and denervated femurs from denervated mice (n=6 mice). (i) Frequency of CFU-F from sorted MSCs from denervated femurs, plated at equal numbers at clonal densities under CFU-F culture conditions (n=4 mice). (j) Quantification of mRNA levels of Cxcl12, Scf, Angpt1 and Vcam1 relative to Gapdh in sorted MSCs derived from sham and denervated tibia (normalized to sham; n=6 mice). Data represented as mean ± s.e.m., p value determined by two-tailed paired t-test (b, hj) and two-tailed unpaired t-test (cg).
Figure 5
Figure 5. ADRβ3 signaling is essential for maintenance of aging HSCs
(a, b) Absolute numbers of MSCs (CD45 Ter119 CD31 CD51+ PDGFRα+) (a) and HSCs (lineage Sca-1+ c-Kit+ CD48 CD150+) (b) in young and old mice implanted with osmotic pumps containing either saline, the β2-adrenergic agonist clenbuterol or the β3-adrenergic agonist BRL37344 (n=7 young-saline, 6 old-saline, 8 old-clenbuterol and 5 old-BRL37344 mice). (c) Total blood chimerism (CD45.2+), blood myeloid chimerism (Mac-1+ CD45.2+), blood lymphoid chimerism (B220+ CD4+ CD8+ CD45.2+) and HSC chimerism (lineage Sca-1+ c-Kit+ CD48 CD150+ CD45.2+) in CD45.1 recipient mice transplanted with 200 HSCs, derived from the mice described in a and b, at 5 months after transplantation. (n= 5 young-saline, 4 old-saline, 4 old-clenbuterol and 4 old-BRL37344 mice). (d) Bone marrow chimerism following secondary bone marrow transplantation from the mice described in c, 5 months after transplantation. (n=5 young-saline, 4 old-saline, 5 old-clenbuterol and 5 old-BRL37344 mice). (e) Heat map of mean gene expression levels in young HSCs (yHSCs), old HSCs (oHSCs) and BRL37344 rejuvenated HSCs (rHSCs) (n=3 samples per group) of selected myeloid, lymphoid and megakaryocyte/platelet lineage genes and signature enrichment plots from GSEA using myeloid and lymphoid signature gene sets. Shown are the Normalized Enrichment Score (NES), p-value and false discovery rate (FDR) of the enrichment. (f) Quantification of mRNA levels of Cxcl12, Scf and Ngf relative to Actb in sorted MSCs derived from mice described in (ab) (n=5 young-saline, 4 old-saline and 4 old-BRL37344; normalized to young-saline). (g) CFU-F frequency from sorted MSCs derived from mice described in a and b (normalized to young-saline; n=5 young-saline, 6 old-saline and 4 old-BRL37344 mice). (h) Absolute numbers of MSCs from Adrb3+/+ and Adrb3−/− mice at 2.5 and 5 months of age (normalized to Adrb3+/+; n=4 mice per 2.5-month group, 6 Adrb3+/+, 7 Adrb3−/− per 5 month group). (i, j) CFU-F frequency from sorted MSCs (normalized to Adrb3+/+; n=5 mice per group) (i) and quantification of mRNA levels of Cxcl12, Scf, Angpt1 and Ngf relative to Gapdh in sorted MSCs (normalized to Adrb3+/+; n=5 and 4 Adrb3+/+ and Adrb3−/− mice respectively) (j) from 2.5 month old Adrb3+/+ and Adrb3−/− mice. (k–n) Absolute numbers of HSCs (k), LMPPs (lineage Sca-1+ c-Kit+ CD34+ Flt3+) (l), peripheral blood (PB) myeloid cells (Mac-1+ Gr-1+) (m) and lymphoid cells (B220+ CD4+ CD8+) cells (n) in Adrb3+/+ and Adrb3−/− mice at 2.5 and 5 months of age (n=4 mice per 2.5-month group, 7 (ki) and 8 (mn) per 5 month group). Data represented as mean ± s.e.m, p value determined by two-tailed t-test. For box plots, the box spans from the 25th to 75th percentiles and the centerline is plotted at the median. Whiskers represent minimum to maximum range.

Similar articles

Cited by

References

    1. López-Otín C, Blasco MA, Partridge L, Serrano M, Kroemer G. The Hallmarks of Aging. Cell. 2013;153:1194–1217. - PMC - PubMed
    1. Signer Robert AJ, Morrison Sean J. Mechanisms that Regulate Stem Cell Aging and Life Span. Cell Stem Cell. 2013;12:152–165. - PMC - PubMed
    1. Orkin SH, Zon LI. Hematopoiesis: An Evolving Paradigm for Stem Cell Biology. Cell. 2008;132:631–644. - PMC - PubMed
    1. Guidi N, Geiger H. Rejuvenation of aged hematopoietic stem cells. Seminars in Hematology. 2017;54:51–55. - PMC - PubMed
    1. Ho TT, et al. Autophagy maintains the metabolism and function of young and old stem cells. Nature. 2017;543:205. - PMC - PubMed

Publication types

MeSH terms

Substances