. 2018 May;24(5):556-562.
doi: 10.1038/s41591-018-0012-z. Epub 2018 May 7.

ARID1A deficiency promotes mutability and potentiates therapeutic antitumor immunity unleashed by immune checkpoint blockade

Affiliations

ARID1A deficiency promotes mutability and potentiates therapeutic antitumor immunity unleashed by immune checkpoint blockade

Jianfeng Shen et al. Nat Med. 2018 May.

Abstract

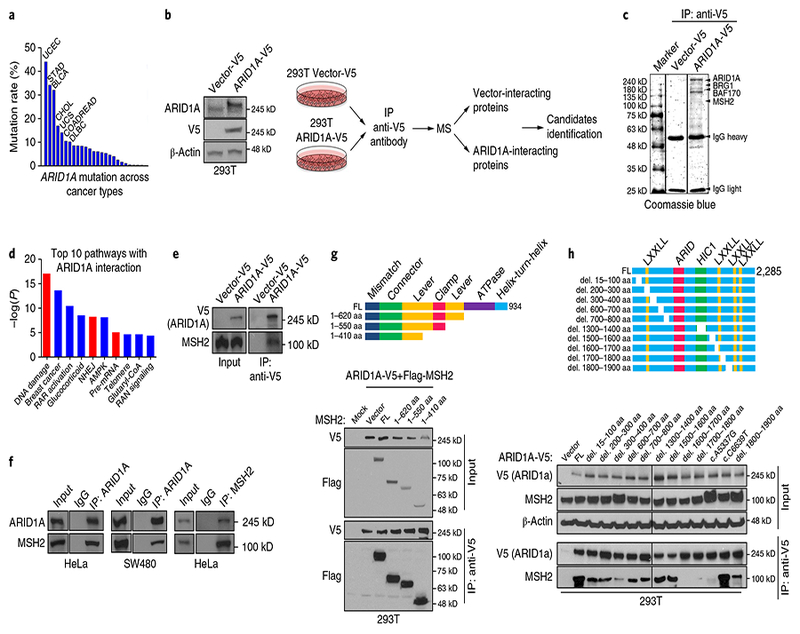
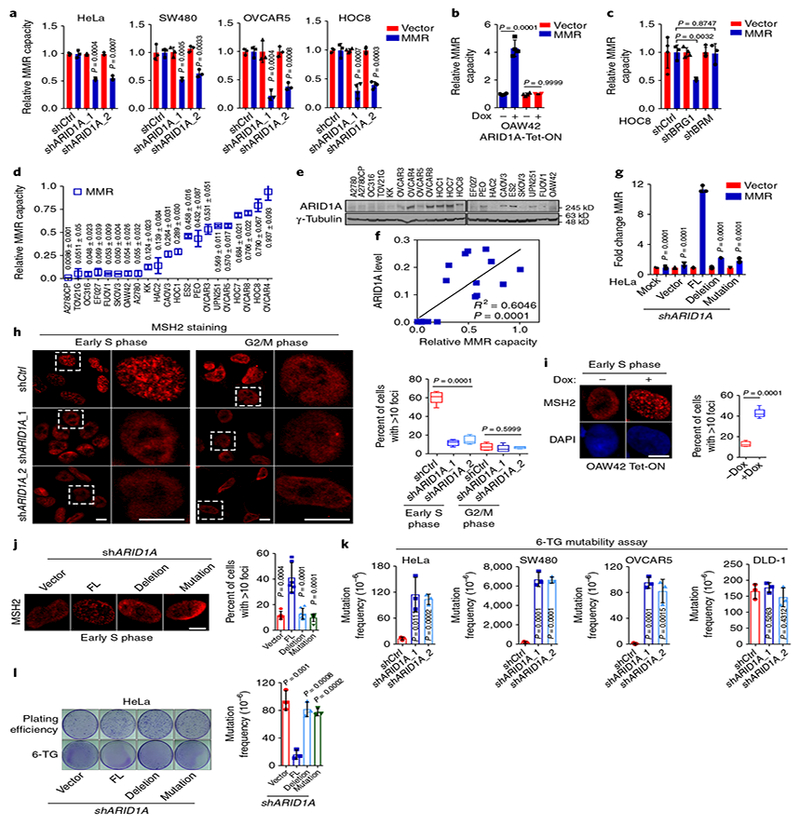
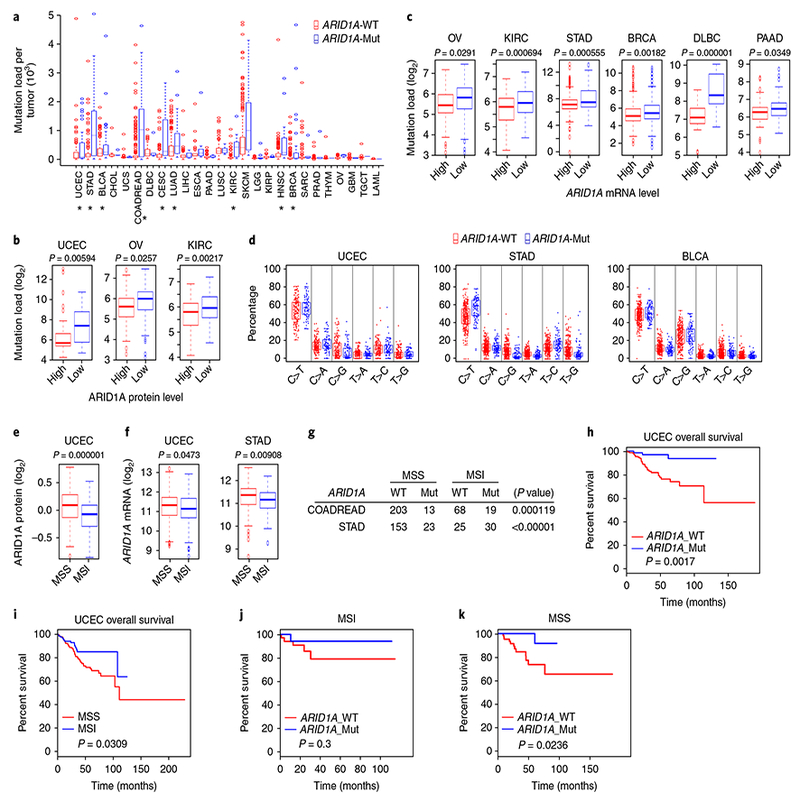
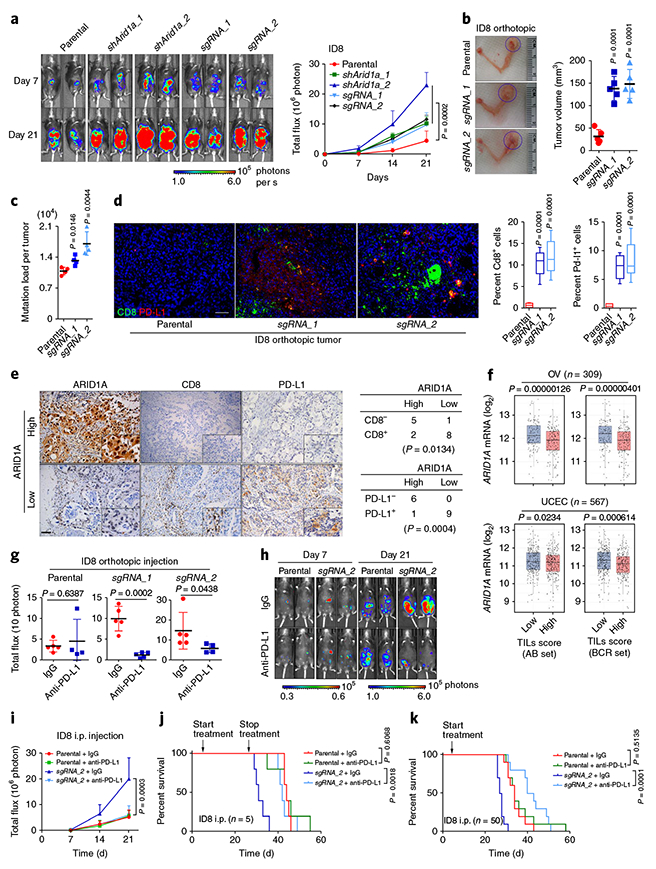
ARID1A (the AT-rich interaction domain 1A, also known as BAF250a) is one of the most commonly mutated genes in cancer1,2. The majority of ARID1A mutations are inactivating mutations and lead to loss of ARID1A expression 3 , which makes ARID1A a poor therapeutic target. Therefore, it is of clinical importance to identify molecular consequences of ARID1A deficiency that create therapeutic vulnerabilities in ARID1A-mutant tumors. In a proteomic screen, we found that ARID1A interacts with mismatch repair (MMR) protein MSH2. ARID1A recruited MSH2 to chromatin during DNA replication and promoted MMR. Conversely, ARID1A inactivation compromised MMR and increased mutagenesis. ARID1A deficiency correlated with microsatellite instability genomic signature and a predominant C>T mutation pattern and increased mutation load across multiple human cancer types. Tumors formed by an ARID1A-deficient ovarian cancer cell line in syngeneic mice displayed increased mutation load, elevated numbers of tumor-infiltrating lymphocytes, and PD-L1 expression. Notably, treatment with anti-PD-L1 antibody reduced tumor burden and prolonged survival of mice bearing ARID1A-deficient but not ARID1A-wild-type ovarian tumors. Together, these results suggest ARID1A deficiency contributes to impaired MMR and mutator phenotype in cancer, and may cooperate with immune checkpoint blockade therapy.


Conflict of interest statement

Competing interests

G.B.M. has received sponsored research support from Abbvie, AstraZeneca, Critical Outcomes Technology, Horizon Diagnostics, Illumina, Immunomet, Ionis, Karus Therapeutics, Nanostring, Pfizer, Takeda/Millennium Pharmaceuticals, and Tesaro; has ownership interest in Catena Pharmaceuticals, PTV Ventures, and Spindle Top Ventures; and is a consultant/advisory board member of AstraZeneca, Catena Pharmaceuticals, Critical Outcome Technologies, ImmunoMET, Ionis, Medimmune, Nuevolution, Pfizer, Precision Medicine, Signalchem Lifesciences, Symphogen, Takeda/Millennium Pharmaceuticals, and Tarveda. G.P. has received sponsored research support from Pifzer. No potential conflicts of interest were disclosed by the other authors.

Figures

Fig. 1 |
Fig. 1 |. ARID1A interacts with MSH2.
a, ARID1A mutation rate across cancer types in TCGA. Cancer types with mutation rate > 10% are shown; details in Supplementary Table 1. BLCA, urothelial bladder carcinoma; CHOL, cholangiocarcinoma; COADREAD, colon and rectal adnocarcinoma; DLBC, diffuse large B-cell lymphoma; STAD, stomach adenocarcinoma; UCS, uterine carcinonoma. b, Schematic of identification of ARID1A-interacting proteins using mass spectrometry in Vector-V5 and ARID1A-V5 expressing HEK 293 T cells. c, Coomassie blue staining of precipitates from anti-V5 immunoprecipitation (IP) in 293 T cells expressing empty vector or ARID1A-V5. Details in Supplementary Table 2. d, Ingenuity pathway analysis of AIRD1A-interacting proteins combining three immunoprecipitation/mass spectrometry results; details in Supplementary Table 3. RAR, retinoic acid receptor. e, Western blots of anti-V5 IP in vector-V5-expressing and ARID1A-V5-expressing 293 T cells. f, Western blots of endogenous IP and reciprocal IP with anti-ARID1A or anti-MSH2 antibodies in HeLa and SW480 cells. g, Top: schematic of MSH2 deletions. Bottom: IP of ARID1A with Flag-MSH2 containing indicated deletions in HEK 293 T cells. FL, full-length protein. h, Top: schematic of ARID1A deletions. Bottom: IP of ARID1A deletions (del.) with MSH2 in HEK 293 T cells. Experiments in b, c, and eh were repeated three times each. Uncropped blots are shown in Supplementary Fig. 12.
Fig. 2 |
Fig. 2 |. ARID1A deficiency promotes mutability through regulating MMR.
a, Relative MMR capacities in control (shCtrl) and ARID1A-knockdown cells. b, Relative MMR capacities in ARID1A-null OAW42 cells. c, Relative MMR capacity in HOC8 cells with BRG1 or BRM knockdown. d, Relative MMR capacities in 21 ovarian cancer cell lines. e, Representative western blots of ARID1A in 21 ovarian cancer cell lines from three independent experiments. Uncropped blots are shown in Supplementary Fig. 12. f, Correlation analysis of ARID1A protein levels in e with MMR capacities in d using linear regression analysis (n = 3 independent experiments). g, Relative MMR capacities in ARID1A-depleted HeLa cells reconstituted with wild-type or mutant ARID1A constructs. FL, full-length. Deletion, deletion of 1,700–1,800 aa. Mutation, A5337G. h, Immunocytochemistry and statistical analysis of MSH2 foci formation in control and ARID1A-knockdown HeLa cells. Dashed square, magnification of area. Early S phase, 1 h after thymidine release; G2/M phase, 8 h after thymidine release. Scale bars, 10 μ m. Data represent mean ± s.e.m. (Early S phage: shCtrl, 60.38 ± 2.976%, n = 250 cells; shARID1A_1, 12.05 ± 1.346%, n = 168 cells; shARID1A_2, 15.11 ± 1.891%, n = 121 cells; G2/M phage: shCtrl, 7.974 ± 1.597%, n = 345 cells; shARID1A_1, 6.008 ± 1.661%, n = 472 cells; shARID1A_2, 7.218 ± 0.47%, n = 179 cells; from 3 independent experiments; one-way ANOVA). i, MSH2 foci at early S phase in ARID1A-null OAW42 cells. Scale bars, 10 μ m. Data represent mean ± s.e.m. (without doxycycline (–dox): 13.02 ± 1.119%, n = 49 cells; with doxycycline (+ dox): 42.47 ± 1.804%, n = 35 cells; from 3 independent experiments, two-tailed t test.) j, MSH2 foci at early S phase in ARID1A-depleted HeLa cells reconstituted with wild-type or mutant ARID1A vectors. Scale bars, 10 μ m. (vector, n = 123 cells; FL, n = 101 cells; deletion, n = 151 cells; mutation, n = 177 cells; from 3 independent experiments; two-tailed t test compared with FL). k, Mutability assay in HeLa, SW480, OVCAR5, and DLD-1 cells. l, Mutability assay in ARID1A-depleted HeLa cells reconstituted with wild-type or mutant ARID1A constructs. Data represent mean ± s.e.m., n = 3 independent experiments, two-tailed t tests in ad, g, k, and l).
Fig. 3 |
Fig. 3 |. ARID1A deficiency is associated with a MMR-defective mutator phenotype.
a, Mutation load in ARID1A-wild-type (WT) and ARID1Amutant (Mut) tumors from 26 cancer types. Cancer types with statistically significant differences between ARID1A-WT and ARID1A-Mut indicated by * (two-tailed t test); P values are shown in Supplementary Table 4. b, log2-valued mutation load in tumors with high or low ARID1A expression as determined by reverse-phase protein array. (uterine corpus endometrial carcinoma (UCEC), n = 198, high: 6.330906042, low: 7.294436325, standard error = 0.158625399; ovarian cancer (OV), n = 308, high: 5.471777482, low: 5.792463647, standard error = 0.049291046; KIRC, n = 313, high: 5.711217867, low: 6.037558673, standard error = 0.038347266; two-tailed t test). c, log2-valued mutation load in tumors with high or low ARID1A expression as determined by RNA-seq. (OV, n = 235, high: 5.47945417, low: 5.724745595, standard error = 0.056062231; KIRC, n = 436, high: 5.894734029, low: 6.211603408, standard error = 0.046937789; STAD, n = 371, high: 7.360502308, low: 7.984473751, standard error = 0.09068629; BRCA, n = 966, high: 5.346146074, low: 5.601771093, standard error = 0.041060948; DLBC, n = 48, high: 7.056759879, low: 8.517913502, standard error = 0.166581137; PAAD, n = 146, high: 6.284940848, low: 6.610659751, standard error = 0.077254816; two-tailed t test) d, Distribution of six types of mutation in ARID1A-WT and ARID1A-Mut tumors. C-to-T mutation: UCEC (n = 243, WT: 53.35262679%, Mut: 56.36623983%, standard error = 0.844758609, P = 0.047385754, two-tailed t test), STAD (n = 391, WT: 47.24396225%, Mut: 56.08073032%, standard error = 0.681799469, P = 2.49 × 10⁻⁹, two-tailed t test), and BLCA (n = 395, WT: 48.27947629%, Mut: 51.12505553%, standard error = 0.465674252, P = 0.003983508; two-tailed t test). e, ARID1A protein levels in MSS tumors and tumors with MSI from UCEC patients (n = 311, MSS: 0.085079362, MSI: –0.087844869, standard error = 0.017715104; two-tailed t test). f, ARID1A mRNA levels in MSS tumors and tumors with MSI from UCEC and STAD patients (UCEC, n = 426, MSS: 11.26773514, MSI: 11.11618424, standard error = 0.034736899, two-tailed t test; STAD, n = 260, MSS: 11.31157188, MSI: 11.10788881, standard error = 0.034995948, two-tailed t test). g, Association of MSS and MSI with ARID1A mutation status in COADREAD and STAD tumors as determined by χ2 analysis (COADREAD, n = 303; STAD, n = 231). h, Overall survival in UCEC patients with ARID1A-WT and ARID1A-Mut tumors (WT: n = 161, Mut: n = 82, log-rank (Mantel–Cox) test). i, Overall survival in UCEC patients with MSS tumors and tumors with MSI (MSS: n = 284; MSI: n = 153, log-rank (Mantel–Cox) test). j,k, Overall survival by ARID1A mutation status in UCEC patients with MSI tumors (ARID1A_WT: n = 36; ARID1A_Mut: n = 21, log-rank (Mantel–Cox) test) and MSS tumors (ARID1A_WT: n = 71; ARID1A_Mut: n = 38, log-rank (Mantel–Cox) test).
Fig. 4 |
Fig. 4 |. ARID1A-deficient tumors display increased TILs, activation of immune checkpoint, and sensitization to immune checkpoint blockade therapy.
a, Representative bioluminescence images of mice bearing control and Arid1a-deficient tumors formed by intraperitoneal (i.p.) injection of parental and Arid1a-depleted ID8 cells. The graph shows the change in bioluminescence in mice over time. Data represent mean ± s.e.m. (endpoint: parental, 4.487 ± 3.238 (n = 5); shArid1a_1, 10.227 ± 2.181 (n = 5); shArid1a_2, 22.873 ± 4.201 (n = 5); sgRNA_1, 9.732 ± 4.0625 (n = 5); sgRNA_2, 11.583 ± 1.364 (n = 5); one-way ANOVA). Uncropped blots are shown in Supplementary Fig. 13. b, Representative images of ID8 tumors formed by intrabursal injection of ID8 cells (30 d after inoculation) and corresponding tumor volume (parental, n = 5 mice, 32.7 ± 6.888 mm3; sgRNA_1, n = 5 mice, 138.5 ± 11.86 mm3; sgRNA_2, n = 5 mice, 148.8 ± 14.25 mm3; two-tailed t test compared with parental). c, Mutation burden in ID8 tumors formed by intrabursal injection of parental and Arid1a-depleted ID8 cells as determined by whole-exome sequencing (parental, n = 4 mice, 1.091 ± 0.04266; sgRNA_1, n = 4 mice, 1.322 ± 0.05276; sgRNA_2, n = 4 mice, 1.706 ± 0.132; two-tailed t test compared with parental). d, Cd8 and PD-L1 immunohistochemistry (IHC) staining in ID8 orthotopic tumors and H-score analysis (parental, n = 5 mice, 0.7526 ± 0.1911%; sgRNA_1, n = 5 mice, 10.45 ± 1.012%; sgRNA_2, n = 5 mice, 12.08 ± 1.378%, two-tailed t test compared with parental). Scale bar, 100 μ m. e, IHC staining of ARID1A, CD8, and PD-L1 in ovarian cancer patient specimens (n = 16; 8 cases of ovarian serous adenocarcinoma and 8 cases of ovarian clear cell carcinoma (OCCC)). The χ2 association analysis is shown. Scale bar, 100 μ m. f, Association of TILs with ARID1A expression in OV and UCEC patient samples as analyzed by two TIL signatures (AB set and BCR set). Data represent mean ± s.e.m. (OV, n = 309, AB set: low, mean = 12.15276888, 95% confidence interval: 12.05091684–12.25462092; high, mean = 11.84214927, 95% confidence interval: 11.748771–11.93552755, two-tailed t test; BCR set: low, mean = 12.15367094, 95% confidence interval: 12.04573576–12.26160613; high, mean = 11.85680455, 95% confidence interval: 11.7668279–11.94678121, two-tailed t test; UCEC, n = 567, AB set: low, mean = 11.26615124, 95% confidence interval: 11.18430059–11.34800189; high, mean = 11.13324207, 95% confidence interval: 11.05226376–11.21422038, two-tailed t test; BCR set: low, mean = 11.29127279, 95% confidence interval: 11.21167643–11.37086914; high, mean = 11.09105846, 95% confidence interval: 11.00889521–11.17322171; two-tailed t test). g, Endpoint bioluminescence of mice bearing ID8 orthotopic tumors after 21 d of IgG or anti-PD-L1 treatment (parental + IgG, n = 5 mice, 3.403 ± 0.6162; parental + anti-PD-L1, n = 4 mice, 4.575 ± 2.599; sgRNA_1 + IgG, n = 5 mice, 9.853 ± 1.315; sgRNA_1 + anti-PD-L1, n = 5 mice, 1.133 ± 0.279; sgRNA_2 + IgG, n = 5 mice, 16.08 ± 3.605; sgRNA_2 + anti-PD-L1, n = 4 mice, 5.767 ± 1.103; two-tailed t tests). h, Representative bioluminescence images of IgG- or anti-PD-L1-treated mice bearing ID8 i.p. tumors. i, Changes in bioluminescence over time (day 21, parental + IgG, n = 5 mice, 5.249 ± 1.236%; parental + anti-PD-L1, n = 5 mice, 5.699 ± 0.9666%; sgRNA_2 + IgG, n = 5 mice, 20.04 ± 3.65%; sgRNA_2 + anti-PD-L1, n = 5 mice, 6.149 ± 1.58%, one-way ANOVA). j, Survival curves of mice with ID8 i.p. tumors. Treatment was started on day 7 of inoculation and stopped on day 28 (n = 5 mice per group, log-rank (Mantel–Cox) test). k, Survival curves of mice with ID8 i.p. tumors. Treatment was started on day 7 and continued until the mice were killed for analysis (n = 10 mice per group, log-rank (Mantel–Cox) test).

Similar articles

Cited by

References

    1. Wilson BG & Roberts CW SWI/SNF nucleosome remodellers and cancer. Nat. Rev. Cancer 11, 481–492 (2011). - PubMed
    1. Wu JN & Roberts CW ARID1A mutations in cancer: another epigenetic tumor suppressor? Cancer Discov. 3, 35–43 (2013). - PMC - PubMed
    1. Wu RC, Wang TL & Shih Ie. M. The emerging roles of ARID1A in tumor suppression. Cancer Biol. Ther 15, 655–664 (2014). - PMC - PubMed
    1. Wang X et al. Expression of p270 (ARID1A), a component of human SWI/SNF complexes, in human tumors. Int. J. Cancer 112, 636 (2004). - PubMed
    1. Wang X et al. Two related ARID family proteins are alternative subunits of human SWI/SNF complexes. Biochem. J 383, 319–325 (2004). - PMC - PubMed

Publication types