. 2018 Mar 15:2018:1794524.
doi: 10.1155/2018/1794524. eCollection 2018.

Gastric Cancer Maximum Tumour Diameter Reduction Rate at CT Examination as a Radiological Index for Predicting Histopathological Regression after Neoadjuvant Treatment: A Multicentre GIRCG Study

Affiliations

Gastric Cancer Maximum Tumour Diameter Reduction Rate at CT Examination as a Radiological Index for Predicting Histopathological Regression after Neoadjuvant Treatment: A Multicentre GIRCG Study

Maria Antonietta Mazzei et al. Gastroenterol Res Pract. .

Abstract

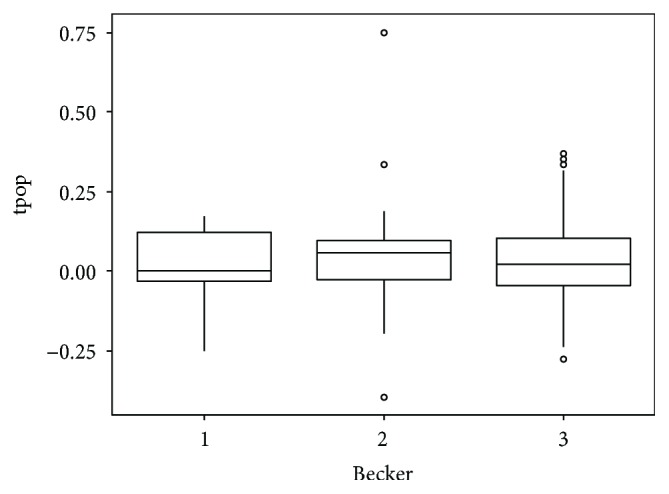
Aim: To investigate the role of maximum tumour diameter (D-max) reduction rate at CT examination in predicting histopathological tumour regression grade (TRG according to the Becker grade), after neoadjuvant chemotherapy (NAC), in patients with resectable advanced gastric cancer (AGC).

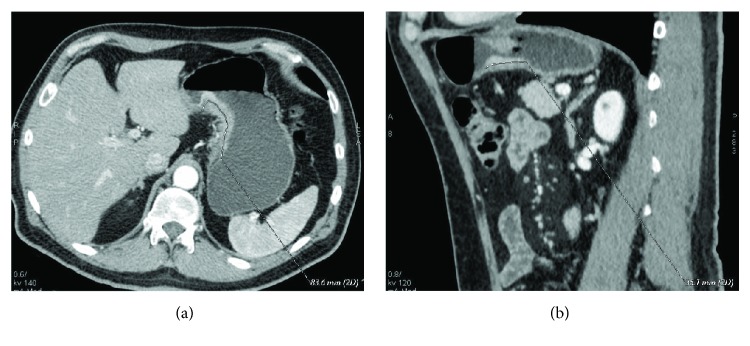
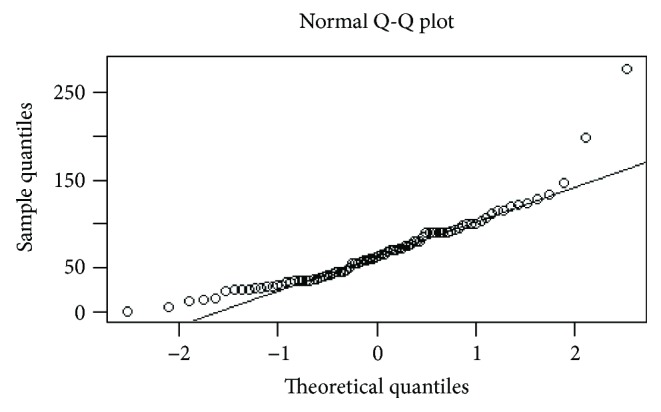
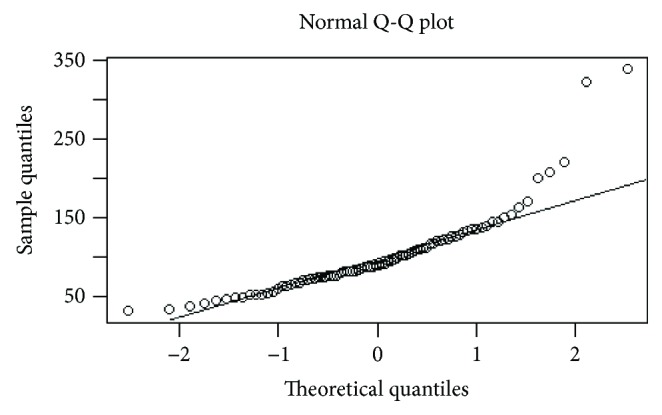
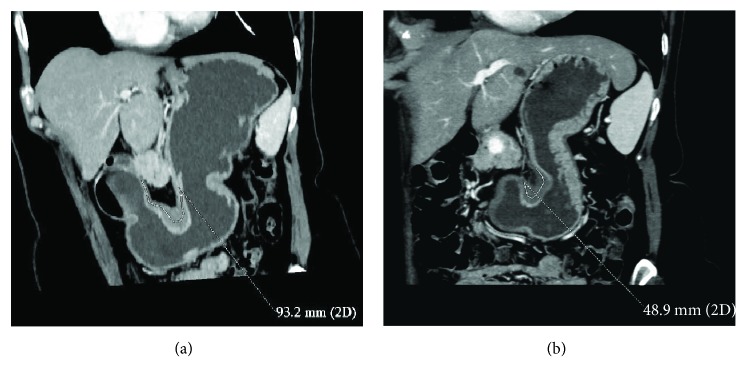
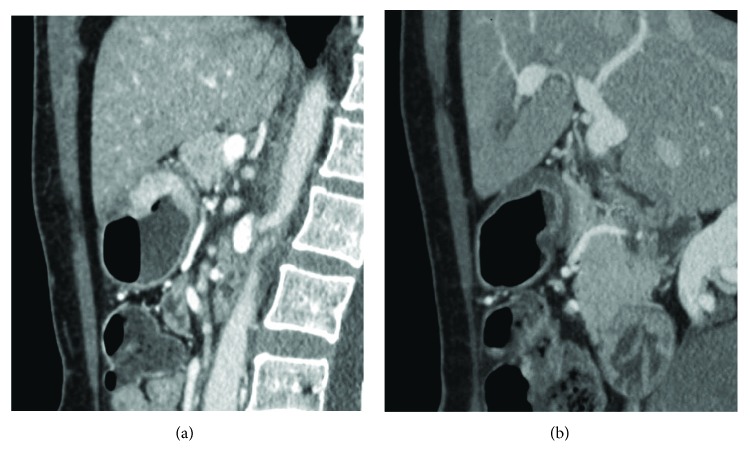
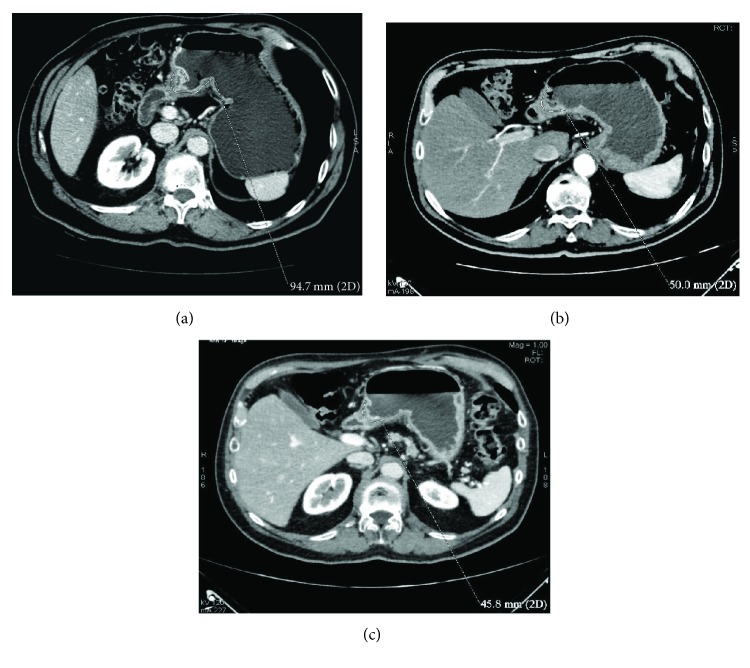
Materials and methods: Eighty-six patients (53 M, mean age 62.1 years) with resectable AGC (≥T3 or N+), treated with NAC and radical surgery, were enrolled from 5 centres of the Italian Research Group for Gastric Cancer (GIRCG). Staging and restaging CT and histological results were retrospectively reviewed. CT examinations were contrast enhanced, and the stomach was previously distended. The D-max was measured using 2D software and compared with Becker TRG. Statistical data were obtained using "R" software.

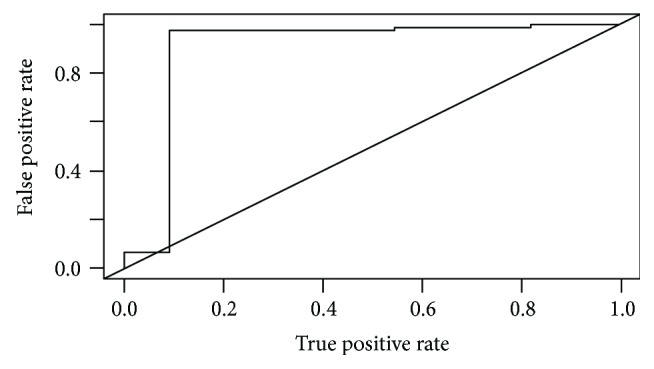
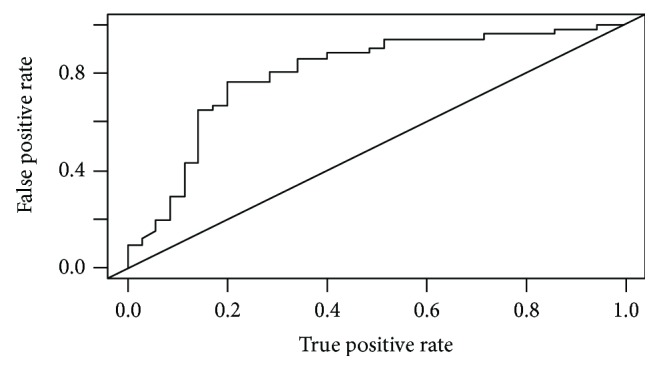
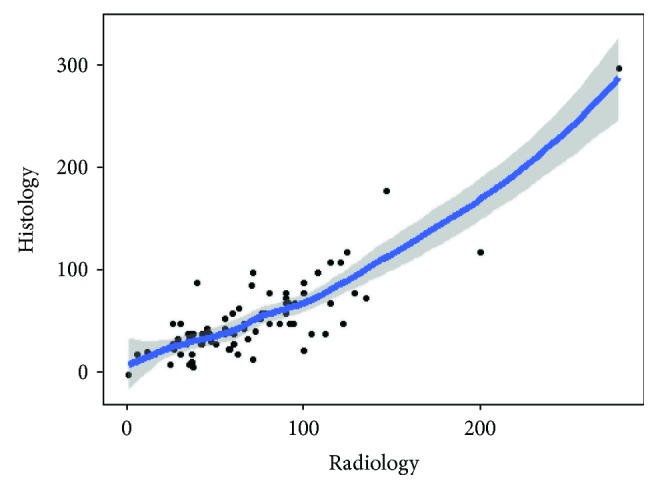
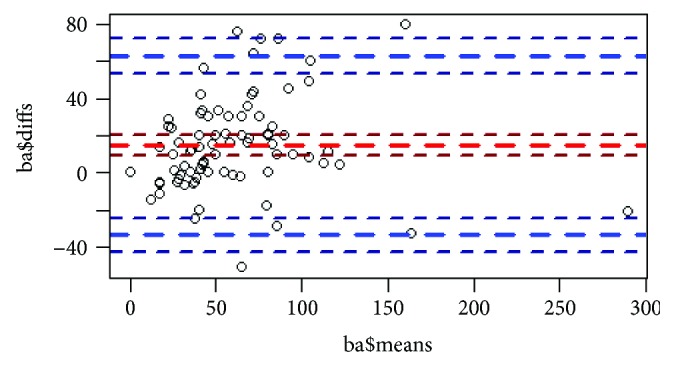
Results: The interobserver agreement was good/very good. Becker TRG was predicted by CT with a sensitivity and specificity, respectively, of 97.3% and 90.9% for Becker 1 (D-max reduction rate > 65.1%), 76.4% and 80% for Becker 3 (D-max reduction rate < 29.9%), and 70.8% and 83.9% for Becker 2. Correlation between radiological and histological D-max measurements was strongly confirmed by the correlation index (c.i.= 0.829).

Conclusions: D-max reduction rate in AGC patients may be helpful as a simple and reproducible radiological index in predicting TRG after NAC.


Figures

Figure 1
Figure 1
(a, b) Staging (a) and restaging (b) CTs after NAC in a 63-year-old male with a mixed GC. D-max was measured in 2 different planes, respectively, axial oblique in (a), D-max 83.6 mm, and sagittal in (b), D-max 35.1 mm, in order to identify the maximum tumour extension.
Figure 2
Figure 2
Distribution of D-max values before neoadjuvant chemotherapy: QQ plot demonstrates a nonnormal distribution.
Figure 3
Figure 3
Distribution of D-max values just before surgery: QQ plot demonstrates a nonnormal distribution.
Figure 4
Figure 4
Box plot of D-max values before and after NAC.
Figure 5
Figure 5
ROC curve of D-max reduction rate to predict Becker grade 1.
Figure 6
Figure 6
ROC curve of D-max reduction rate to predict Becker grade 3.
Figure 7
Figure 7
(a, b) GC cancer of the angulus (diffuse histotype) in a 69-year-old woman. TRG 2 was found on final pathology after NAC. Tumour D-max reduction rate (47.5%), between CT before (a) and after NAC (b), correctly identified TRG.
Figure 8
Figure 8
Box plot showing Hounsfield unit (HU) analysis. HUs were normalised through the ratio between the lesion and aorta HU. Values in the y-axis were obtained from the ratio between HU before and after NAC, whereas values in the x-axis show the Becker grade.
Figure 9
Figure 9
(a, b) A 65-year-old man with GC of the antrum (diffuse histotype). After NAC (b), lesion enhancement is significantly lower than before (a), whereas D-max is substantially unchanged. Patient was correctly classified as TRG 3 on final pathology.
Figure 10
Figure 10
(a–c) Comparison between staging CT (a), intermediate (b) and presurgical (c) CTs in a 71-year-old man with GC (intestinal histotype) located in the antrum and body, along the lesser curvature. It was clear how D-max reduction rate was greater after 2 cycles of chemotherapy ((a) versus (b), 47.2%) than in the remainder of the treatment ((b) versus (c), 10%).
Figure 11
Figure 11
Nonparametric regression; histological versus radiological D-max measurements.
Figure 12
Figure 12
Bland-Altman plot: the casual distribution of the points demonstrates that radiological and pathological D-max measurement methods are theoretically interchangeable.

Similar articles

Cited by

References

    1. Amin M. B., Edge S., Greene F., et al. AJCC Cancer Staging Manual. 8th. New York, NY, USA: Springer; 2017.
    1. Roder J. D., Böttcher K., Siewert J. R., et al. Prognostic factors in gastric carcinoma. Results of the German gastric carcinoma study 1992. Cancer. 1993;72(7):2089–2097. doi: 10.1002/1097-0142(19931001)72:7<2089::AID-CNCR2820720706>3.0.CO;2-H. - DOI - PubMed
    1. Cunningham D., Allum W. H., Stenning S. P., et al. Perioperative chemotherapy versus surgery alone for resectable gastroesophageal cancer. The New England Journal of Medicine. 2006;355(1):11–20. doi: 10.1056/NEJMoa055531. - DOI - PubMed
    1. De Manzoni G., Marrelli D., Baiocchi G. L., et al. The Italian Research Group for Gastric Cancer (GIRCG) guidelines for gastric cancer staging and treatment: 2015. Gastric Cancer. 2017;20(1):20–30. doi: 10.1007/s10120-016-0615-3. - DOI - PubMed
    1. Ychou M., Boige V., Pignon J. P., et al. Perioperative chemotherapy compared with surgery alone for resectable gastroesophageal adenocarcinoma: an FNCLCC and FFCD multicenter phase III trial. Journal of Clinical Oncology. 2011;29(13):1715–1721. doi: 10.1200/JCO.2010.33.0597. - DOI - PubMed

LinkOut - more resources