

Sound Frequency Representation in the Auditory Cortex of the Common Marmoset Visualized Using Optical Intrinsic Signal Imaging
- PMID: 29736410
- PMCID: PMC5937112
- DOI: 10.1523/ENEURO.0078-18.2018
Sound Frequency Representation in the Auditory Cortex of the Common Marmoset Visualized Using Optical Intrinsic Signal Imaging
Abstract
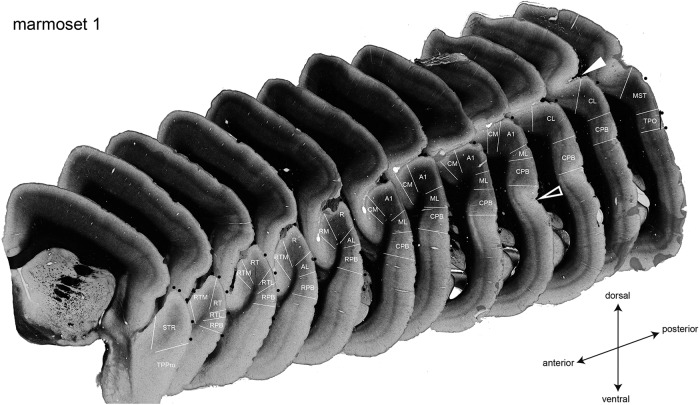
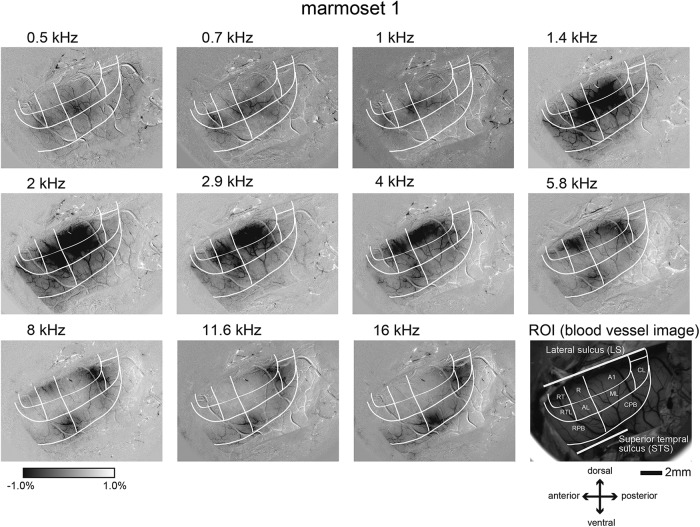
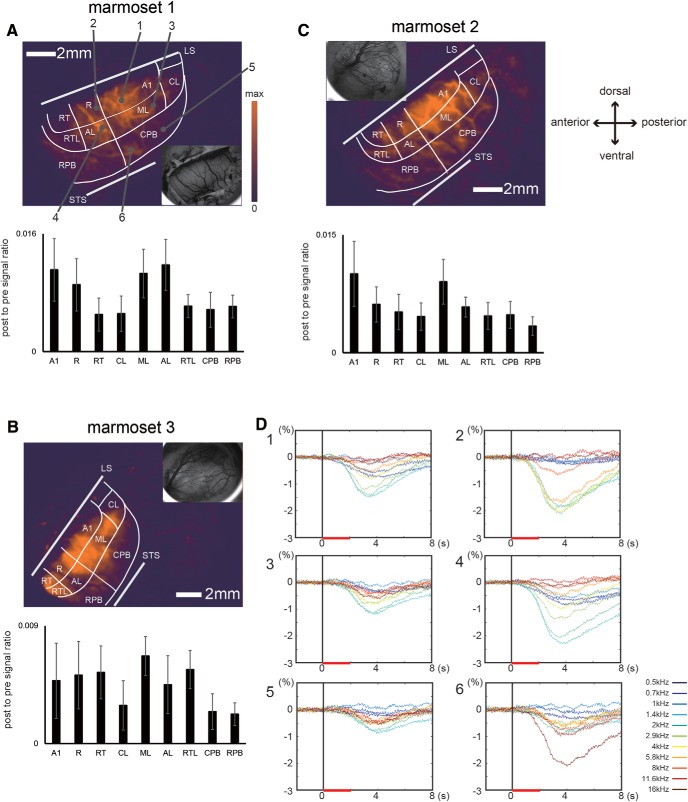
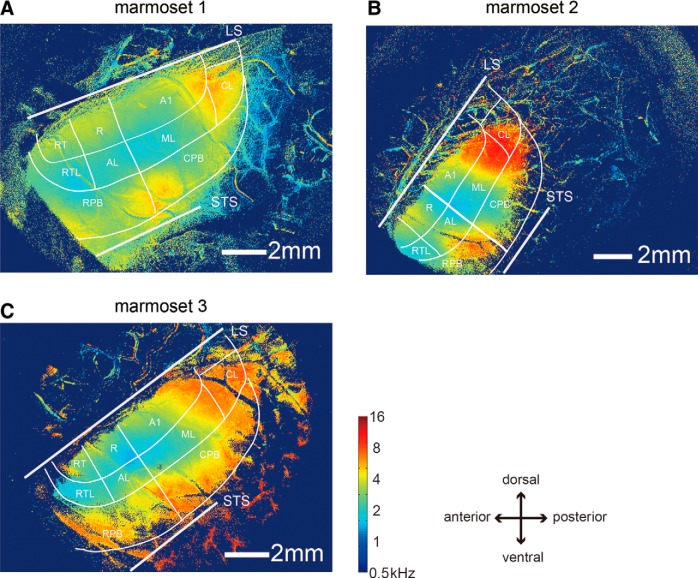
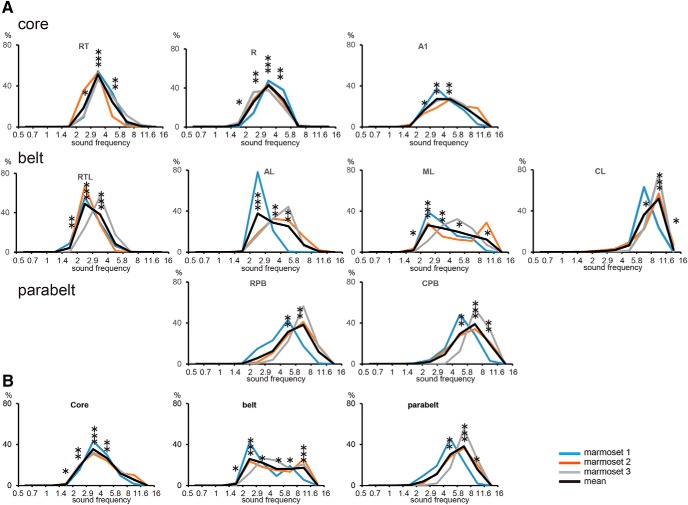
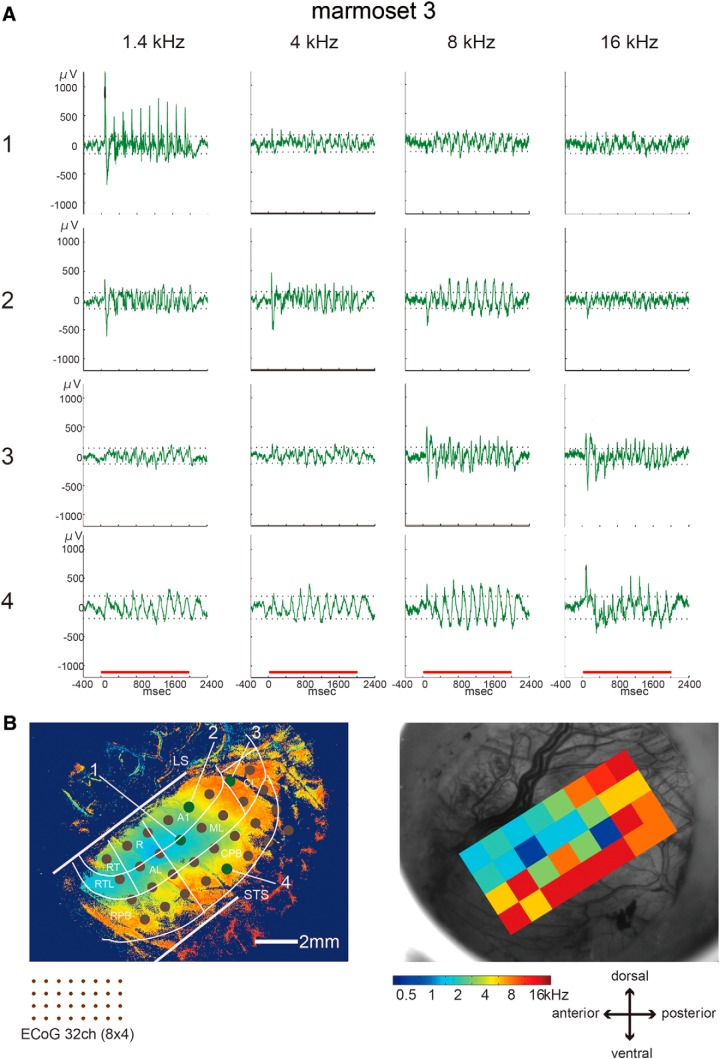
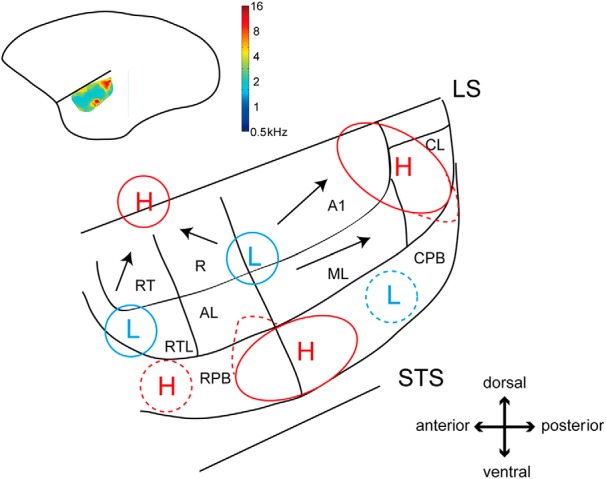
Natural sound is composed of various frequencies. Although the core region of the primate auditory cortex has functionally defined sound frequency preference maps, how the map is organized in the auditory areas of the belt and parabelt regions is not well known. In this study, we investigated the functional organizations of the core, belt, and parabelt regions encompassed by the lateral sulcus and the superior temporal sulcus in the common marmoset (Callithrix jacchus). Using optical intrinsic signal imaging, we obtained evoked responses to band-pass noise stimuli in a range of sound frequencies (0.5-16 kHz) in anesthetized adult animals and visualized the preferred sound frequency map on the cortical surface. We characterized the functionally defined organization using histologically defined brain areas in the same animals. We found tonotopic representation of a set of sound frequencies (low to high) within the primary (A1), rostral (R), and rostrotemporal (RT) areas of the core region. In the belt region, the tonotopic representation existed only in the mediolateral (ML) area. This representation was symmetric with that found in A1 along the border between areas A1 and ML. The functional structure was not very clear in the anterolateral (AL) area. Low frequencies were mainly preferred in the rostrotemplatal (RTL) area, while high frequencies were preferred in the caudolateral (CL) area. There was a portion of the parabelt region that strongly responded to higher sound frequencies (>5.8 kHz) along the border between the rostral parabelt (RPB) and caudal parabelt (CPB) regions.
Keywords: ECoG; histology; marmoset; optical imaging; sound frequency; tonotopy.
Figures
Similar articles
-
Organization of auditory areas in the superior temporal gyrus of marmoset monkeys revealed by real-time optical imaging.Brain Struct Funct. 2018 May;223(4):1599-1614. doi: 10.1007/s00429-017-1574-0. Epub 2017 Nov 28. Brain Struct Funct. 2018. PMID: 29185107
-
Cortical connections of auditory cortex in marmoset monkeys: lateral belt and parabelt regions.Anat Rec (Hoboken). 2012 May;295(5):800-21. doi: 10.1002/ar.22451. Epub 2012 Mar 28. Anat Rec (Hoboken). 2012. PMID: 22461313 Free PMC article.
-
Cortical connections of the auditory cortex in marmoset monkeys: core and medial belt regions.J Comp Neurol. 2006 May 1;496(1):27-71. doi: 10.1002/cne.20923. J Comp Neurol. 2006. PMID: 16528722
-
Functional imaging of human auditory cortex.Curr Opin Otolaryngol Head Neck Surg. 2009 Oct;17(5):407-11. doi: 10.1097/MOO.0b013e3283303330. Curr Opin Otolaryngol Head Neck Surg. 2009. PMID: 19633556 Review.
-
Subdivisions of auditory cortex and levels of processing in primates.Audiol Neurootol. 1998 Mar-Jun;3(2-3):73-85. doi: 10.1159/000013783. Audiol Neurootol. 1998. PMID: 9575378 Review.
Cited by
-
Local homogeneity of tonotopic organization in the primary auditory cortex of marmosets.Proc Natl Acad Sci U S A. 2019 Feb 19;116(8):3239-3244. doi: 10.1073/pnas.1816653116. Epub 2019 Feb 4. Proc Natl Acad Sci U S A. 2019. PMID: 30718428 Free PMC article.
-
Chronic cranial window for photoacoustic imaging: a mini review.Vis Comput Ind Biomed Art. 2021 May 26;4(1):15. doi: 10.1186/s42492-021-00081-1. Vis Comput Ind Biomed Art. 2021. PMID: 34037873 Free PMC article. Review.
-
An open access resource for marmoset neuroscientific apparatus.Imaging Neurosci (Camb). 2025 Feb 21;3:imag_a_00483. doi: 10.1162/imag_a_00483. eCollection 2025. Imaging Neurosci (Camb). 2025. PMID: 40800752 Free PMC article.
-
Effects of Ketamine Administration on Auditory Information Processing in the Neocortex of Nonhuman Primates.Front Psychiatry. 2020 Aug 19;11:826. doi: 10.3389/fpsyt.2020.00826. eCollection 2020. Front Psychiatry. 2020. PMID: 32973576 Free PMC article.
-
A silent two-photon imaging system for studying in vivo auditory neuronal functions.Light Sci Appl. 2022 Apr 14;11(1):96. doi: 10.1038/s41377-022-00783-y. Light Sci Appl. 2022. PMID: 35422090 Free PMC article.
References
-
- Abe H, Tani T, Mashiko H, Kitamura N, Miyakawa N, Mimura K, Sakai K, Suzuki W, Kurotani T, Mizukami H, Watakabe A, Yamamori T, Ichinohe N (2017) 3D reconstruction of brain section images for creating axonal projection maps in marmosets. J Neurosci Methods 286:102–113. 10.1016/j.jneumeth.2017.04.016 - DOI - PubMed
Publication types
MeSH terms
LinkOut - more resources
Full Text Sources
Other Literature Sources