. 2018 May 4;4(5):eaap9416.
doi: 10.1126/sciadv.aap9416. eCollection 2018 May.

Attosecond-resolution Hong-Ou-Mandel interferometry

Affiliations

Attosecond-resolution Hong-Ou-Mandel interferometry

Ashley Lyons et al. Sci Adv. .

Abstract

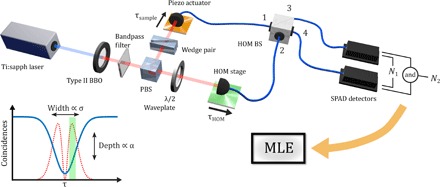
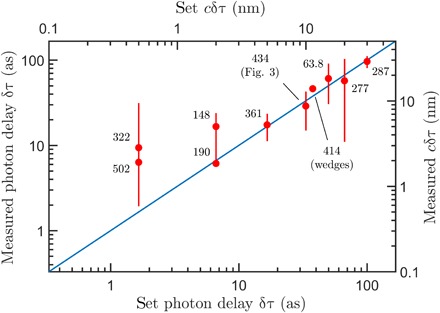
When two indistinguishable photons are each incident on separate input ports of a beamsplitter, they "bunch" deterministically, exiting via the same port as a direct consequence of their bosonic nature. This two-photon interference effect has long-held the potential for application in precision measurement of time delays, such as those induced by transparent specimens with unknown thickness profiles. However, the technique has never achieved resolutions significantly better than the few-femtosecond (micrometer) scale other than in a common-path geometry that severely limits applications. We develop the precision of Hong-Ou-Mandel interferometry toward the ultimate limits dictated by statistical estimation theory, achieving few-attosecond (or nanometer path length) scale resolutions in a dual-arm geometry, thus providing access to length scales pertinent to cell biology and monoatomic layer two-dimensional materials.


Figures

Fig. 1
Fig. 1. Dual-arm HOM interferometer.
A pumped type II BBO crystal is used as a source of SPDC photon pairs, which are separated by a polarizing BS (PBS) before being subject to a differential time delay and recombination on separate input ports (1 and 2) of a fiber-coupled 50:50 BS (HOM BS). Coarse control of the optical delay is achieved by a motorized translation stage (HOM stage, controlling τHOM), whereas fine control is achieved using a piezo actuator (controlling τsample and representing a transparent sample). From a scan of the HOM dip (bottom left, blue), a peak in the Fisher information (red) is identified to be used in the sensing procedure (green). The difference in temporal delay between the two photons (τ: = τsample − τHOM) is quantified through MLE. Typical measured photon pair rates were on the order of 30,000 counts s−1 with an estimated loss rate of 87%. SPAD, single-photon avalanche photodiodes.
Fig. 2
Fig. 2. Experimental HOM dips (left axis) are shown for various visibilities, introduced by a differential polarization change.
The estimated total Fisher information NF (Eq. 2; right axis, red) along with the inverse variance of our experimental estimates are shown (gray crosses, right axis). The rightmost panel includes theoretical curves for perfect visibility, where the two peaks in the Fisher information have asymptotically merged. The open circle denotes a point where the Fisher information is undefined.
Fig. 3
Fig. 3. Example of an acquired experimental data set.
(A) Individual estimates of τin (blue) and τout (red) for two piezo positions separated by 10 nm (33.3 as). A relatively large drift can be seen in the data, which is dealt with by switching between piezo positions as discussed above. (B) The histogram shows two almost perfectly overlapping distributions. Classical interferometry would be limited to a distribution no larger than the yellow area. The distributions are generally nonunimodal, which is indicative of significant drift (or slowly varying noise). (C) Cumulative estimates are plotted. The drift in each estimate is considerable, being approximately 2 fs (600 nm). The red curve has been shifted down by 2 fs for clarity (arrows). The drift for each sample position is very well correlated because we switch the sample position much faster than the drift. (D) Because of this correlation, the difference in cumulative estimates δτ is very stable and converges on the true value.
Fig. 4
Fig. 4. Experimentally measured photon delays induced by the piezo shown against the set values on the piezo actuator.
Number of individual measurements and integrations times vary as indicated in the plot (labels denote billions of incident biphotons). Total acquisition times for each data point ranged between 1.4 and 15.6 hours. Error bars represent an interval of length 2Var(t~). The data point corresponding to the glass wedges should only be read on the top and right axes (because of the nonunit refractive index).
Fig. 5
Fig. 5. Optimal sensitivity point as a function of visibility.
The three curves correspond to different values of the photon loss rate γ.
Fig. 6
Fig. 6. Representative example of our fitting procedure to extract σ during the calibration of the HOM dip.
Inset: Enlarged view of the region of interest for the sensing procedure.

References

    1. Hong C. K., Ou Z. Y., Mandel L., Measurement of subpicosecond time intervals between two photons by interference. Phys. Rev. Lett. 59, 2044–2046 (1987). - PubMed
    1. Z.-Y. J. Ou, Multi-Photon Quantum Interference (Springer, 2007).
    1. Shih Y. H., Alley C. O., New type of Einstein-Podolsky-Rosen-Bohm experiment using pairs of light quanta produced by optical parametric down conversion. Phys. Rev. Lett. 61, 2921–2924 (1988). - PubMed
    1. Rarity J. G., Tapster P. R., Jakeman E., Larchuk T., Campos R. A., Teich M. C., Saleh B. E. A., Two-photon interference in a Mach-Zehnder interferometer. Phys. Rev. Lett. 65, 1348–1351 (1990). - PubMed
    1. Walther P., Pan J.-W., Aspelmeyer M., Ursin R., Gasparoni S., Zeilinger A., De Broglie wavelength of a non-local four-photon state. Nature 429, 158–161 (2004). - PubMed

Publication types