Review
. 2018 May 7;29(5):60.
doi: 10.1007/s10856-018-6068-y.

A multiscale analytical approach to evaluate osseointegration

Affiliations
Review

A multiscale analytical approach to evaluate osseointegration

Anders Palmquist. J Mater Sci Mater Med. .

Abstract

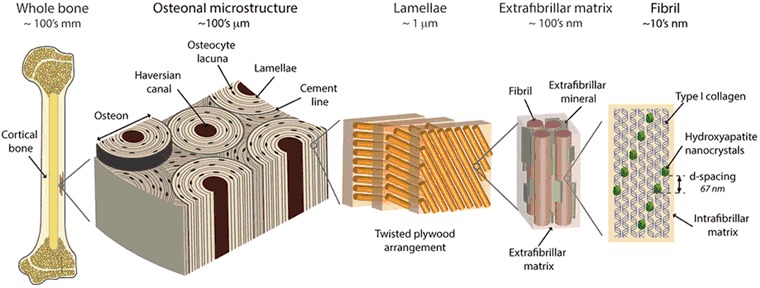
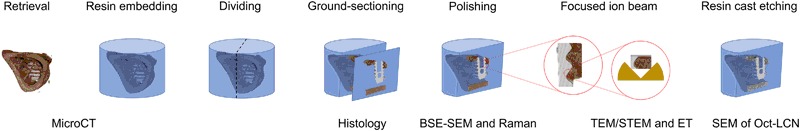
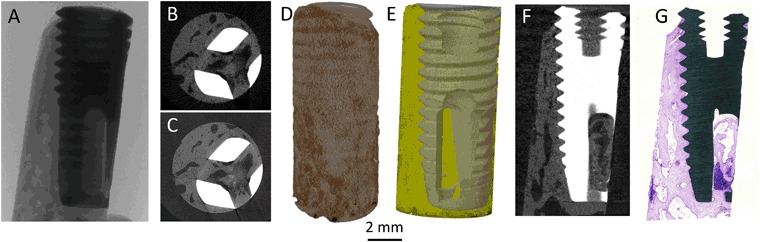
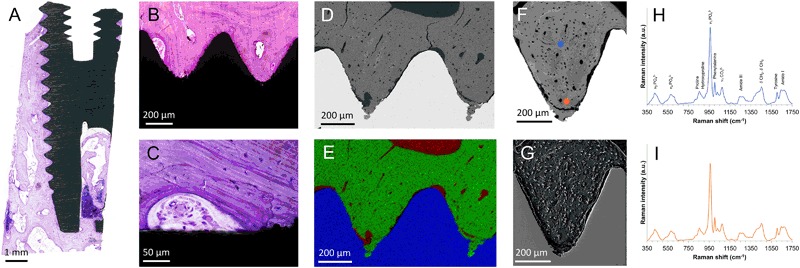
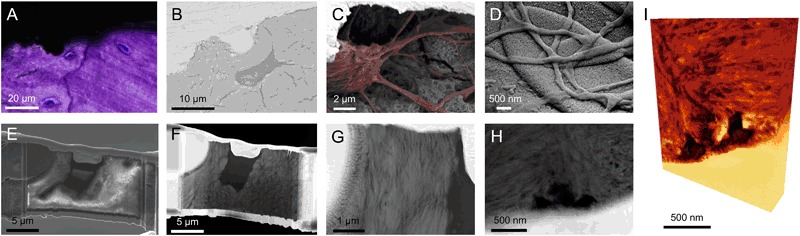
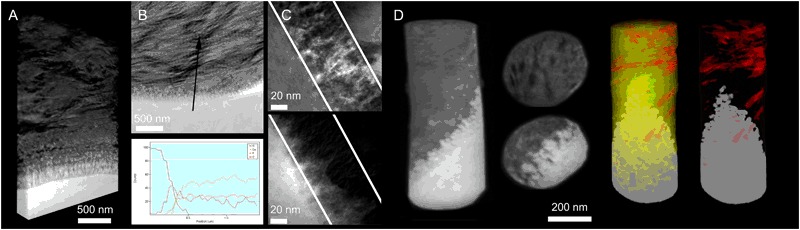
Osseointegrated implants are frequently used in reconstructive surgery, both in the dental and orthopedic field, restoring physical function and improving the quality of life for the patients. The bone anchorage is typically evaluated at micrometer resolution, while bone tissue is a dynamic composite material composed of nanoscale collagen fibrils and apatite crystals, with defined hierarchical levels at different length scales. In order to understand the bone formation and the ultrastructure of the interfacial tissue, analytical strategies needs to be implemented enabling multiscale and multimodal analyses of the intact interface. This paper describes a sample preparation route for successive analyses allowing assessment of the different hierarchical levels of interest, going from macro to nano scale and could be implemented on single samples. Examples of resulting analyses of different techniques on one type of implant surface is given, with emphasis on correlating the length scale between the different techniques. The bone-implant interface shows an intimate contact between mineralized collagen bundles and the outermost surface of the oxide layer, while bone mineral is found in the nanoscale surface features creating a functionally graded interface. Osteocytes exhibit a direct contact with the implant surface via canaliculi that house their dendritic processes. Blood vessels are frequently found in close proximity to the implant surface either within the mineralized bone matrix or at regions of remodeling.


Conflict of interest statement

The authors declare that they have no conflict of interest.

Figures

Fig. 1
Fig. 1
Bone hierarchy: Illustration of the different hierarchical levels of bone tissue with corresponding length scales, from macro to nano scale. Reprinted with permission from Springer Nature [71]
Fig. 2
Fig. 2
Multiscale and multimodal analysis: The work-flow from retrieval and sample processing to sequential evaluation using a range of imaging and complementary spectroscopic techniques allowing comprehensive analysis of the same specimen
Fig. 3
Fig. 3
Macro level of osseointegration: Different views of a micro-CT analysis starting with a X-ray imaging. b Typical reconstruction of a low-resolution scan, 12 µm voxel size (typically 15 min). c Typical reconstruction of a high-resolution scan, 2.5 µm voxel size (typically 8 h). d A three-dimensional volume rendering of the reconstructed image stack. e A three-dimensional surface rendering of the segmented data set representing the implant (grey) and bone (yellow) which has been made semi-transparent. f Data set rotated to locate the slice obtained as the histological ground-section. g Overview image of the ground-section stained by toluidine blue
Fig. 4
Fig. 4
Microscale osseointegration: Light optical microscopy combined with BSE-SEM, EDS, Raman spectroscopy and SE-SEM of resin cast etched samples, showing the successive increase in magnification to follow the bone growth adjacent to the implant. a Overview histological image, showing the amount of bone tissue around the implant. b Closer view of two threads almost completely filled with mature bone tissue. c A closer view at the implant surface showing a remodeling zone with active bone formation, blood supply. Osteocytes are visible in the bone with stained nuclei. d BSE-SEM image of two threads showing a similar picture as the histology, mature bone filling the threads. e Correlative elemental mapping of the two threads, showing calcium (green), titanium (blue) and carbon (red). f Single thread in BSE-SEM showing a biomechanical testing induced fractured zone at the thread valley as well as osteocytes and blood vessels throughout the tissue. g Corresponding thread after resin cast etching, showing the plastic surrounding osteocytes and blood vessels protruding from the etched bone surface. h and i Raman spectra from the corresponding spots marked in f, showing the molecular composition of the tissue. Images modified and reprinted with permission from John Wiley & Sons and Public Library of Science [25, 27]
Fig. 5
Fig. 5
Osteocytes at the implant surface: The osteocyte connection to the implant surface. a Histological image of osteocytes close to the implant surface, the cell nuclei stained in blue. b BSE-SEM image of an osteocyte close to the implant surface. c Osteocyte close to the implant surface shown after resin cast etching where the canaliculi can be observed reaching the implant surface (Osteocyte and canaliculi highlighted in red). d Canaliculi making intimate contact with the implant surface, a top view showing the network of canaliculi. e FIB section during TEM sample preparation made across the osteocyte in b. A canaliculi is seen running in the 8 o’clock direction. f STEM image of the thin sample, the canaliculi was removed during the thinning process. g Closer view of the bone between the osteocyte lacuna and the implant surface showing a uniform directionality, indicating that the former osteoblast, now osteocyte produced the bone in a contact osteogenesis fashion. Collagen banding is observed perpendicular to the implant surface as well as the lacuna indicating collagen parallel to the surface, the morphology further indicate a mature bone with fibril bundles of 1–2 µm in diameter. h STEM image of canaliculi directly interfacing the implant surface. i Corresponding electron tomography volume rendering of h (Courtesy of Assistant Professor Kathryn Grandfield). Images reprinted and modified with permission from the American Chemical Society and Public Library of Science [27, 33]
Fig. 6
Fig. 6
Nano-osseointegration: The nano-scale characteristics of the bone-implant interface could be visualized and analyzed using the transmission electron microscope. a A 3D rendering of the bone implant interface where the collagen bundles are observed parallel to the implant surface running in the plane of the section, collagen banding is observed perpendicular to the implant surface. The individual mineralized collagen fibrils which bundles up to make the bundles could be observed in the tomogram very close to the outermost surface of the oxide layer. b STEM image of the interface showing the typical collagen banding and parallel fashion of the collagen to the implant surface. Site specific chemical analysis by EDS across the interface show a zone of overlapping information indicating apatite formation in the nanostructures formed by the surface oxide. c TEM image of the interface with corresponding EFTEM image filtered for the calcium showing the ingrowth into the nanostructures. d A series of images of electron tomography of a needle-shaped implant where full rotation could be performed for improved reconstruction. In the perpendicular slices the bone structure with darker features (carbon rich collagen fibrils) and aligned apatite could be visualized while at the interface to the implant surface, the structure of the oxide layer with nanoscale features could be seen filled with apatite. Two 3D surface rendering of contrast-based segmented data set with implant (grey), collagen fibrils (red) and with/without apatite (yellow), showing the individual collagen fibrils seemingly being from two different collagen bundles (bundles typically in the range of 1–2 µm in diameter) with slightly different alignment, both however in a rather parallel to the implant surface. Images reprinted and modified with permission from the Royal Society (UK), the American Chemical Society and the Royal Society of Chemistry [26, 30, 33, 34]

References

    1. Brånemark PI, Hansson BO, Adell R, Breine U, Lindström J, Hallen O, et al. Osseointegrated implants in the treatment of the edentulous jaw. Experience from a 10-year period. Scand J Plast Reconstr Surg Suppl. 1977;16:1–132. - PubMed
    1. Branemark PI, Adell R, Breine U, Hansson BO, Lindstrom J, Ohlsson A. Intra-osseous anchorage of dental prostheses. I. Experimental studies. Scand J Plast Reconstr Surg. 1969;3:81–100. doi: 10.3109/02844316909036699. - DOI - PubMed
    1. Brånemark R, Brånemark PI, Rydevik B, Myers RR. Osseointegration in skeletal reconstruction and rehabilitation: a review. J Rehabil Res Dev. 2001;38:175–81. - PubMed
    1. Albrektsson T, Albrektsson B. Osseointegration of bone implants. A review of an alternative mode of fixation. Acta Orthop Scand. 1987;58:567–77. doi: 10.3109/17453678709146401. - DOI - PubMed
    1. Palmquist A. On a novel technique for preparation and analysis of the implant surface and its interface to bone. Göteborg, Sweden: Department of Biomaterials, Institute of Clinical Sciences, Sahlgrenska Academy at University of Gothenburg; 2008.

MeSH terms

Substances

LinkOut - more resources