. 2018 Jun;29(6):1690-1705.
doi: 10.1681/ASN.2017121283. Epub 2018 May 8.

Interleukin-1 β Activates a MYC-Dependent Metabolic Switch in Kidney Stromal Cells Necessary for Progressive Tubulointerstitial Fibrosis

Affiliations

Interleukin-1 β Activates a MYC-Dependent Metabolic Switch in Kidney Stromal Cells Necessary for Progressive Tubulointerstitial Fibrosis

Dario R Lemos et al. J Am Soc Nephrol. 2018 Jun.

Abstract

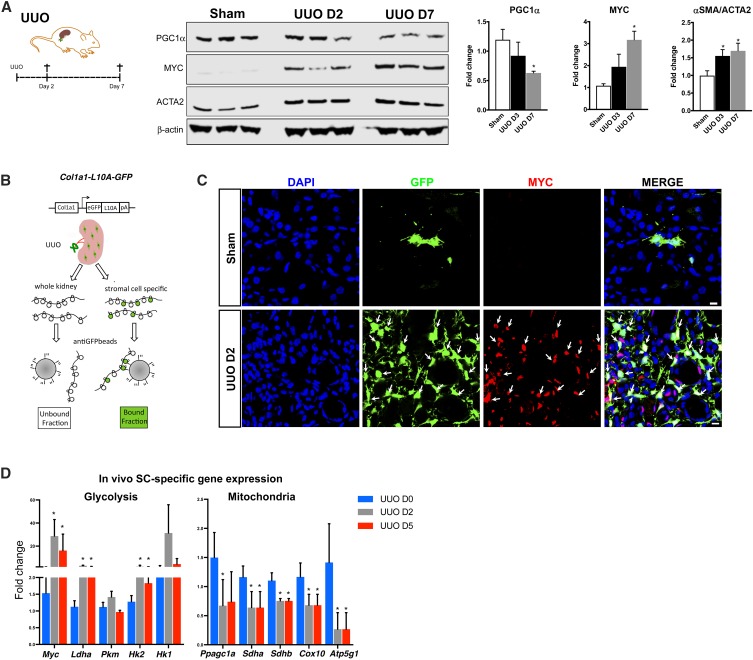
Background Kidney injury is characterized by persisting inflammation and fibrosis, yet mechanisms by which inflammatory signals drive fibrogenesis remain poorly defined.Methods RNA sequencing of fibrotic kidneys from patients with CKD identified a metabolic gene signature comprising loss of mitochondrial and oxidative phosphorylation gene expression with a concomitant increase in regulators and enzymes of glycolysis under the control of PGC1α and MYC transcription factors, respectively. We modeled this metabolic switch in vivo, in experimental murine models of kidney injury, and in vitro in human kidney stromal cells (SCs) and human kidney organoids.Results In mice, MYC and the target genes thereof became activated in resident SCs early after kidney injury, suggesting that acute innate immune signals regulate this transcriptional switch. In vitro, stimulation of purified human kidney SCs and human kidney organoids with IL-1β recapitulated the molecular events observed in vivo, inducing functional metabolic derangement characterized by increased MYC-dependent glycolysis, the latter proving necessary to drive proliferation and matrix production. MYC interacted directly with sequestosome 1/p62, which is involved in proteasomal degradation, and modulation of p62 expression caused inverse effects on MYC expression. IL-1β stimulated autophagy flux, causing degradation of p62 and accumulation of MYC. Inhibition of the IL-1R signal transducer kinase IRAK4 in vivo or inhibition of MYC in vivo as well as in human kidney organoids in vitro abrogated fibrosis and reduced tubular injury.Conclusions Our findings define a connection between IL-1β and metabolic switch in fibrosis initiation and progression and highlight IL-1β and MYC as potential therapeutic targets in tubulointerstitial diseases.

Keywords: Cell Signaling; Chronic inflammation; interstitial fibrosis.


Figures

None
Graphical abstract
Figure 1.
Figure 1.
RNA-seq analysis of human fibrotic CKD identifies a metabolic switch from oxidative phosphorylation to glycolysis, and MYC is a candidate transcription factor driving these transcriptional changes. (A) Heat map representing expression of genes involved in OxPhos and mitochondrial biogenesis in normal versus fibrotic human kidneys (red high, green low). (B) Expression (measured using fragments per kilobase million [FPKM]) of genes involved in glycolysis, glutamine, and aldehyde metabolism. Values on the bar graph represent mean±SD. *P<0.05; **P<0.01 (green arrows from left to right highlight LDHA, SLC2A3, PKM, and HK2). (C) MYC expression in normal versus fibrotic human kidneys. Values on the bar graph represent mean±SD. **P<0.01. (D) Graph showing analysis of transcription factor binding to DEG promoters, comparing normal kidney with CKD kidney. MYC is highlighted in red. (E) Linear regression analysis of eGFR versus PPARGC1A and MYC expression from a cohort of 38 healthy individuals and patients with CKD. (F) Linear regression analysis of PPARGC1A and MYC versus COL1A1 expression from the cohort of patients.
Figure 2.
Figure 2.
Animal models of kidney fibrosis demonstrate a molecular switch from oxidative phosphorylation to glycolysis in SCs. (A) Expression of PGC1α, MYC and αSMA proteins in day 2 (D2) and D7 unilateral ureteral obstruction (UUO) kidneys from WT mice. Values on the bar graph represent mean±SD (t test). *P<0.05. (B) Schematic representing the purification of ribosome-bound translated mRNAs selectively from SCs in kidneys from Col1a1-L10aGFP transgenic mice subjected to UUO. (C) Localization of MYC in the cortical region of UUO kidneys from Col1a1-L10aGFP transgenic mice in which GFP expression labels Col1a1-expressing cells. DAPI, 4′,6-diamidino-2-phenylindole, highlights nuclei. (D) Differential expression of SC specific translated mRNAs pulled down from the kidneys of Col1a1-L10aGFP mice. Values on the bar graph represent mean±SD (one-way ANOVA). *P<0.05 versus UUO D0.
Figure 3.
Figure 3.
IL-1/IL-1 receptor–associated kinase 4 (IRAK4) signaling regulates MYC expression and proliferation in kidney resident SCs. (A) Differential expression of an IL-1β-stimulated gene signature in kidney resident SCs following UUO, identified in purified translated mRNA from Col1a1-L10A-GFP mouse kidneys. Values on the bar graph represent mean±SD (one-way ANOVA). *P<0.05 versus UUO D0; **P<0.01 versus UUO D0. (B) Linear regression analysis of IL1β versus MYC expression (measured in FPKM) from the cohort of 38 healthy individuals and patients with CKD. (C) Representative western blot of protein extracts from human kidney SCs incubated with IL-1β for 48 hours. (D) Western blot of MYC in human kidney SCs incubated with IL-1β in the presence of 100 nM of the small molecule IRAK4 inhibitor, BIIB-IRAK4i for 48 hours. (E) Experimental schema of IRI in mice followed by treatment with BIIB-IRAK4i for 7 days. Western blot and quantification (right hand graphs) of PGC1α and MYC levels in the kidneys of mice D7 after unilateral-IRI and treated with either 75 mg/kg IRAK4 inhibitor BIIB-IRAK4i daily or vehicle. Values on the bar graph represent mean±SD (one-way ANOVA). aP<0.05 versus sham; bP<0.05 versus UIRI + Inhibitor. (F and G) Representative immunofluorescence detection of (F) MYC and (G) Ki67 in PDGFRβ+ SCs in UIRI kidneys of mice treated with either the IRAK4 inhibitor or vehicle. Graphs on right show quantification. DAPI labels nuclei.
Figure 4.
Figure 4.
IL-1β induces MYC-dependent glycolytic and proliferative program in SCs through autophagic degradation of p62. (A) Schematic depicting the model for IL-1β activation of an MYC-driven transcriptional program in kidney SCs. (B) Fold change in transcript levels of representative glycolysis factors as well as MYC transcripts induced by IL-1β in the presence or absence of the BET inhibitor (+)-JQ1. Values on the bar graph represent mean±SD (one-way ANOVA). *P<0.05 versus serum free (SF) medium; ****P<0.05 versus IL-1β + JQ1. (C) Extracellular acidification rate (ECAR) of human kidney PDGFRβ+ SCs incubated with IL-1β for 48 hours in the presence or absence of (+)-JQ1. Points on the curves represent mean±SD (t test; n=3 points). *P<0.05. (D) Heat map showing fold increase of transcripts for cell cycle regulators and glycolysis factors in mouse kidney PDGFRβ+ SCs incubated with IL-1β for 16 hours. (More Red = higher fold increase). (E) Fluorescence images detecting EdU incorporation into nuclei of human kidney PDGFRβ+ SCs stimulated with IL-1β for 48 hours in the presence or absence of the BET inhibitor JQ1. EdU was applied during the first 4 hours of the experiment. **P<0.01, ***P<0.001. (F) Representative western blot detecting SQSTM1/p62 and LC3 II/I levels in human kidney SCs stimulated with IL-1β for 48 hours. (G) Representative western blots detecting PGC1α and mΤΟR signaling in Control and SQSTM1/p62 KO human kidney PDGFRβ+ SCs. (H) Representative western blot detecting MYC in Control and SQSTM1/p62 KO human kidney PDGFRβ+ SCs. (I) Nuclear accumulation of MYC in Control and SQSTM1/p62 KO human kidney PDGFRβ+ SCs. (J) Graphs of quantitative PCR for SLC2A3 and LDHA transcripts in Control and SQSTM1/p62 KO SCs. Values are mean±SD (t test). P<0.01. (K) Representative immunoblots from WT human kidney SC protein extracts. (Left panel) SQSTM1/p62 immunoprecipitated. (Right panel) Detection of MYC in SQSTM1/p62 immunoprecipitates (left and center lanes) and input. In the center lane, SQSTM1/p62 was immunoprecipitated from the extracts of SCs incubated with the proteasome inhibitor MG132 for 12 hours. DAPI labels nuclei.
Figure 5.
Figure 5.
Inhibition of MYC prevents fibrosis in acute murine kidney injury in vivo. (A) Detection of Ki67 in PDGFRβ+, Col1a1-GFP+ SCs by immunofluorescence in kidneys of Col1a1-GFP mice treated with either the BET inhibitor (+)-JQ1 or vehicle 3 days after UUO surgery. Values on the bar graph represent mean±SD (one-way ANOVA). ***P<0.001. (B) Detection of αSMA/ACTA2+ SC-derived myofibroblasts in kidneys of mice treated with either the BET inhibitor (+)-JQ1 or vehicle 10 days after UUO surgery (one-way ANOVA). Values on the bar graph represent mean±SD. ***P<0.001. (C) Quantitative PCR measuring selected transcript levels in RNA extracted from whole kidney from mice treated with either the BET inhibitor (+)-JQ1 or vehicle 10 days after UUO surgery. Values on the bar graph represent mean±SD (one-way ANOVA). *P<0.05; **P<0.01. (D) Representative images showing tubulointerstitial fibrosis by Masson Trichrome (upper) and picrosirius red (lower) of D10 after UUO or sham surgery kidney sections from mice treated with (+)-JQ1 on day 10 postsurgery. (E) Detection and quantification (right hand panels) of the tubular damage marker KIM-1 and the macrophage marker F4/80 by immunofluorescence in the kidneys of mice treated with either the BET inhibitor (+)-JQ1 or vehicle on day 10 after UUO surgery. Values on the bar graph represent mean±SD (one-way ANOVA). ***P<0.001. DAPI labels nuclei.
Figure 6.
Figure 6.
IL-1β causes tubular damage and fibrosis in human kidney organoids. (A) Schematic depicting differentiation stages during the directed derivation of human kidney organoids from human pluripotent stem cells in vitro. (B, upper left panel) Schematic indicating collection time points during the incubation of day 51 kidney organoids with IL-1β. (B, lower left panel) Representative bright-field photomicrographs of organoids incubated with IL-1β for 48 and 96 hours. Values on the bar graph in the right panel represent mean±SD of organoid diameter (one-way ANOVA; n=3 organoids per treatment per time point). *P<0.05 versus time-matching control; **P<0.01 versus time-matching control. (C) Detection of KIM-1 in proximal tubules identified by expression of LTL in kidney organoids treated with either vehicle or IL-1β for 96 hours. (D) Detection of p21WAF1/Cip1 expression in proximal tubules of kidney organoids treated with either vehicle or IL-1β for 96 hours. Arrows indicate p21WAF1/Cip1+ tubular epithelial cells. Values on the bar graph represent mean±SD (t test; n=3 organoids per treatment per time point). **P<0.01. (E) Immunofluorescence showing the progression of Collagen I accumulation in kidney organoids treated with IL-1β. Values on the bar graph represent mean±SD (t test; n=3 organoids per treatment per time point). *P<0.05; **P<0.01. (F) Detection of COL1A1, fibronectin I (FN1), and ACTA2 by quantitative PCR. Values on the bar graph represent mean±SD (t test; n=3 organoids per treatment per time point). DAPI labels nuclei. *P<0.05.
Figure 7.
Figure 7.
(+)-JQ1 inhibits MYC expression and reduces tubulointerstitial fibrosis in human kidney organoids. (A, left panel) Schematic illustrating sample collection time points for day 51 kidney organoids treated with IL-1β plus vehicle or (+)-JQ1. (A, center panel) Representative bright-field photomicrographs. Values on the bar graph in A, right panel represent mean±SD of organoid diameter (one-way ANOVA; n=3 organoids per treatment). **P<0.01 versus Ctl. (B and C) Detection of (B) Ki67 and (C) MYC in PDGFRβ+ SCs by immunofluorescence in the tubulointerstitial space of kidney organoids incubated with IL-1β with or without (+)-JQ1 for 48 hours. Values on the bar graph represent mean±SD (one-way ANOVA; n=3 organoids per treatment). **P<0.01 versus Ctl. (D) αSMA/ACTA2 expression in interstitial PDGFRβ+ SCs determined by immunofluorescence in kidney organoids incubated with IL-1β with or without (+)-JQ1 for 96 hours. Values on the bar graph represent mean±SD (one-way ANOVA; n=3 organoids per treatment). DAPI labels nuclei. *P<0.05; **P<0.01; ***P<0.001.

Comment in

References

    1. Imig JD, Ryan MJ: Immune and inflammatory role in renal disease. Compr Physiol 3: 957–976, 2013 - PMC - PubMed
    1. Cao Q, Harris DC, Wang Y: Macrophages in kidney injury, inflammation, and fibrosis. Physiology (Bethesda) 30: 183–194, 2015 - PubMed
    1. Anders HJ: Immune system modulation of kidney regeneration--mechanisms and implications. Nat Rev Nephrol 10: 347–358, 2014 - PubMed
    1. Anders HJ: Of inflammasomes and alarmins: IL-1β and IL-1α in kidney disease. J Am Soc Nephrol 27: 2564–2575, 2016 - PMC - PubMed
    1. Leaf IA, Nakagawa S, Johnson BG, Cha JJ, Mittelsteadt K, Guckian KM, et al. .: Pericyte MyD88 and IRAK4 control inflammatory and fibrotic responses to tissue injury. J Clin Invest 127: 321–334, 2017 - PMC - PubMed

Publication types

MeSH terms