. 2018 May 8;9(3):e00317-18.
doi: 10.1128/mBio.00317-18.

A High Frequency of HIV-Specific Circulating Follicular Helper T Cells Is Associated with Preserved Memory B Cell Responses in HIV Controllers

Affiliations

A High Frequency of HIV-Specific Circulating Follicular Helper T Cells Is Associated with Preserved Memory B Cell Responses in HIV Controllers

M Claireaux et al. mBio. .

Abstract

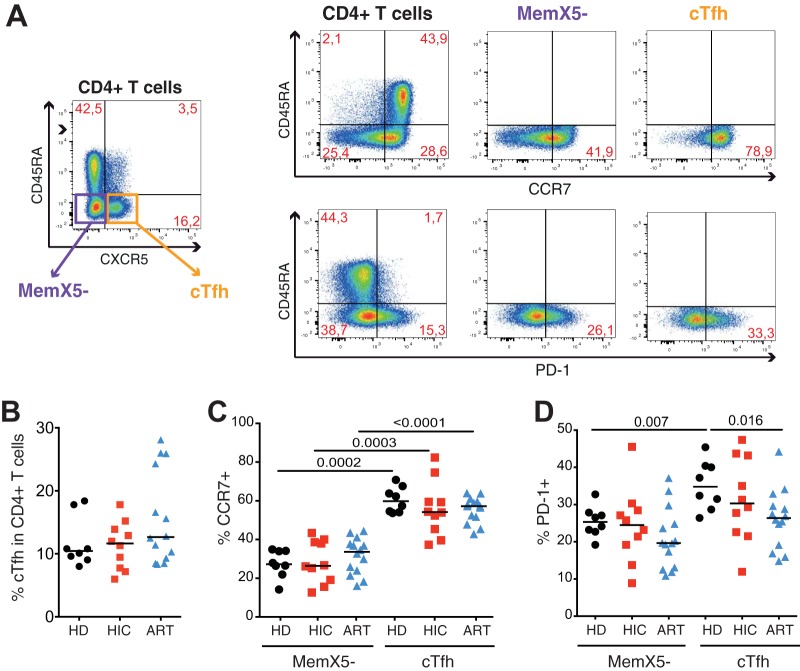
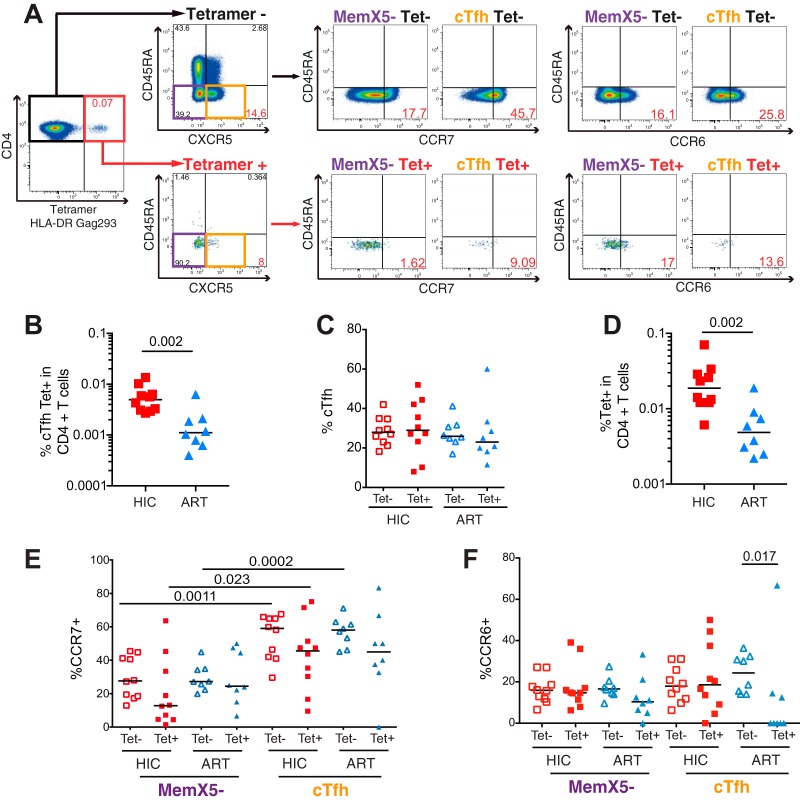
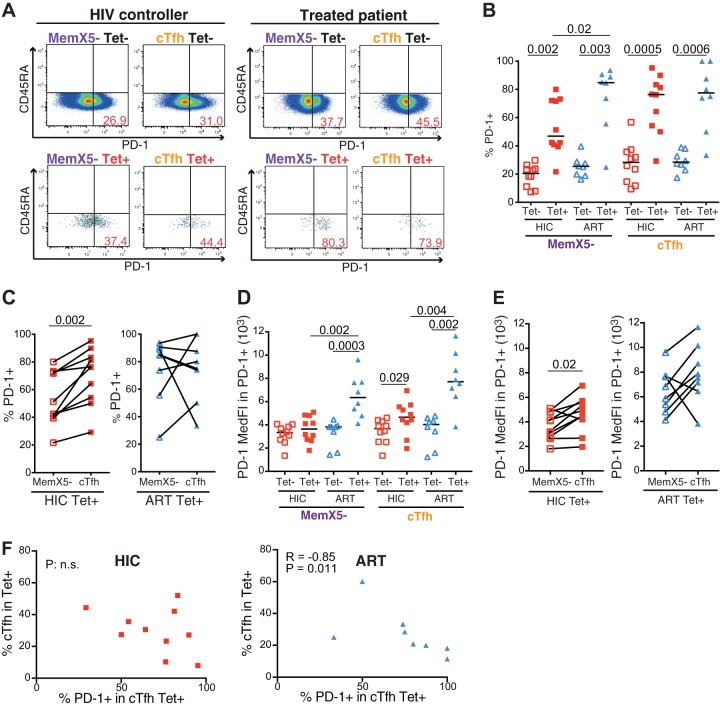
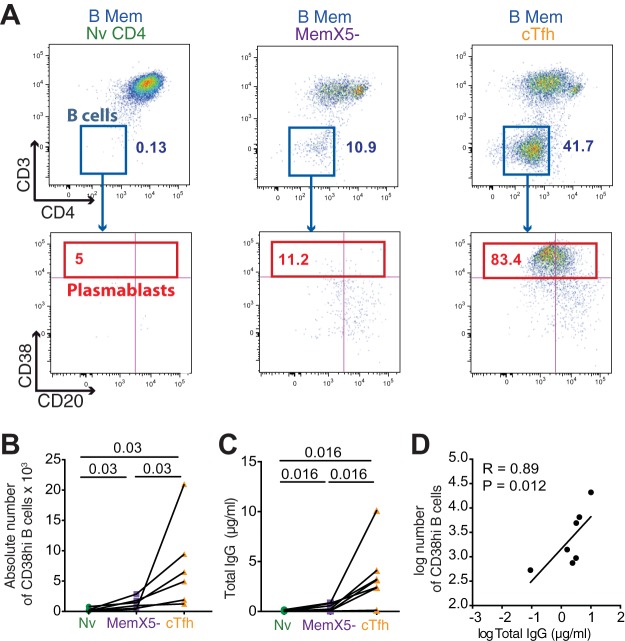
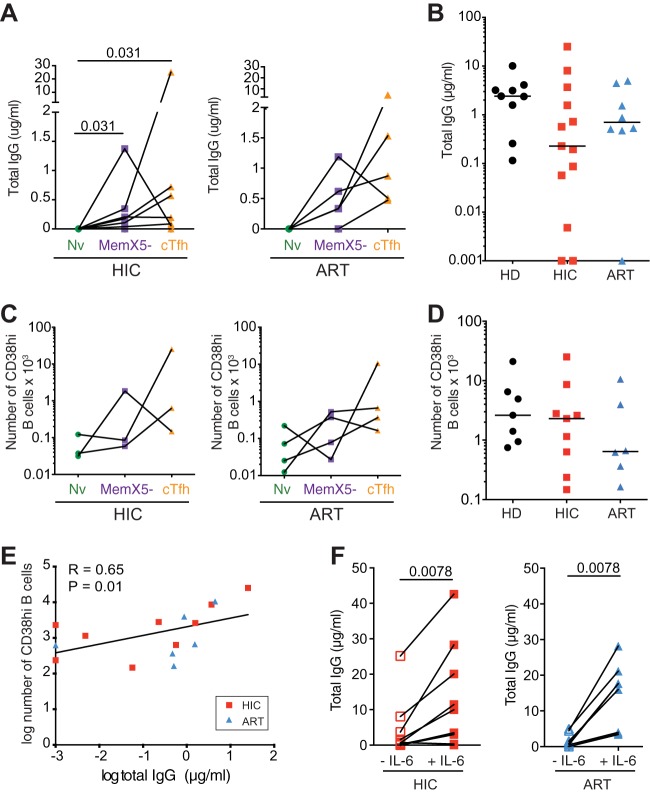
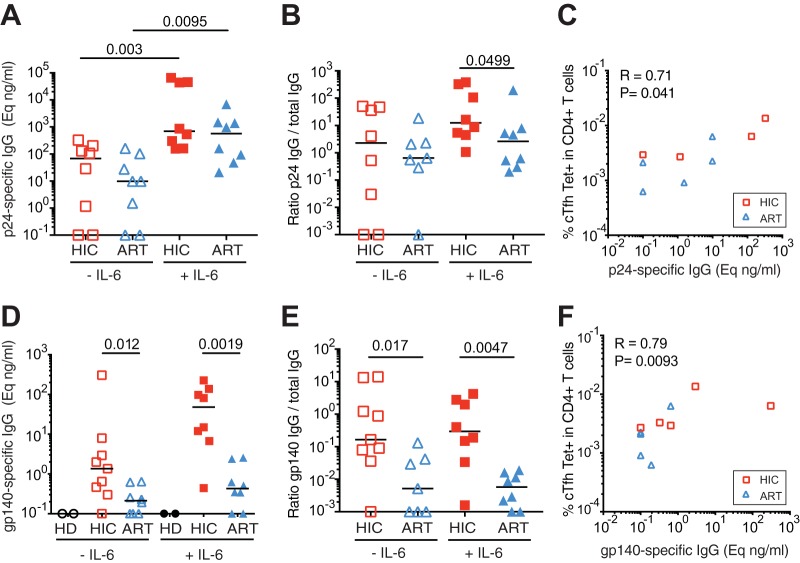
Follicular helper T cells (Tfh) play an essential role in the affinity maturation of the antibody response by providing help to B cells. To determine whether this CD4+ T cell subset may contribute to the spontaneous control of HIV infection, we analyzed the phenotype and function of circulating Tfh (cTfh) in patients from the ANRS CO21 CODEX cohort who naturally controlled HIV-1 replication to undetectable levels and compared them to treated patients with similarly low viral loads. HIV-specific cTfh (Tet+), detected by Gag-major histocompatibility complex class II (MHC-II) tetramer labeling in the CD45RA- CXCR5+ CD4+ T cell population, proved more frequent in the controller group (P = 0.002). The frequency of PD-1 expression in Tet+ cTfh was increased in both groups (median, >75%) compared to total cTfh (<30%), but the intensity of PD-1 expression per cell remained higher in the treated patient group (P = 0.02), pointing to the persistence of abnormal immune activation in treated patients. The function of cTfh, analyzed by the capacity to promote IgG secretion in cocultures with autologous memory B cells, did not show major differences between groups in terms of total IgG production but proved significantly more efficient in the controller group when measuring HIV-specific IgG production. The frequency of Tet+ cTfh correlated with HIV-specific IgG production (R = 0.71 for Gag-specific and R = 0.79 for Env-specific IgG, respectively). Taken together, our findings indicate that key cTfh-B cell interactions are preserved in controlled HIV infection, resulting in potent memory B cell responses that may play an underappreciated role in HIV control.IMPORTANCE The rare patients who spontaneously control HIV replication in the absence of therapy provide a unique model to identify determinants of an effective anti-HIV immune response. HIV controllers show signs of particularly efficient antiviral T cell responses, while their humoral response was until recently considered to play only a minor role in viral control. However, emerging evidence suggests that HIV controllers maintain a significant but "silent" antiviral memory B cell population that can be reactivated upon antigenic stimulation. We report that cTfh help likely contributes to the persistence of controller memory B cell responses, as the frequency of HIV-specific cTfh correlated with the induction of HIV-specific antibodies in functional assays. These findings suggest that T follicular help may contribute to HIV control and highlight the need for inducing such help in HIV vaccine strategies that aim at eliciting persistent B cell responses.

Keywords: B lymphocytes; HIV controllers; MHC-II tetramers; T follicular helper; T lymphocytes; human immunodeficiency virus.


Figures

FIG 1
FIG 1
Phenotyping of the total cTfh population. Flow cytometry analysis of CD4+ T cells derived from healthy donors (HD, n = 8), HIV controllers (HIC, n = 10), and treated patients (ART, n = 14). (A) Representative plots depicting the gating of subsets analyzed in the CD4+ T cell population. (Left) CD4+ T cells were initially gated as viable CD3+ CD20 CD14 CD8 CD4+ cells and were then analyzed for the following subsets: MemX5 (CD45RA CXCR5; purple square) and cTfh (CD45RA CXCR5+; orange square). The CD4+, MemX5, and cTfh populations were then analyzed in relation to CD45RA and CCR7 expression (upper right panel) as well as CD45RA and PD-1 expression (lower right panel). (B) Comparison of the frequencies of cTfh in CD4+ T cells between healthy donor, HIV controller, and treated patient groups. (C and D) Comparison of the frequencies of CCR7+ (C) and PD-1+ (D) cells within the MemX5 and cTfh subsets between healthy donor, HIV controller, and treated patient groups. Bars represent medians. Significant differences (P < 0.05) obtained with the Mann-Whitney U test are reported.
FIG 2
FIG 2
Phenotyping of HIV-specific cTfh cells. Phenotyping of CD4+ T cells derived from HIV controllers (HIC, n = 10) and treated patients (ART, n = 8) with Gag293-loaded MHC-II tetramers. (A) Gating strategy used to analyze HIV-specific CD4+ T cells, shown for one HIV controller. (Farthest left) Dot plot depicting the detection of Gag293-specific CD4+ T cells by MHC-II tetramer labeling, among total CD4+ T cells. (Middle left) Gates used to select Mem X5 (CD45RA CXCR5; purple) and cTfh (CD45RA CXCR5+; orange) in Gag293-specific (bottom) or nonspecific (top) CD4+ T cell populations. (Middle and right) MemX5 and cTfh populations were then analyzed in relation to CD45RA versus CCR7 (middle panels) or CD45RA versus CCR6 (right panels). (B) Frequency of Gag293-specific cTfh cells in the HIC and ART groups. (C) Comparison of the frequency of cTfh cells in the memory CD45RA CD4+ T cell populations that are Gag293 specific (Tet+) and nonspecific (Tet) in the HIC and ART groups. (D) Frequency of total Gag293-specific cells in CD4+ T cells of controllers and treated patients. (E) Frequency of CCR7+ cells in the cTfh and Mem X5 cell populations: comparison between Gag293-specific (Tet+) and nonspecific (Tet) CD4+ T cells in the HIC and ART groups. (F) Frequency of CCR6+ cells in the cTfh and Mem X5 cell populations, analyzed as in panel E. Bars represent medians. Significant differences (P < 0.05) obtained with the Mann-Whitney U test are reported.
FIG 3
FIG 3
Analysis of PD-1 expression in HIV-specific cTfh cells. Phenotyping of Gag293-specific and nonspecific CD4+ T cells derived from HIV controllers (HIC, n = 10) and treated patients (ART, n = 8). The gating strategy used is identical to one described in the Fig. 2A legend. (A) Representative plots depicting the gating used for PD-1 analysis in CD4+ T cell populations. MemX5 (left) and cTfh (right) populations were analyzed in relation to CD45RA versus PD-1 in Gag293-specific (bottom) and nonspecific (top) CD4+ T cell populations. Examples are shown for one HIV controller and one treated patient. (B) Frequency of PD-1+ cells in the cTfh and Mem X5 cell populations: comparison between the Gag293-specific (Tet+) and nonspecific (Tet) CD4+ T cell populations in the HIC and ART groups. (C) Comparison of the frequency of PD-1+ cells in paired cTfh and MemX5 Gag293-specific populations from the HIC and ART groups. (D) Median florescence intensity (MedFI) of PD-1 expression in the PD-1+ subset of cTfh and Mem X5 cell populations: comparison between Gag293-specific (Tet+) and nonspecific (Tet) CD4+ T cell populations in the HIC and ART groups. (E) Comparison of the MedFI of PD-1+ cells in paired cTfh and MemX5 Gag293-specific populations from the HIC and ART groups. (F) Correlation between the frequency of PD-1+ cells in the Gag293-specific cTfh population and the frequency of cTfh within the Gag293-specific population in the HIC (left) and ART (right) groups. Bars represent medians. Significant differences (P < 0.05) obtained by the Mann-Whitney U test (B and D), the Wilcoxon matched-pair statistical test (C and E), and Spearman’s rank correlation coefficient test (F) are reported.
FIG 4
FIG 4
cTfh induction of B cell maturation and IgG production. Thawed PBMC from healthy donors were sorted into 3 CD4+ T cell subsets: cTfh (CD3+ CD20 CD4+ CD45RA CXCR5+; orange), MemX5 (CD3+ CD20 CD4+ CD45RA CXCR5; purple), and Nv or naive CD4+ T cells (CD3+ CD20 CD4+ CD45RA+ CCR7+; green). The gating strategy is provided in Fig. S7. Each of these 3 subsets was then cocultured with autologous memory B cells (CD3 CD20+ CD27+; blue) in the presence of superantigens. Cells and supernatants were harvested at days 7 and 12, respectively. (A) Representative flow cytometry plots depicting B cell maturation following 7 days of coculture. (Top panels) B cell gate (CD3 CD4); (bottom panels) analysis of plasmablasts (CD38hi) in the B cell population. (B) Absolute number of CD38hi B cells at day 7 of coculture with the 3 different CD4+ T cell subsets Nv (green), MemX5 (purple), and cTfh (orange). (C) Total IgG secretion measured by ELISA in the supernatants of the cocultures at day 12. (D) Correlation between the number of CD38hi plasmablasts and total IgG production in the cocultures. Bars represent medians. Significant differences (P < 0.05) obtained by the Wilcoxon matched-pairs statistical test and Spearman’s rank correlation coefficient test are reported.
FIG 5
FIG 5
Analysis of patient cTfh-mediated help to autologous memory B cells. PBMC from healthy donors (HD), HIV controllers (HIC), and treated patients (ART) were sorted into 3 CD4+ T cell subsets and cocultured with memory B cells as described in the Fig. 4 legend. (A) Total IgG secretion was measured by ELISA in coculture supernatants at day 12. IgG secretion was compared in cocultures of memory B cells with naive CD4+ T cells (Nv), memory CXCR5 CD4+ T cells (MemX5), and cTfh in the HIC (n = 6, left) and ART (n = 5, right) groups. (B) Comparison of total IgG secretion in memory B cells/cTfh cocultures for the HD (n = 9), HIC (n = 13), and ART (n = 8) groups. (C) The B cell phenotype was analyzed at day 7 of coculture. The absolute numbers of plasmablasts (CD3 CD4 CD38hi) present in the different coculture systems (Nv, MemX5, and cTfh) were compared in HIC (n = 3, left) and ART (n = 4, right) patients. (D) Comparison of the absolute number of plasmablasts in memory B cells/cTfh cocultures in the HD (n = 7), HIC (n = 9), and ART (n = 6) groups. (E) Correlation between the amount of secreted IgG and the absolute number of plasmablasts in memory B cells/cTfh cocultures from HIC (red squares) and ART (blue triangles) patients. (F) Effects of IL-6 addition on total IgG secretion in memory B cell/cTfh cocultures from HIC (left panel) and ART (right panel) patients. Bars represent medians. Significant differences (P < 0.05) obtained by the Wilcoxon matched-pair statistical test (A, C, and F), the Mann-Whitney U test (B and D), and Spearman’s rank correlation coefficient test (E) are reported.
FIG 6
FIG 6
Analysis of HIV-specific IgG production stimulated by cTfh help. cTfh cells (CD3+ CD20 CD4+ CD45RA CXCR5+) and memory B cells (CD3 CD20+ CD27+) were sorted from patient PBMC samples and cocultured with superantigens in the presence or absence of IL-6. Supernatants were harvested at day 12. (A) Levels of Gag p24-specific IgG production in the presence or absence of IL-6, as measured by ELISA in cocultures from HIC (n = 8) and ART (n = 8) patients. (B) Ratio of p24-specific IgG to total IgG production in the presence or absence of IL-6 in HIC (n = 8) and ART (n = 8) patient cocultures. (C) Correlation between the level of p24-specific IgG production and the frequency of Gag293-specific cTfh in CD4+ T cells in HIC (red squares) and ART (blue triangles) patients. (D) Level of Env gp140-specific IgG production in the presence or absence of IL-6, as measured by ELISA in cocultures from HIC (n = 9) and ART (n = 8) patients. (E) Ratio of gp140-specific IgG to total IgG production in the presence or absence of IL-6 in HIC (n = 8) and ART (n = 8) patient cocultures. (F) Correlation between the level of gp140-specific IgG production and the frequency of Gag293-specific cTfh in CD4+ T cells in HIC (red squares) and ART (blue triangles) patients. Significant differences (P < 0.05) obtained by the Mann-Whitney U test (A, B, D, and E) and Spearman’s rank correlation coefficient test (C and F) are reported.

Similar articles

Cited by

References

    1. Schaerli P, Willimann K, Lang AB, Lipp M, Loetscher P, Moser B. 2000. CXC chemokine receptor 5 expression defines follicular homing T cells with B cell helper function. J Exp Med 192:1553–1562. doi:10.1084/jem.192.11.1553. - DOI - PMC - PubMed
    1. Breitfeld D, Ohl L, Kremmer E, Ellwart J, Sallusto F, Lipp M, Förster R. 2000. Follicular B helper T cells express CXC chemokine receptor 5, localize to B cell follicles, and support immunoglobulin production. J Exp Med 192:1545–1552. doi:10.1084/jem.192.11.1545. - DOI - PMC - PubMed
    1. Havenar-Daughton C, Lee JH, Crotty S. 2017. Tfh cells and HIV bnAbs, an immunodominance model of the HIV neutralizing antibody generation problem. Immunol Rev 275:49–61. doi:10.1111/imr.12512. - DOI - PubMed
    1. Ma CS, Deenick EK, Batten M, Tangye SG. 2012. The origins, function, and regulation of T follicular helper cells. J Exp Med 209:1241–1253. doi:10.1084/jem.20120994. - DOI - PMC - PubMed
    1. Vinuesa CG, Linterman MA, Yu D, MacLennan IC. 2016. Follicular helper T cells. Annu Rev Immunol 34:335–368. doi:10.1146/annurev-immunol-041015-055605. - DOI - PubMed

Publication types