. 2018 May 8;9(1):1825.
doi: 10.1038/s41467-018-03621-1.

Exploring the phenotypic consequences of tissue specific gene expression variation inferred from GWAS summary statistics

Affiliations

Exploring the phenotypic consequences of tissue specific gene expression variation inferred from GWAS summary statistics

Alvaro N Barbeira et al. Nat Commun. .

Abstract

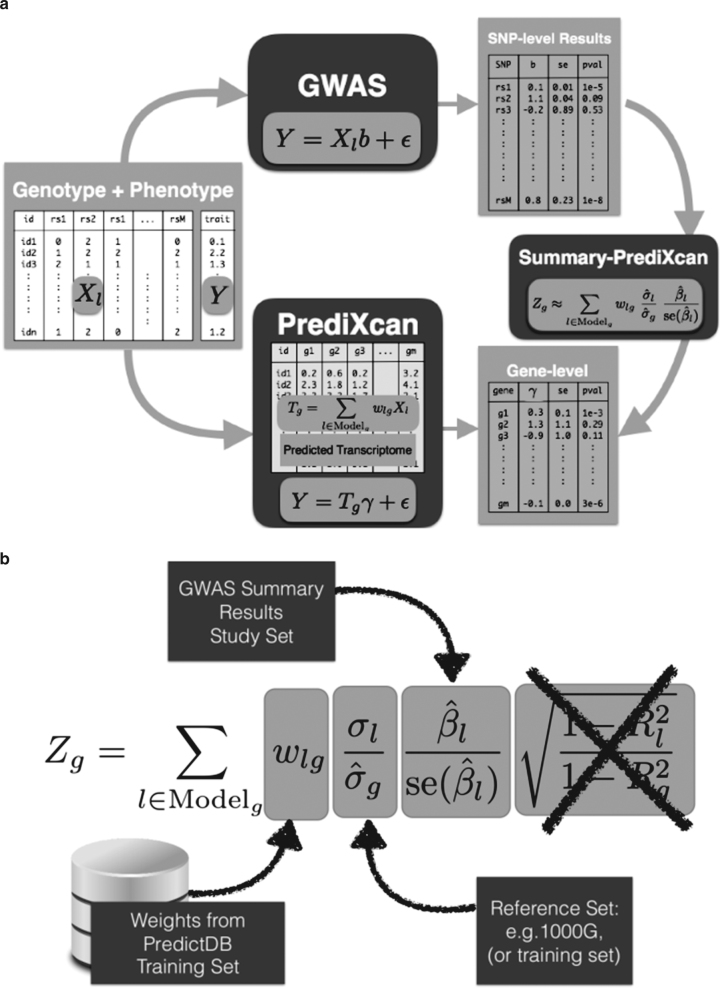
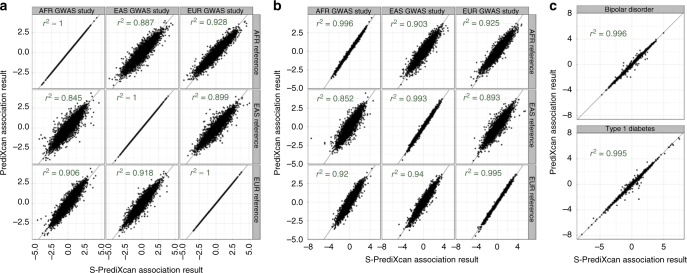
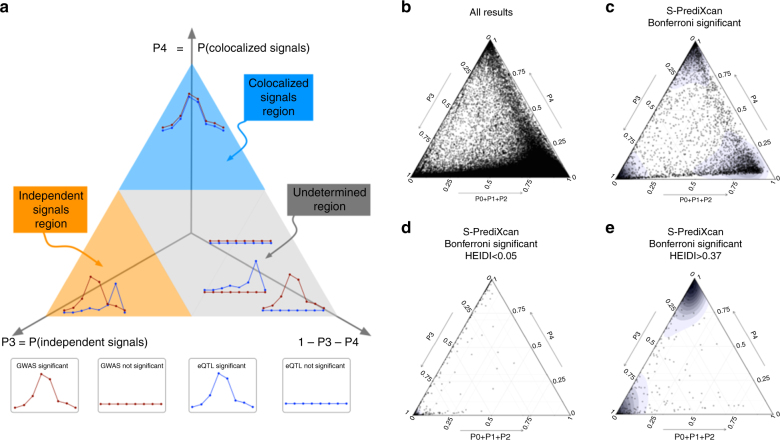
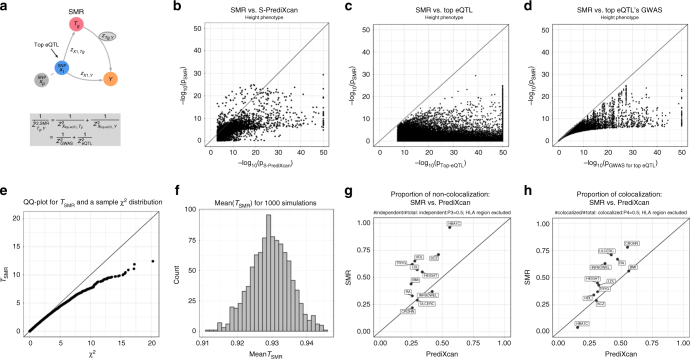
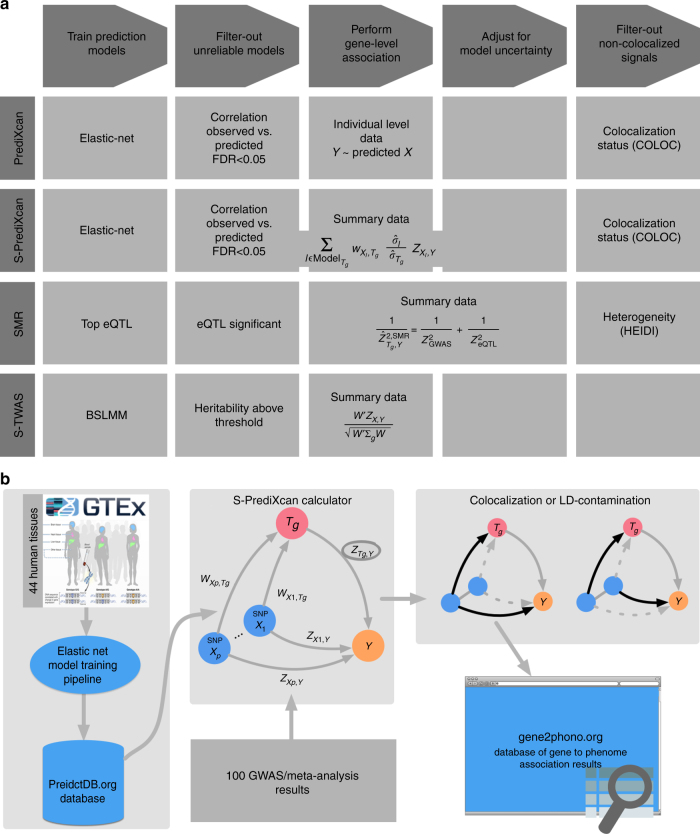
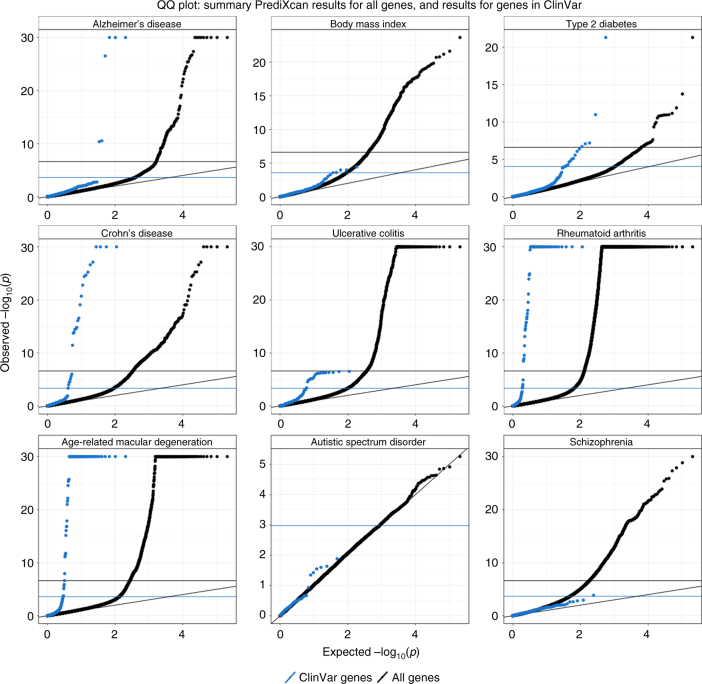
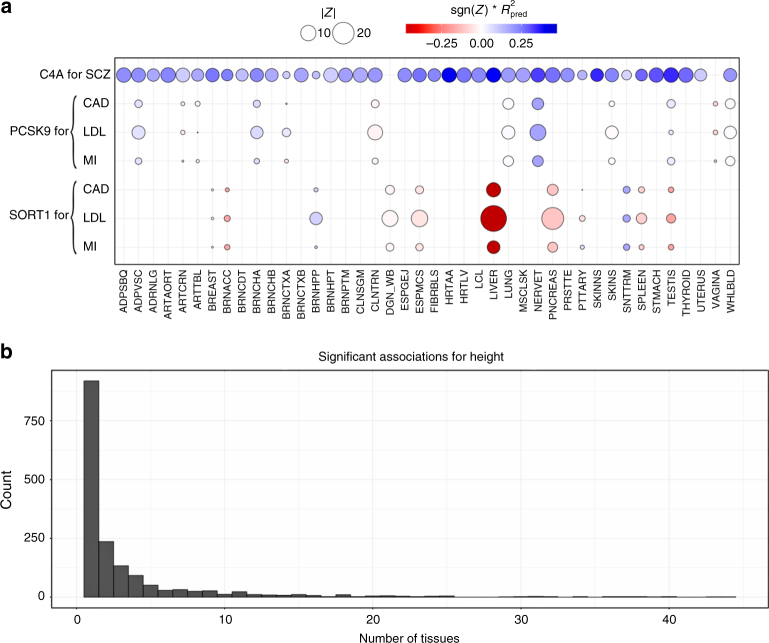
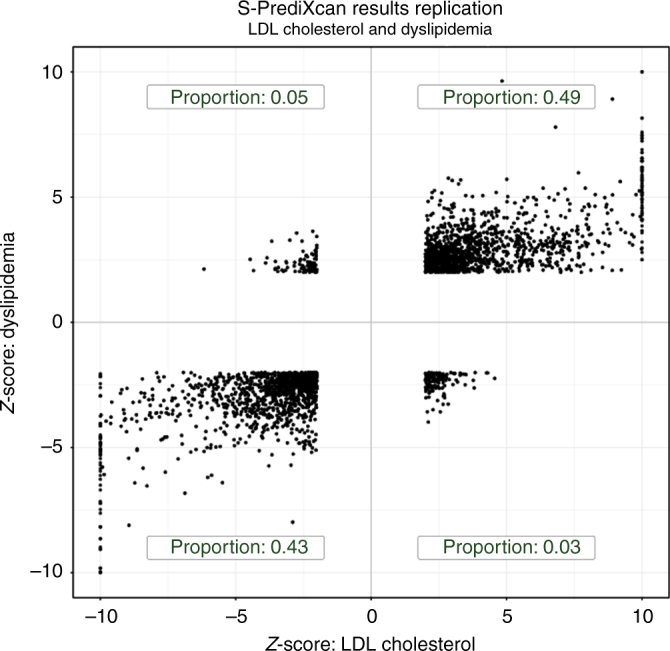
Scalable, integrative methods to understand mechanisms that link genetic variants with phenotypes are needed. Here we derive a mathematical expression to compute PrediXcan (a gene mapping approach) results using summary data (S-PrediXcan) and show its accuracy and general robustness to misspecified reference sets. We apply this framework to 44 GTEx tissues and 100+ phenotypes from GWAS and meta-analysis studies, creating a growing public catalog of associations that seeks to capture the effects of gene expression variation on human phenotypes. Replication in an independent cohort is shown. Most of the associations are tissue specific, suggesting context specificity of the trait etiology. Colocalized significant associations in unexpected tissues underscore the need for an agnostic scanning of multiple contexts to improve our ability to detect causal regulatory mechanisms. Monogenic disease genes are enriched among significant associations for related traits, suggesting that smaller alterations of these genes may cause a spectrum of milder phenotypes.


Conflict of interest statement

The authors declare no competing interests.

Figures

Fig. 1
Fig. 1
Comparison between GWAS, PrediXcan, and S-PrediXcan. a Compares GWAS, PrediXcan, and Summary-PrediXcan. Both GWAS and PrediXcan take genotype and phenotype data as input. GWAS computes the regression coefficients of Y on Xl using the model Y=a+Xlb+ϵ, where Y is the phenotype and Xl the individual SNP dosage. The output is a table of SNP-level results. PrediXcan, in contrast, starts first by predicting/imputing the transcriptome. Then it calculates the regression coefficients of the phenotype Y on each gene’s predicted expression Tg. The output is a table of gene-level results. Summary-PrediXcan directly computes the gene-level association results using the output from GWAS. b Shows the components of the formula to calculate PrediXcan gene-level association results using summary statistics. The different sets involved as input data are shown. The regression coefficient between the phenotype and the genotype is obtained from the study set. The training set is the reference transcriptome dataset where the prediction models of gene expression levels are trained. The reference set (1000G, or training set having some advantages) is used to compute the variances and covariances (LD structure) of the markers used in the predicted expression levels. Both the reference set and training set values are precomputed and provided to the user so that only the study set results need to be provided to the software. The crossed out term was set to 1 as an approximation. We found this approximation to have negligible impact on the results
Fig. 2
Fig. 2
Comparison of PrediXcan and S-PrediXcan results in real and simulated traits. This figure shows a comparison of PrediXcan vs. S-PrediXcan for a a simulated phenotype under null hypothesis of no genetic component; b a cellular phenotype (=intrinsic growth); and c bipolar disorder and type 1 diabetes studies from Wellcome Trust Case Control Consortium (WTCCC). Gene expression prediction models were based on the DGN cohort presented in ref. . For the simulated phenotype, study sets (GWAS set) and reference sets (LD calculation set) consisted of African (661), East Asian (504), and European (503) individuals from the 1000 Genomes Project. When the same study set is used as reference set, we obtained a high correlation (coefficient of determination): r2 > 0.99999. For the intrinsic growth phenotype, study sets were a subset of 140 individuals from each of the African, Asian, and European groups from 1000 Genomes Project. The reference set was the same as for the simulated phenotype. For the disease phenotypes, the study set consisted of British individuals, and the LD calculation set was the European population subset of the 1000 Genomes Project
Fig. 3
Fig. 3
Colocalization status of S-PrediXcan results. a Shows a ternary plot that represents the probabilities of various configurations from COLOC. This plot conveniently constrains the values such that the sum of the probabilities is 1. All points in a horizontal line have the same probability of “colocalized” GWAS and eQTL signals (P4), points on a line parallel to the right side of the triangle (NW to SE) have the same probability of “Independent signals” (P3), and lines parallel to the left side of the triangle (NE to SW) correspond to constant P0+P1+P2. Top sub-triangle in blue corresponds to high probability of colocalization (P4 > 0.5), lower left sub-triangle in orange corresponds to probability of independent signals (P3 > 0.5), and lower right parallelogram corresponds to genes without enough power to determine or reject colocalization. The following panels present ternary plots of COLOC probabilities with a density overlay for S-PrediXcan results of the Height phenotype. b Shows the colocalization probabilities for all gene-tissue pairs. Most results fall into the “undetermined” region. c Shows that if we keep only Bonferroni-significant S-PrediXcan results, associations tend to cluster into three distinct regions: “independent signals,” “colocalized,” and “undertermined.” d Shows that HEIDI significant genes (to be interpreted as high heterogeneity between GWAS and eQTL signals, i.e., distinct signals) tightly cluster in the “independent signal” region, in concordance with COLOC. A few genes fall in the “colocalized” region, in disagreement with COLOC classification. Unlike COLOC results, HEIDI does not partition the genes into distinct clusters and an arbitrary cutoff p-value has to be chosen. e Shows genes with large HEIDI p-value (no evidence of heterogeneity) which fall in large part in the “colocalized” region. However a substantial number fall in “independent signal” region, disagreeing with COLOC’s classification
Fig. 4
Fig. 4
Comparison between S-PrediXcan and S-TWAS. a Depicts how summary-TWAS and PrediXcan test the mediating role of gene expression level Tg. Multiple SNPs are linked to the expression level of a gene via weights wX,Tg. b Shows the significance of Summary-TWAS (BSLMM) vs. summary-PrediXcan (elastic net), for the height phenotype across 44 GTEx tissues. There is a small bias caused by using S-TWAS results available from, which only lists significant hits. S-PrediXcan tends to yield a larger number of significant associations (see Supplementary Fig. 12). P-values were thresholded at 10−50 for visualization purposes. c Shows the proportion of non-colocalized associations (distinct eQTL and GWAS signals) from S-TWAS significant vs. S-PrediXcan significant results. For all phenotypes, S-TWAS has a higher proportion of LD-contaminated signals compared to S-PrediXcan, as estimated via COLOC. d Shows the proportion of colocalized associations (shared eQTL and GWAS signals) from S-TWAS significant vs. S-PrediXcan significant results. For most phenotypes, TWAS has lower proportion of colocalized signals compared to S-PrediXcan, as estimated via COLOC. Phenotype abbreviations are as follows: FNBD Femoral Neck Bone Density, LSBD Lumbar Spine Bone Density, BMI Body Mass Index, HEIGHT Height, LDL Low-Density Lipoprotein Cholesterol, HDL High-Density Lipoprotein Cholesterol, TRYG Tryglicerides, CROHN Crohn’s Disease, INFBOWEL Inflammatory Bowel’s Disease, ULCERC Ulcerative Colitis, HBA1C Hemogoblin Levels, HOMA-IR HOMA Insulin Response, SCZ Schizophrenia, RA Rheumatoid Arthritis, COLLEGE College Completion, EDUCYEARS Education Years
Fig. 5
Fig. 5
Comparison between summary-PrediXcan and SMR. a Depicts how SMR tests the mediating role of gene expression level Tg. The top eQTL is linked to the phenotype as an instrumental variable in a Mendelian Randomization approach. b Shows the significance of SMR vs. the significance of Summary-PrediXcan. As expected, SMR associations tend to be smaller than S-PrediXcan ones. c and d show that the SMR statistics significance is bounded by GWAS and eQTL p-values. The p-values (−log10) of the SMR statistics are plotted against the GWAS p-value of the top eQTL SNP (c), and the gene’s top eQTL p-value (d). e Shows a QQ plot for simulated values of TSMR. Under the null hypothesis of significant eQTL signal and no GWAS association, we generated random values for ZGWAS2 and ZeQTL2 following the simulations from ref. . TSMR statistic was calculated from these values, and compared to a χ12 distribution to illustrate this statistics’ deflation. f shows the sample mean of TSMR from 1000 simulations, centered close to 0.93, instead of the expected value of 1 for a χ12-distributed variable. g shows the proportion of non-colocalized significant associations to total significant associations in PrediXcan and SMR. h Shows the proportion of colocalized significant associations (shared eQTL and GWAS signals). As expected, SMR shows a higher proportion of colocalized and non-colocalized associations than PrediXcan. This is caused by SMR’s high eQTL significance threshold, that rules out most of the genes with low colocalization power (P0 + P1 + P2 > 0.5). For some of the associations, GWAS and eQTL p-values were more significant than shown since they were thresholded at 10−50 to improve visualization. Phenotype abbreviations are as follows: FNBD Femoral Neck Bone Density, LSBD Lumbar Spine Bone Density, BMI Body Mass Index, HEIGHT Height, LDL Low-Density Lipoprotein Cholesterol, HDL High-Density Lipoprotein Cholesterol, TRYG Tryglicerides, CROHN Crohn’s Disease, INFBOWEL Inflammatory Bowel’s Disease, ULCERC Ulcerative Colitis, HBA1C Hemogoblin Levels, HOMA-IR HOMA Insulin Response, SCZ Schizophrenia, RA Rheumatoid Arthritis, COLLEGE College Completion, EDUCYEARS Education Years
Fig. 6
Fig. 6
MetaXcan framework and application. a Shows a general framework (MetaXcan) which encompasses methods such as PrediXcan, TWAS, SMR, COLOC among others. b Summarizes the application of the MetaXcan framework with S-PrediXcan using 44 GTEx tissue transcriptomes and over 100 GWAS and meta analysis results. We trained prediction models using elastic-net and deposited the weights and SNP covariances in the publicly available resource (http://predictdb.org/). The weights, covariances, and over 100 GWAS summary results were processed with S-PrediXcan. Colocalization status was computed and the full set of results was deposited in gene2pheno.org
Fig. 7
Fig. 7
ClinVar genes show significant S-PrediXcan associations. Genes implicated in ClinVar tended to be more significant in S-PrediXcan for most diseases tested, except for schizophrenia and autism. This suggests that more moderate alteration of monogenic disease genes may contribute in a continuum of more moderate but related phenotypes. Alternatively, a more complex interplay between common and rare variation could be taking place such as higher tolerance to loss of function mutations in lower expressing haplotypes which could induce association with predicted expression. Blue circles correspond to the QQ plot of genes in ClinVar that were annotated with the phenotype and black circles correspond to all genes
Fig. 8
Fig. 8
S-PrediXcan associations in different tissues. a Displays associations for PCSK9, SORT1, and C4A on relevant traits by tissue. This figure shows the association strength between three well studied genes and corresponding phenotypes. C4A associations with schizophrenia (SCZ) are significant across most tissues. SORT1 associations with LDL-C, coronary artery disease (CAD), and myocardial infarction (MI) are most significant in liver. PCSK9 associations with LDL-C, coronary artery disease (CAD), and myocardial infarction (MI) are most significant in tibial nerve. The size of the points represent the significance of the association between predicted expression and the traits indicated on the top labels. Red indicates negative correlation whereas blue indicates positive correlation. Rpred2 is a performance measure computed as the correlation squared between observed and predicted expression, cross validated in the training set. Darker points indicate larger genetic component and consequently more active regulation in the tissue. b Displays a histogram of the number of tissues for which a gene is significantly associated with height (other phenotypes show a similar pattern). Tissue abbreviations: ADPSBQ Adipose-Subcutaneous, ADPVSC Adipose-Visceral(Omentum), ADRNLG Adrenal Gland, ARTAORT Artery-Aorta, ARTCRN Artery-Coronary, ARTTBL Artery-Tibial, BLDDER Bladder, BRNAMY Brain-Amygdala, BRNACC Brain-Anterior cingulate cortex (BA24), BRNCDT Brain-Caudate(basal ganglia), BRNCHB Brain-Cerebellar Hemisphere, BRNCHA Brain-Cerebellum, BRNCTXA Brain-Cortex, BRNCTXB Brain-Frontal Cortex (BA9), BRNHPP Brain-Hippocampus, BRNHPT Brain-Hypothalamus, BRNNCC Brain Nucleus accumbens(basal ganglia), BRNPTM Brain-Putamen (basal ganglia), BRNSPC Brain-Spinal cord(cervical c-1), BRNSNG Brain-Substantia nigra, BREAST Breast-Mammary Tissue, LCL Cells-EBV-transformed lymphocytes, FIBRBLS Cells-Transformed fibroblasts, CVXECT Cervix-Ectocervix, CVSEND Cervix-Endocervix, CLNSGM Colon-Sigmoid, CLNTRN Colon-Transverse, ESPGEJ Esophagus-Gastroesophageal Junction, ESPMCS Esophagus-Mucosa, ESPMSL Esophagus-Muscularis, FLLPNT Fallopian Tube, HRTAA Heart-Atrial Appendage, HRTLV Heart-Left Ventricle, KDNCTX Kidney-Cortex, LIVER Liver, LUNG Lung, SLVRYG Minor Salivary Gland, MSCLSK Muscle-Skeletal, NERVET Nerve-Tibial, OVARY Ovary, PNCREAS Pancreas, PTTARY Pituitary, PRSTTE Prostate, SKINNS Skin-Not Sun Exposed (Suprapubic), SKINS Skin-Sun Exposed (Lower leg), SNTTRM Small Intestine-Terminal Ileum, SPLEEN Spleen, STMACH Stomach, TESTIS Testis, THYROID Thyroid, UTERUS Uterus, VAGINA Vagina, WHLBLD Whole Blood
Fig. 9
Fig. 9
Discovery and replication Z-scores for lipid trait. This figure shows the Z-scores of the association between dyslipidemia (GERA) and predicted gene expression levels on the vertical axis and the Z-scores for LDL cholesterol on the horizontal axis. To facilitate visualization, very large Z-scores where thresholded to 10. Proportions in each quadrant were computed excluding Z-scores with magnitude smaller than 2 to filter out noise

References

    1. Nica AC, et al. Candidate causal regulatory effects by integration of expression QTLs with complex trait genetic associations. PLOS Genet. 2010;6:1000895. doi: 10.1371/journal.pgen.1000895. - DOI - PMC - PubMed
    1. Nicolae DL, et al. Trait-associated SNPs are more likely to be eQTLs: annotation to enhance discovery from GWAS. PLOS Genet. 2010;6:e1000888. doi: 10.1371/journal.pgen.1000888. - DOI - PMC - PubMed
    1. Li YI, et al. RNA splicing is a primary link between genetic variation and disease. Science. 2016;352:600–604. doi: 10.1126/science.aad9417. - DOI - PMC - PubMed
    1. Gusev A, et al. Partitioning heritability of regulatory and cell-type-specific variants across 11 common diseases. Am. J. Hum. Genet. 2014;95:535–552. doi: 10.1016/j.ajhg.2014.10.004. - DOI - PMC - PubMed
    1. Battle A, et al. Characterizing the genetic basis of transcriptome diversity through RNA-sequencing of 922 individuals. Genome Res. 2014;24:14–24. doi: 10.1101/gr.155192.113. - DOI - PMC - PubMed

Publication types

LinkOut - more resources