. 2018 May 8;9(1):1816.
doi: 10.1038/s41467-018-04128-5.

Recurrent hotspot mutations in HRAS Q61 and PI3K-AKT pathway genes as drivers of breast adenomyoepitheliomas

Affiliations

Recurrent hotspot mutations in HRAS Q61 and PI3K-AKT pathway genes as drivers of breast adenomyoepitheliomas

Felipe C Geyer et al. Nat Commun. .

Abstract

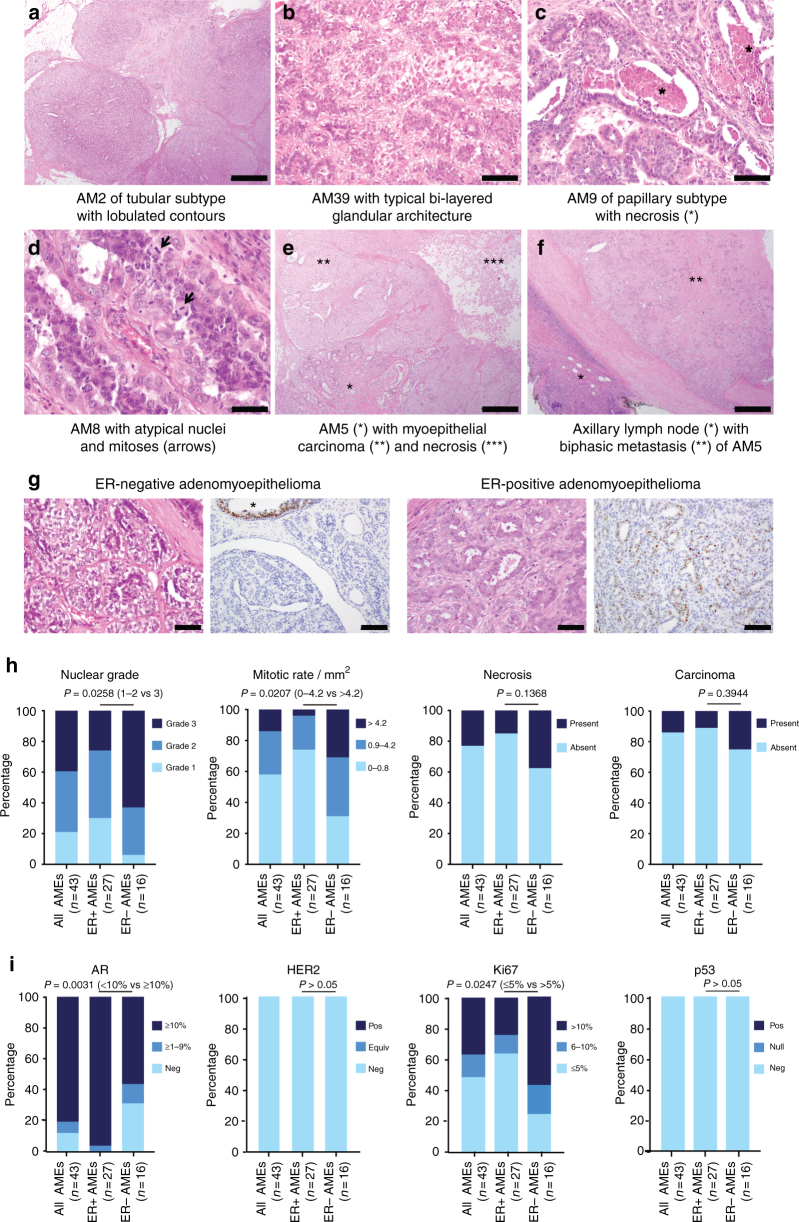
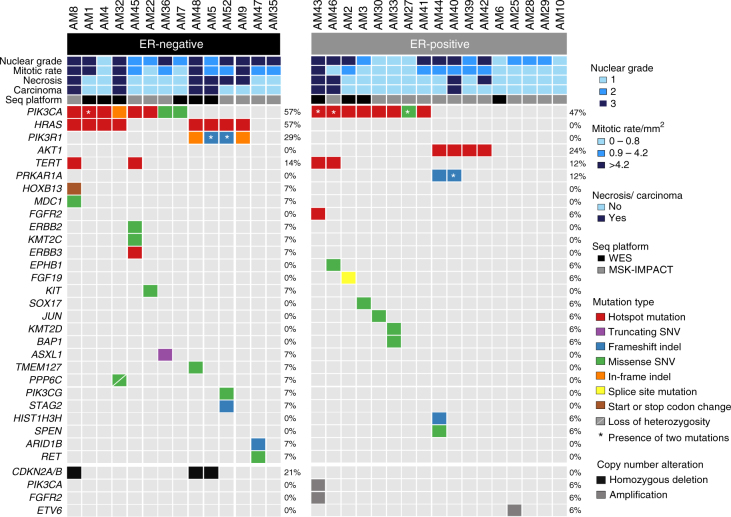
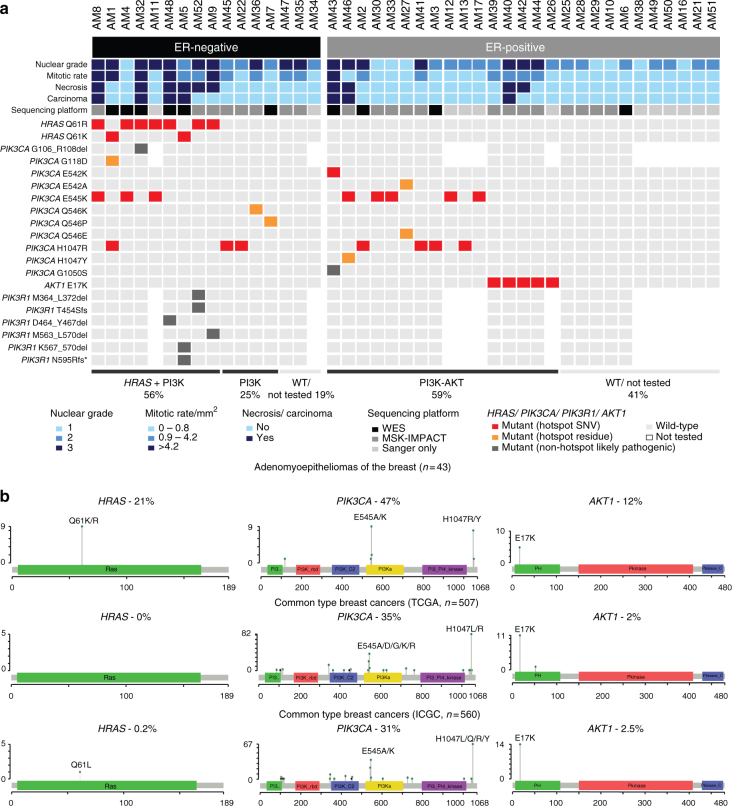
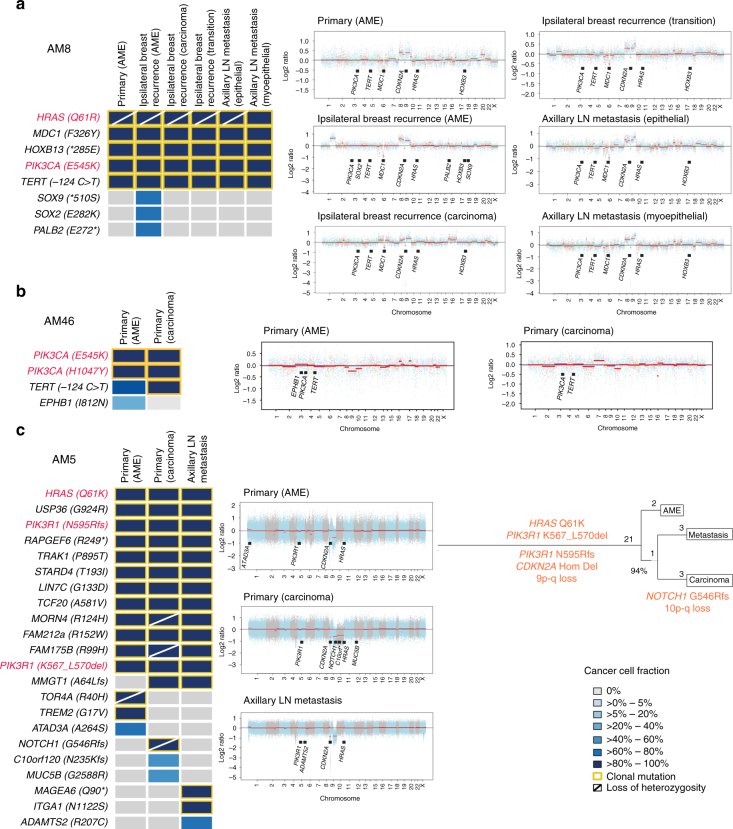
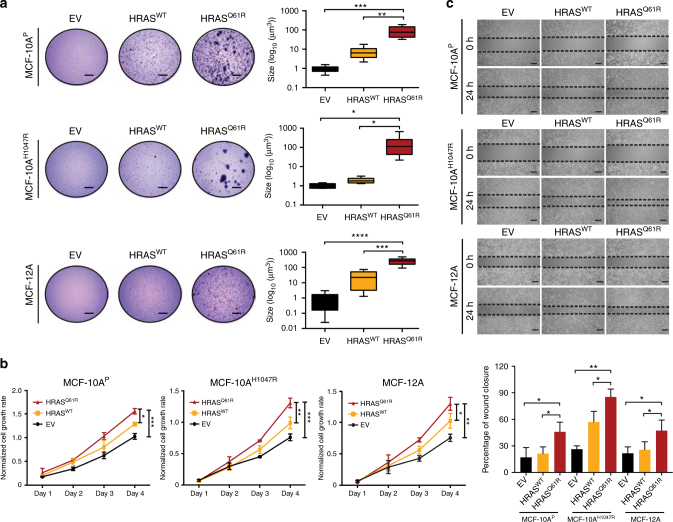
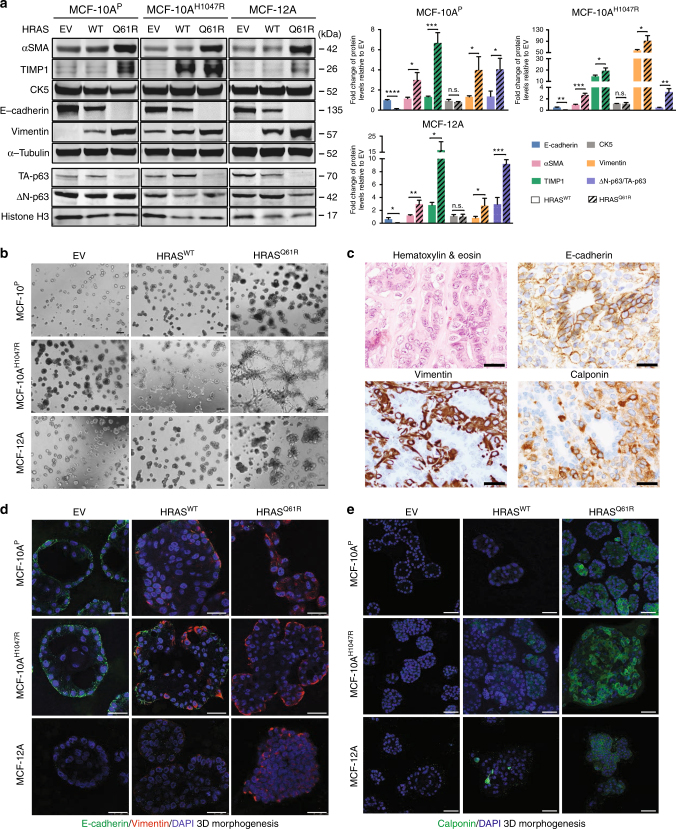
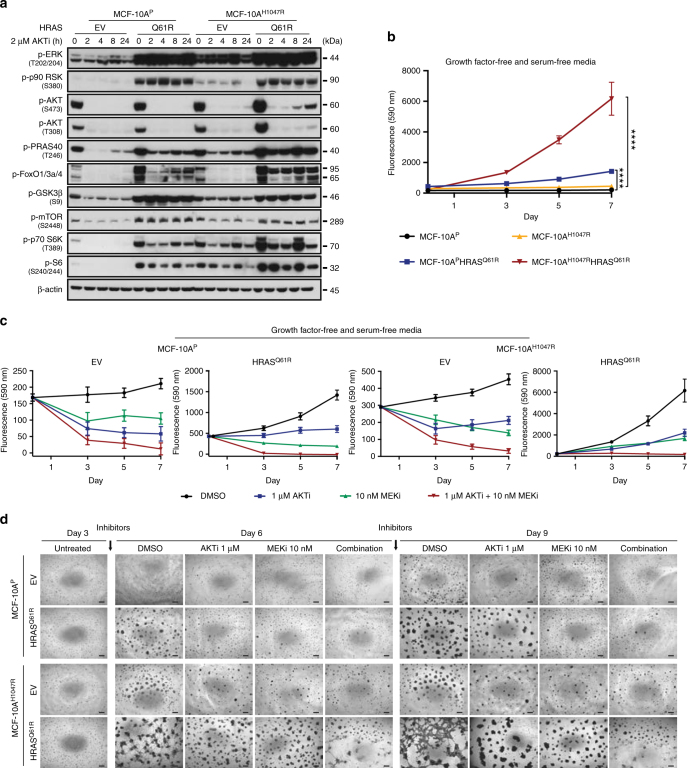
Adenomyoepithelioma of the breast is a rare tumor characterized by epithelial-myoepithelial differentiation, whose genetic underpinning is largely unknown. Here we show through whole-exome and targeted massively parallel sequencing analysis that whilst estrogen receptor (ER)-positive adenomyoepitheliomas display PIK3CA or AKT1 activating mutations, ER-negative adenomyoepitheliomas harbor highly recurrent codon Q61 HRAS hotspot mutations, which co-occur with PIK3CA or PIK3R1 mutations. In two- and three-dimensional cell culture models, forced expression of HRASQ61R in non-malignant ER-negative breast epithelial cells with or without a PIK3CAH1047R somatic knock-in results in transformation and the acquisition of the cardinal features of adenomyoepitheliomas, including the expression of myoepithelial markers, a reduction in E-cadherin expression, and an increase in AKT signaling. Our results demonstrate that adenomyoepitheliomas are genetically heterogeneous, and qualify mutations in HRAS, a gene whose mutations are vanishingly rare in common-type breast cancers, as likely drivers of ER-negative adenomyoepitheliomas.


Conflict of interest statement

The authors declare no competing interests.

Figures

Fig. 1
Fig. 1
Histologic and immunohistochemical features of adenomyoepitheliomas. a−f Representative micrographs of hematoxylin-and-eosin (H&E)-stained adenomyoepitheliomas included in this study. a Low-power magnification of AM2, a multilobulated lesion, of tubular architectural pattern, with well-circumscribed borders (scale bar, 1 mm). b Intermediate-power magnification of AM39 displaying the typical bi-layered glandular architecture of adenomyoepitheliomas, comprising abluminal myoepithelial cells with clear cytoplasm and inner cuboidal epithelial cells with eosinophilic cytoplasm and apical snouts (scale bar, 200 μm). c AM9 displaying areas of comedo-like necrosis (*, scale bar, 200 μm). d AM8 displaying nuclear atypia and mitotic figures (arrowheads, scale bar, 100 μm). e AM5 displaying an adenomyoepithelioma component (lower left corner, *) in association with a larger high-grade myoepithelial carcinoma (**), with large central necrosis in the upper right corner (***, scale bar, 1 mm). f Axillary lymph node metastasis of AM5 (scale bar, 1 mm), where the biphasic architecture is maintained. *, residual lymph node; **, metastatic lesion. g Representative micrographs of estrogen receptor (ER)-negative and ER-positive adenomyoepitheliomas. On the left, H&E stain of each case (scale bars, 100 μm). On the right, ER immunohistochemistry results. Note the internal positive control (*) in the ER-negative case. h Stacked bar plots showing the frequency of histologic features indicative of a more aggressive behavior (nuclear grade, mitotic rate, and necrosis) and of the presence of associated carcinoma according to ER status (ER-positive versus ER-negative comparisons were performed using two-tailed Fisher’s exact tests). The histologic features are color-coded according to the legends. AME, adenomyoepithelioma. i Stacked bar plots showing the frequency of the expression of androgen receptor, HER2, Ki67, and p53 according to ER status (ER-positive versus ER-negative comparisons were performed using two-tailed Fisher’s exact tests). AME, adenomyoepithelioma; AR, androgen receptor; Equiv, equivocal; Neg, negative; Pos, positive
Fig. 2
Fig. 2
Repertoire of somatic genetic alterations in breast adenomyoepitheliomas. Heatmap depicting the somatic genetic alterations identified in 31 breast adenomyoepitheliomas subjected to whole-exome (WES, n = 10) or MSK-IMPACT (n = 21) sequencing. Somatic mutations affecting the 410 genes present in the MSK-IMPACT assay are plotted, in decreasing overall mutational frequency, followed by selected genes affected by amplifications or homozygous deletions at the bottom. Cases are shown in columns (estrogen receptor (ER)-negative cases on the left; ER-positive cases on the right), and genes in rows. Histopathologic characteristics and sequencing platforms are shown in the phenotype bars at the top. Genetic alterations are color-coded according to the legend. Loss of heterozygosity (LOH) is represented by a diagonal bar. The presence of two mutations in the same gene is indicated by an asterisk. In cases subjected to WES, hotspot mutations affecting the promoter of TERT were investigated by Sanger sequencing. Hotspot mutations were obtained from Chang et al.. Seq platform, sequencing platform employed; SNV, single nucleotide variant; indel, small insertion or deletion
Fig. 3
Fig. 3
Somatic mutations affecting HRAS and PI3K-AKT pathway-related genes in breast adenomyoepitheliomas. a Heatmap depicting somatic mutations affecting HRAS, PIK3CA, AKT1, and PIK3R1 identified in 43 breast adenomyoepitheliomas by (i) both massively parallel sequencing (WES or MSK-IMPACT) and Sanger sequencing or (ii) Sanger sequencing only. Cases are shown in columns (estrogen receptor (ER)-negative cases on the left; ER-positive cases on the right), and genes in rows. Histopathologic characteristics and sequencing platforms are shown at the top, and color-coded according to the legend at the bottom. Hotspot mutations were obtained from Chang et al.. SNV, single nucleotide variant; WES, whole-exome sequencing; WT, wild-type. b Spectrum of somatic mutations affecting HRAS, PIK3CA, and AKT1 identified in the 43 breast adenomyoepitheliomas analyzed in this study, and in unselected breast cancers from The Cancer Genome Atlas (TCGA, n = 507) and International Cancer Genome Consortium (ICGC, n = 560) studies. Diagrams representing the protein domains of HRAS encoded by HRAS (left), p110α encoded by PIK3CA (middle), and AKT1 encoded by AKT1 (right). The mutations in these three genes are shown on the x-axis, and the height of each “lollipop” indicates the frequency of the mutation (y-axis). Missense mutations are depicted as green circles, and small insertions and deletions are shown in black circles. Plots were generated using MutationMapper on cBioPortal (www.cBioPortal.org) and were manually edited
Fig. 4
Fig. 4
Progression of breast adenomyoepitheliomas. a−c On the left, heatmaps depicting the cancer cell fractions of the mutations identified in separately microdissected, histologically distinct components of AM8, AM46, and AM5; and on the right the copy number genome plots of each component. Cancer cell fractions were determined using ABSOLUTE, and color-coded according to the legend. Loss of heterozygosity (LOH) is shown with a diagonal bar. Clonal mutations are highlighted with orange boxes. Mutations affecting HRAS and/or PI3K-AKT pathway-related genes are highlighted in red. In copy number genome plots, the genomic position is plotted on the x-axis and the Log2 ratios on the y-axis, and the cancer genes affected by somatic mutations and any gene affected by subclonal somatic mutations are shown according to their genomic position. a AM8, where the primary adenomyoepithelioma (AME), separately microdissected components of an ipsilateral relapse in the breast tissue (AME, invasive ductal carcinoma and transition components) and of separately microdissected components of a metachronous axillary lymph node metastasis (epithelial- and myoepithelial-enriched components) were analyzed by MSK-IMPACT sequencing. b AM46, where the breast adenomyoepithelioma and spindle cell metaplastic carcinoma components of the primary tumor were analyzed by MSK-IMPACT sequencing. c AM5, where the breast adenomyoepithelioma and myoepithelial metaplastic carcinoma components of the primary tumor and a synchronous axillary lymph node metastasis were analyzed by whole-exome sequencing (WES). The phylogenetic tree was constructed using Treeomics. The length of the trunk and branches is proportional to the number of mutations defining each trunk or branches. Likely driver genes and copy number alterations found in the trunk and branches are highlighted in orange. Hom Del, homozygous deletion; LN, lymph node
Fig. 5
Fig. 5
Mutant HRASQ61R expression induces transformation and growth in non-malignant breast epithelial cells. a Representative images of soft agar anchorage-independent growth assay of parental MCF-10A PIK3CA-wild-type (MCF-10AP), MCF-10A PIK3CA H1047R-mutant (MCF-10AH1047R), and MCF-12A cells stably expressing empty vector (EV), HRAS-wild-type (HRASWT), or HRAS Q61R-mutant (HRASQ61R) protein (scale bars, 2 mm). Boxplots showing the quantification of the size of colonies (see Methods). The mean value of the size of colonies, and the 75th and 25th percentiles are displayed at the top and bottom of the boxes, respectively. b MTT cell proliferation assay of MCF-10AP, MCF-10AH1047R, and MCF-12A cells stably expressing EV (black), HRASWT (yellow), or mutant HRASQ61R (red) protein. c The migratory effects of MCF-10AP, MCF-10AH1047R, and MCF-12A cells stably expressing EV, HRASWT, or mutant HRASQ61R were analyzed using the wound-healing assay at 0 and 24 h. Scale bars, 500 µm. In ac, data are representative of three independent experiments. Error bars, s.d. of mean (n = 3). n.s. = not significant, *P < 0.05, **P < 0.01, ***P < 0.001, ****P< 0.0001; two-tailed unpaired t-tests
Fig. 6
Fig. 6
Expression of mutant HRASQ61R results in the acquisition of a partial myoepithelial phenotype in non-malignant breast epithelial cells. a Representative western blot (left) analysis of total protein expression of alpha-smooth muscle actin (αSMA), TIMP1, cytokeratin 5 (CK5), E-cadherin, vimentin, and nuclear protein expression of ∆N-p63 and TA-p63 in MCF-10AP, MCF-10AH1047R, and MCF-12A cells stably expressing empty vector (EV), HRASWT, or mutant HRASQ61R. α-Tubulin and Histone H3 were used as protein loading controls for total and nuclear protein expression, respectively. Quantification (right) using LI-COR is shown based on experiments done in triplicate. Comparisons of protein levels were performed between HRASWT and mutant HRASQ61R, both relative to EV. Error bars, s.d. of mean (n = 3). n.s. = not significant, *P < 0.05, **P < 0.01, ***P < 0.001, ****P < 0.0001; two-tailed unpaired t-test. b Representative micrographs of cells cultured in three-dimensional basement membrane for 10 days showing the effects of EV, HRASWT, or mutant HRASQ61R expression in MCF-10AP, MCF-10AH1047R, and MCF-12A cells on growth and glandular architecture (scale bars, 400 µm). c Representative micrographs of E-cadherin, vimentin, and calponin immunohistochemical expression in a HRAS and PIK3CA mutant adenomyoepithelioma (AM32). Note the bi-layered glandular architecture where E-cadherin is preferentially expressed in the inner epithelial layer, whereas vimentin and calponin decorate the outer myoepithelial layer (scale bars, 50 µm). d, e Representative confocal images of immunofluorescence analysis of d E-cadherin (green) and vimentin (red) and 4,6-diamidino-2-phenylindole (DAPI, blue; scale bars, 25 µm), and e calponin (green) and DAPI (blue; scale bars, 50 µm) of MCF-10AP, MCF-10AH1047R, and MCF-12A cells stably expressing EV, HRASWT, or mutant HRASQ61R grown in three-dimensional basement membrane culture for 10 days. In b, d and e, experiments were independently performed at least three times
Fig. 7
Fig. 7
Impact of AKT and MEK inhibition on PI3K-AKT and MAPK signaling pathways and proliferation in non-malignant breast epithelial cells expressing mutant HRASQ61R. a Representative western blot analysis of p-ERK1/2 (T202/Y204), p-p90 RSK (S380), p-AKT (S473), p-AKT (T308), p-PRAS40 (T246), p-FOXO1/3a/4, p-GSK3β (S9), p-mTOR (S2448), p-p70 S6K (T389), and p-S6 (S240/244) protein in MCF-10AP and MCF-10AH1047R cells stably expressing empty vector (EV) or mutant HRASQ61R treated with 2 µM AKT inhibitor (AKTi, MK2206) at different time points. β-actin was used as a protein loading control. Experiments were repeated at least twice with similar results. b Cell proliferation assay of MCF-10AP and MCF-10AH1047R cells stably expressing EV or mutant HRASQ61R. ****P< 0.0001; two-tailed unpaired t-test. c Inhibition effects of cells treated with DMSO (black), 1 µM AKTi (blue), 10 nM MEK inhibitor (MEKi, GSK212, green), and combination of 1 µM AKTi and 10 nM MEKi (red) for 3, 5, and 7 days. In b and c, cells were cultured in growth factor- and serum-free media. Data are representative of three independent experiments. Error bars, s.d. of mean (n = 3). d Representative micrographs of MCF-10AP and MCF-10AH1047R cells stably expressing EV or mutant HRASQ61R cultured after 3 days and treated with DMSO, 1 µM AKTi, 10 nM MEKi, or combination of 1 µM AKT and 10 nM MEK inhibitors for 6 and 9 days are shown (scale bars, 400 µm). DMSO or inhibitors were added after seeding the cells in three-dimensional basement membrane for 3 days; fresh media with DMSO or inhibitors was replenished every 3 days. Triplicate experiments were repeated at least twice with similar results

References

    1. Hayes MM. Adenomyoepithelioma of the breast: a review stressing its propensity for malignant transformation. J. Clin. Pathol. 2011;64:477–484. doi: 10.1136/jcp.2010.087718. - DOI - PubMed
    1. Lakhani SR, Ellis IO, Schnitt SJ, Tan PH, van de Vijver MJ. WHO Classification of Tumours of the Breast. Lyon: IARC; 2012.
    1. Nadelman CM, Leslie KO, Fishbein MC. “Benign,” metastasizing adenomyoepithelioma of the breast: a report of 2 cases. Arch. Pathol. Lab. Med. 2006;130:1349–1353. - PubMed
    1. Moritz AW, Wiedenhoefer JF, Profit AP, Jagirdar J. Breast adenomyoepithelioma and adenomyoepithelioma with carcinoma (malignant adenomyoepithelioma) with associated breast malignancies: a case series emphasizing histologic, radiologic, and clinical correlation. Breast. 2016;29:132–139. doi: 10.1016/j.breast.2016.07.018. - DOI - PubMed
    1. Ng CK, Schultheis AM, Bidard FC, Weigelt B, Reis-Filho JS. Breast cancer genomics from microarrays to massively parallel sequencing: paradigms and new insights. J. Natl. Cancer Inst. 2015;107:djv015. - PubMed

Publication types

MeSH terms