. 2018 May 8;8(1):7292.
doi: 10.1038/s41598-018-24064-0.

Essential Role of Linx/Islr2 in the Development of the Forebrain Anterior Commissure

Affiliations

Essential Role of Linx/Islr2 in the Development of the Forebrain Anterior Commissure

Shaniya Abudureyimu et al. Sci Rep. .

Abstract

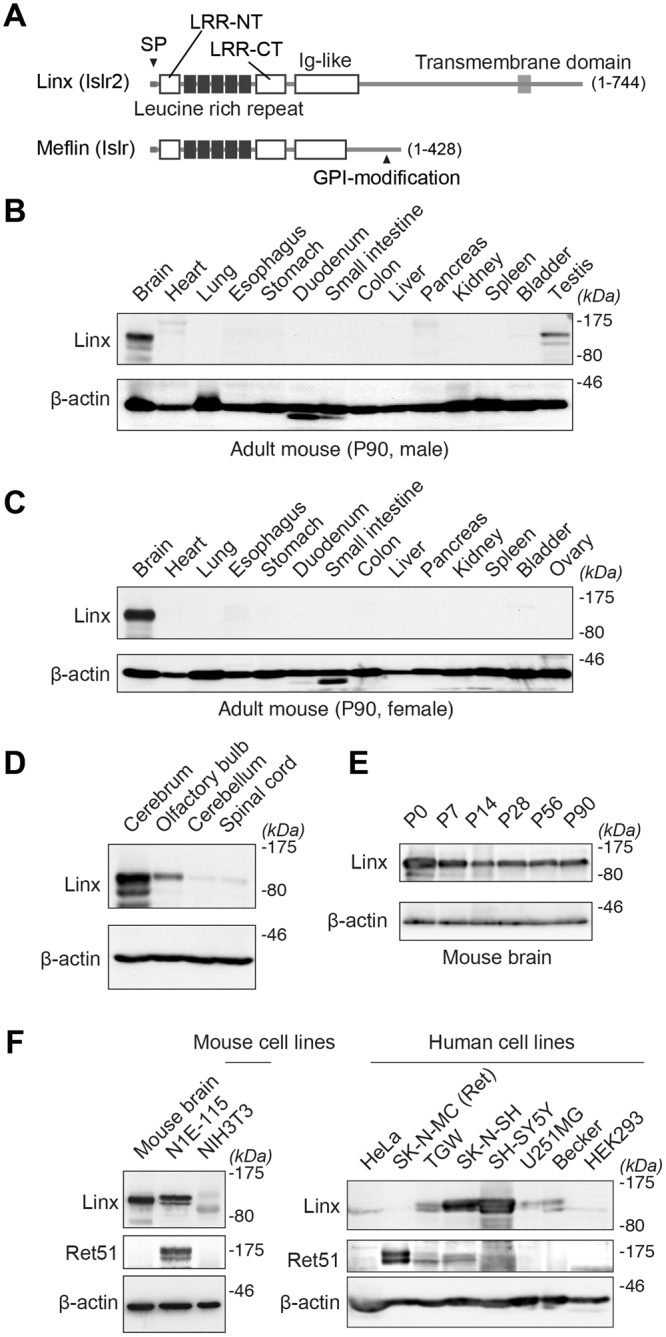
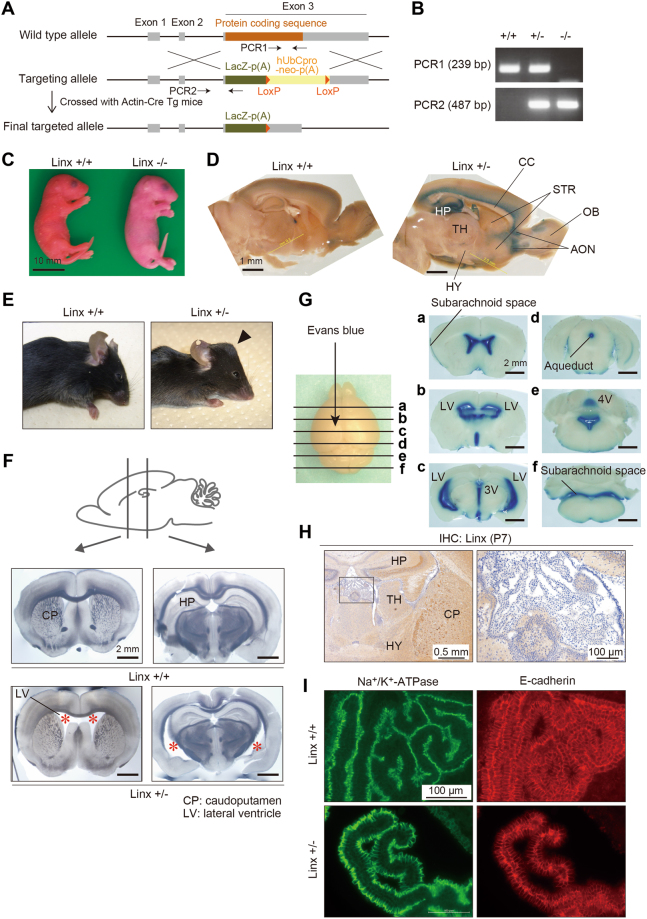
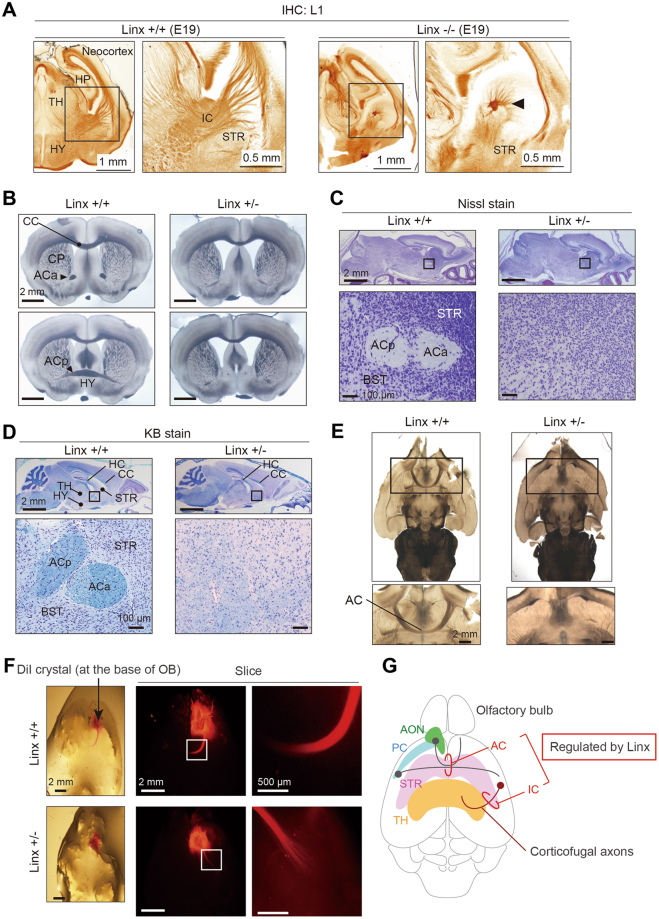
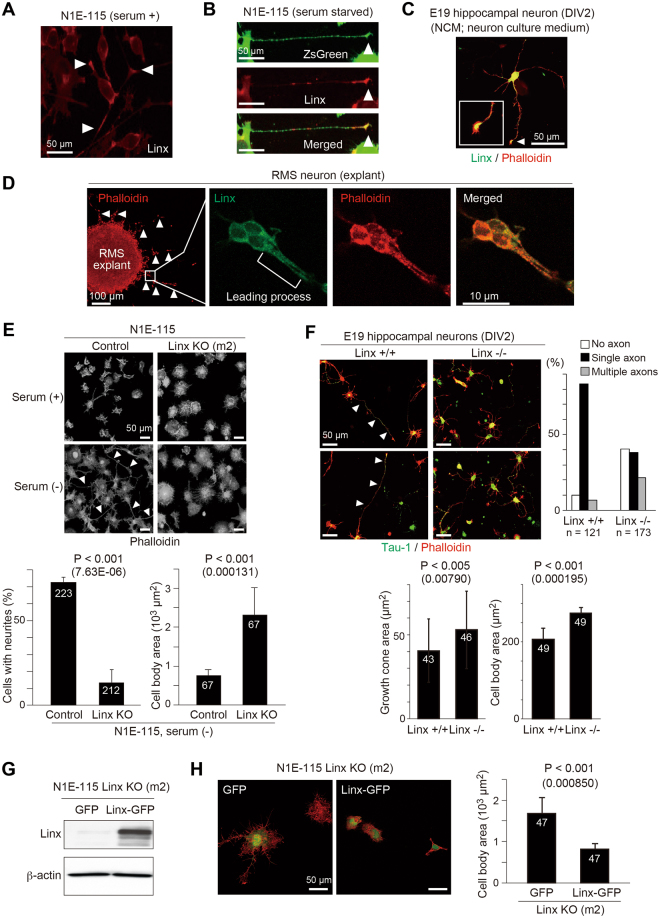
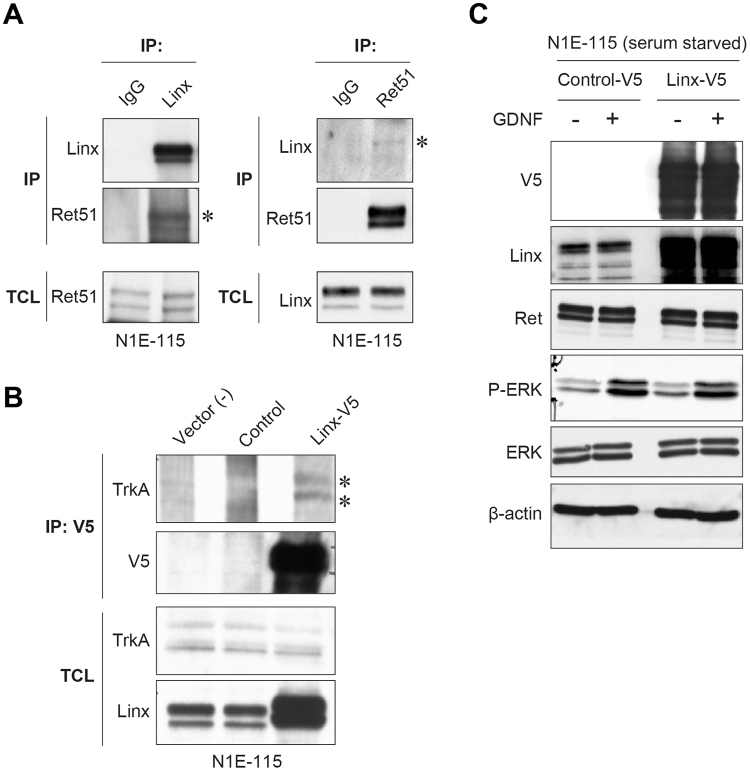
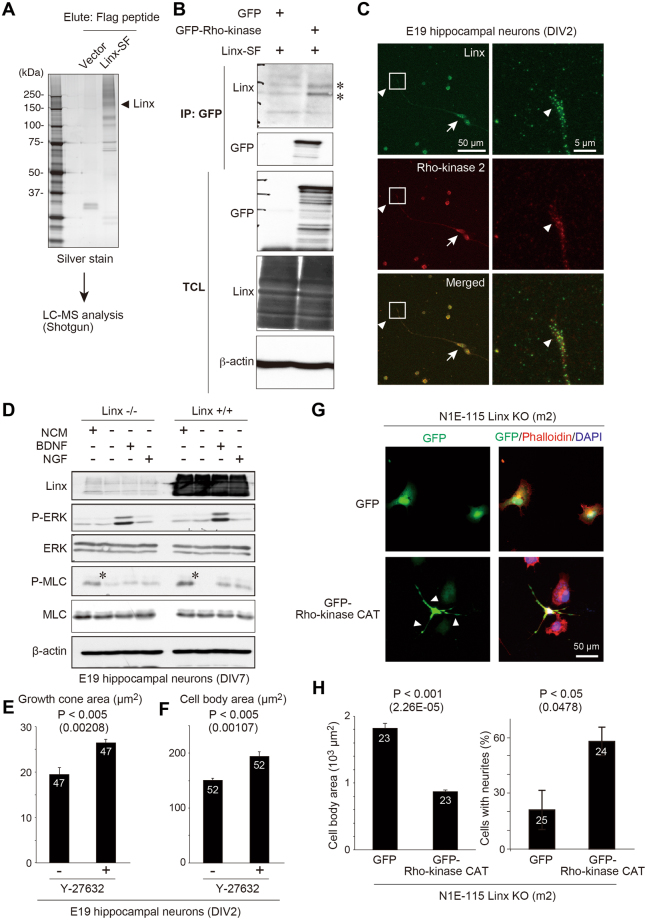
Linx is a member of the leucine-rich repeat and immunoglobulin family of membrane proteins which has critical roles in the development of the peripheral nervous system and forebrain connectivity. A previous study showed that Linx is expressed in projection neurons in the cortex and in cells that comprise the passage to the prethalamus that form the internal capsule, indicating the involvement of Linx in axon guidance and cell-cell communication. In this study, we found that Linx-deficient mice develop severe hydrocephalus and die perinatally by unknown mechanisms. Importantly, mice heterozygous for the linx gene exhibited defects in the development of the anterior commissure in addition to hydrocephalus, indicating haploinsufficiency of the linx gene in forebrain development. In N1E-115 neuroblastoma cells and primary cultured hippocampal neurons, Linx depletion led to impaired neurite extension and an increase in cell body size. Consistent with this, but of unknown significance, we found that Linx interacts with and upregulates the activity of Rho-kinase, a modulator of many cellular processes including cytoskeletal organization. These data suggest a role for Linx in the regulation of complex forebrain connectivity, and future identification of its extracellular ligand(s) will help clarify this function.


Conflict of interest statement

The authors declare no competing interests.

Figures

Figure 1
Figure 1
Linx expression in the forebrain and neuroblastoma cell lines. (A) Domain structures of Linx/Islr2 and its paralogue Meflin/Islr. Amino acid numbers are shown in parentheses. SP, signal peptide; LRR, leucine-rich repeat; LRR-NT and CT, LRR N-terminal and C-terminal cysteine-rich domains; GPI, glycosylphosphatidylinositol. (B,C) Tissue distribution of Linx in adult male (B) and female (C) mice. Lysates prepared from the indicated tissues were analyzed by Western blot with the indicated antibodies. kDa, kilodaltons; P, postnatal day. Full blot images are shown in Supplementary Figure S3. (D) Linx is preferentially expressed in the forebrain but not the hindbrain nor the spinal cord. Full blot images are shown in Supplementary Figure S3. (E) Linx is expressed in the brain throughout postnatal and adult stages in mice. Full blot images are shown in Supplementary Figure S3. (F) Linx expression in mouse and human cell lines. Lysates prepared from each mouse (left) and human (right) cell line were subjected to Western blot analysis, which revealed high levels of Linx expression in the neuroblastoma cell lines including N1E-115, SK-N-SH, and SH-SY5Y. Full blot images are shown in Supplementary Figure S3.
Figure 2
Figure 2
Linx+/− mice exhibit severe hydrocephalus. (A) A schematic illustration showing the strategy for targeting the linx (islr2) gene in mice, as designed by the KOMP. Note that exon 3 of the linx gene encodes an entire ORF. (B) Representative data from genotypic PCR shows the complete deletion of the wild-type alleles in Linx−/− mice. (C) Linx−/− mice die perinatally of unknown causes and have dry skin. A representative view of newborn mice just after birth is shown. (D) X-gal staining of P26 brain slices prepared from Linx+/− mice shows the expression of Linx in a region near the apical surface of the cortex, hippocampus (HP), and the AON. STR, striatum; HY, hypothalamus; CC, corpus callosum. (E) Gross appearance of the heads of P14 wild-type and Linx+/− mice. Note the visible skull bump (arrowhead) found in Linx+/− mice. (F) Transmitted light images of coronal sections of P21 mouse brains show an enlarged LV (asterisks) in Linx+/− (lower panel) but not wild-type (upper panel) mice. CP, caudoputamen. (G) The distribution of Evans dye injected into the LV of the Linx+/− P21 mouse brain, showing that Linx+/− mice develop a communicating form of hydrocephalus. (H) No apparent expression of Linx in the ependymal cells of the choroid plexus. A boxed area was magnified in the adjacent panel. (I) No apparent differences in the expression and localization of Na+/K+-ATPase (left) and E-cadherin (right), markers for the apical and lateral membranes, respectively, in the ependymal cells of the choroid plexus between Linx+/+ (upper panel) and Linx+/− (lower panel) mice.
Figure 3
Figure 3
Defective AC development in Linx+/− mice. (A) A defect in IC development found in Linx−/− mice. The coronal sections of brains from Linx+/+ (left) and Linx−/− (right) E19 embryonic mice were stained for L1, a neuronal adhesion molecule, to visualize the IC. An arrowhead denotes the remnants of the descending component of the IC. Boxed areas were magnified in the adjacent panels. (B–D) Transmitted light (B), Nissl-stained (C), and KB-stained (D) images of coronal sections from P30 mouse brains showing the defects in the AC of Linx+/− mice. ACp, posterior branch of the AC; ACa, anterior branch of the AC; TH, thalamus; HC, hippocampal commissure; BST, bed nuclei of the stria terminalis. (E) Horizontal sections from the brains of wild-type (left) and Linx+/− (right) mice showing defective AC development in Linx+/− mice. Boxed areas are magnified in the lower panels. (F) The axon tract from the AON was labeled with DiI crystals placed around the AON regions prepared from wild-type and Linx+/− mice. The axon tract that constitutes the anterior branch of the AC was short and disrupted in Linx+/− mice compared with wild-type mice. Boxed areas are magnified in the adjacent panels. (G) A schematic illustration representing the neural projections regulated by Linx; this is based on data from both previous and present studies.
Figure 4
Figure 4
Linx regulates neurite extension and cell body size. (A,B) Linx is localized to the tips (arrowheads) of neurites in both undifferentiated (A) and differentiated (B) N1E-115 cells. In (B), ZsGreen was transfected as a fill to visualize cell bodies and neurites. (C) Linx preferentially localizes to the growth cones (arrowhead) of growing axons in cultured primary hippocampal neurons. DIV, days in vitro. The growth cone is shown enlarged in the inset. (D) Linx localization in the leading processes and cell bodies of neuroblasts (arrowheads) that are migrating out from RMS explants embedded in Matrigel. Boxed areas are enlarged in adjacent panels. (E) Linx depletion leads to defective elongation of neurites in N1E-115 cells. Arrowheads indicate neurites. The graphs show the number of cells possessing neurites greater than 50 µm in length (lower left) and cell body size (lower right). Note that the average cell body size of Linx-depleted cells was much larger than control cells. The numbers in bars indicate the numbers of samples analyzed. (F) Hippocampal neurons isolated from the brain of Linx−/− embryos at embryonic day (E) 19 show defective elongation of axons compared with wild-type (Linx+/+) embryos. Arrowheads indicate Tau-1-positive axons. The graphs show the number of axons identified by Tau-1 staining (upper right), growth cone area (lower left) and cell body size (lower right) of the neurons. The numbers in bars indicate the numbers of samples analyzed. (G) Re-expression of Linx-GFP in Linx-depleted N1E-115 cells as confirmed by Western blot analysis with an anti-Linx antibody. Full blot images are shown in Supplementary Figure S3. (H) Rescue of cell body size by the expression of Linx-GFP, but not GFP only, in N1E-115 cells depleted of endogenous Linx. The graph shows the quantified cell body size measured as surface area.
Figure 5
Figure 5
Interaction of Linx with RTKs and its effect on ERK signaling. (A) Linx interaction with Ret. Lysates from N1E-115 cells were immunoprecipitated (IP) using Linx (left) and Ret51 (right; an isoform of Ret) antibodies, followed by Western blot analysis with the indicated antibodies. Asterisks indicate co-immunoprecipitated Ret51 and Linx. TCL, total cell lysates. Full blot images are shown in Supplementary Figure S3. (B) Linx interaction with TrkA. Lysates from N1E-115 cells transfected with either control or Linx-V5 vector were immunoprecipitated with V5 antibody, followed by Western blot analysis. Asterisks indicate co-immunoprecipitated TrkA. Full blot images are shown in Supplementary Figure S3. (C) N1E-115 cells transfected with either control or Linx-V5 vector were starved and stimulated with GDNF, followed by Western blot analysis using the indicated antibodies. Full blot images are shown in Supplementary Figure S3.
Figure 6
Figure 6
Identification of Rho-kinase as a Linx-interacting protein. (A) Representative silver staining of Linx-SF-interacting proteins in 293FT cells isolated by IP. (B) 293FT cells were transfected with Linx-SF (streptavidin-Flag) and either GFP or GFP-Rho-kinase, followed by IP using a GFP antibody and Western blot analysis. Asterisks denote co-immunoprecipitated Linx. Full blot images are shown in Supplementary Figure S3. (C) Colocalization of endogenous Linx and Rho-kinase at the tips of growth cones (arrowheads) and cell bodies (arrows) of primary cultured hippocampal neurons. Boxed areas were magnified in adjacent panels. (D) Linx regulates the activity of Rho-kinase. Hippocampal neurons isolated from the brain of Linx−/− (left) and Linx+/+ (right) mice at E19 were incubated in a conventional neuron culture medium (NCM) or starved followed by stimulation with either BDNF, or NGF. Lysates from the neurons were analyzed by Western blot analysis with the indicated antibodies. Note that MLC was more highly phosphorylated in Linx+/+ neurons than Linx−/− neurons when cultured in NCM (asterisks). Full blot images are shown in Supplementary Figure S3. (E,F) Primary cultured hippocampal neurons were isolated from E19 embryo and cultured in the presence or absence of Y-27632 (10 µM) for 5 days, followed the quantification of growth cone (E) and cell body (F) areas. The numbers in bars indicate the numbers of samples analyzed. (G,H) Linx-depleted N1E-115 cells (clone m2) were transfected with GFP or GFP-Rho-kinase CAT, followed by staining for the actin filament by Phalloidin and the nuclei (G) and the measurement and quantification of cell body area and the numbers of cells with neurites (H). Arrowheads indicate neurites.

References

    1. Greig LC, Woodworth MB, Galazo MJ, Padmanabhan H, Macklis JD. Molecular logic of neocortical projection neuron specification, development and diversity. Nat. Rev. Neurosci. 2013;14:755–769. doi: 10.1038/nrn3586. - DOI - PMC - PubMed
    1. Chédotal, A. & Richards, L. J. Wiring the Brain: The Biology of Neuronal Guidance. Cold Spring Harbor Perspectives in Biology2 (2010). - PMC - PubMed
    1. O’Donnell M, Chance RK, Bashaw GJ. Axon growth and guidance: receptor regulation and signal transduction. Ann. Re. Neurosci. 2009;32:383–412. doi: 10.1146/annurev.neuro.051508.135614. - DOI - PMC - PubMed
    1. Mandai K, et al. LIG family receptor tyrosine kinase-associated proteins modulate growth factor signals during neural development. Neuron. 2009;63:614–627. doi: 10.1016/j.neuron.2009.07.031. - DOI - PMC - PubMed
    1. Dolan J, et al. The extracellular leucine-rich repeat superfamily; a comparative survey and analysis of evolutionary relationships and expression patterns. BMC Genomics. 2007;8:320. doi: 10.1186/1471-2164-8-320. - DOI - PMC - PubMed

Publication types

MeSH terms

LinkOut - more resources