

Different patterns of epileptiform-like activity are generated in the sclerotic hippocampus from patients with drug-resistant temporal lobe epilepsy
- PMID: 29740014
- PMCID: PMC5940759
- DOI: 10.1038/s41598-018-25378-9
Different patterns of epileptiform-like activity are generated in the sclerotic hippocampus from patients with drug-resistant temporal lobe epilepsy
Abstract
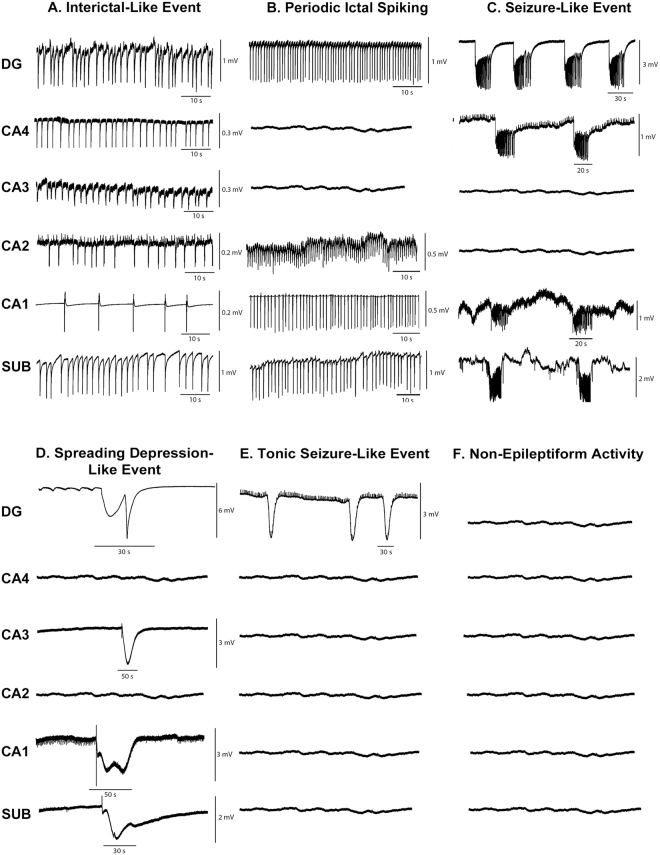
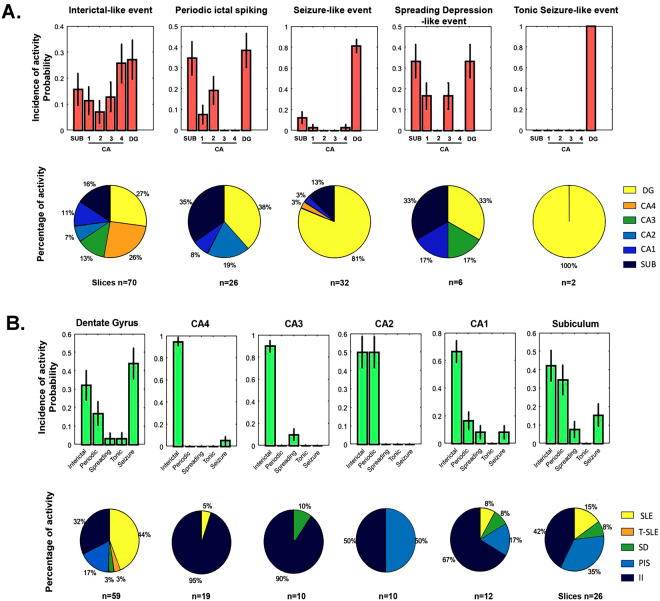
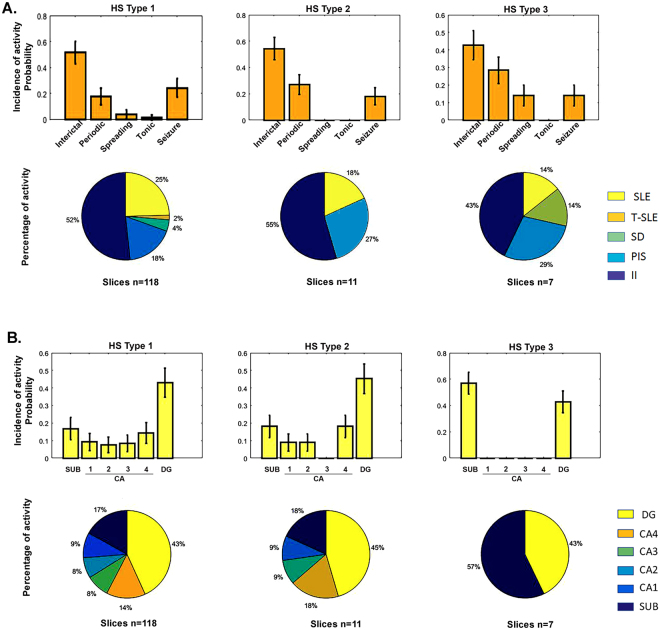
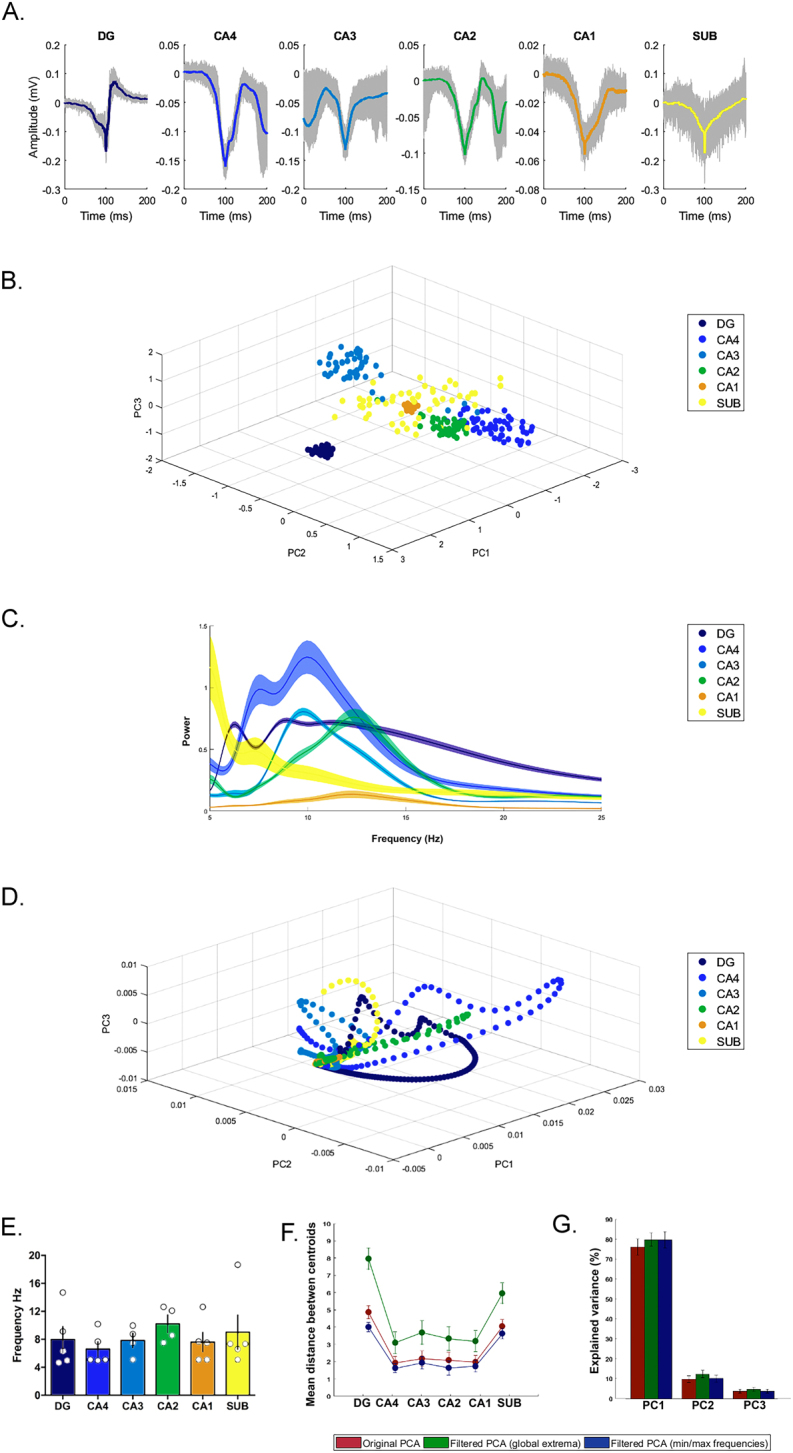
Human hippocampal slice preparations from patients with temporal lobe epilepsy (TLE) associated with hippocampal sclerosis (HS) are excellent material for the characterization of epileptiform-like activity. However, it is still unknown if hippocampal regions as cornu Ammonis (CA) 1, CA3 and CA4, generate population epileptiform-like activity. Here, we investigated epileptiform activities of the subiculum, CA1, CA2, CA3, CA4 (induced by elevation of extracellular potassium concentration) and the dentate gyrus (induced with hilar stimulation and elevation of potassium concentration) from sclerotic hippocampi of patients with drug-resistant TLE. Five types of epileptiform-like activity were observed: interictal-like events; periodic ictal spiking; seizure-like events; spreading depression-like events; tonic seizure-like events and no activity. Different susceptibilities to generate epileptiform activity among hippocampal regions were observed; the dentate gyrus was the most susceptible region followed by the subiculum, CA4, CA1, CA2 and CA3. The incidence of epileptiform activity pattern was associated with specific regions of the hippocampal formation. Moreover, it was observed that each region of the hippocampal formation exhibits frequency-specific ranges in each subfield of the sclerotic human tissue. In conclusion, this study demonstrates that epileptiform-like activity may be induced in different regions of the hippocampal formation, including regions that are severely affected by neuronal loss.
Conflict of interest statement
The authors declare no competing interests.
Figures
Similar articles
-
The epileptic human hippocampal cornu ammonis 2 region generates spontaneous interictal-like activity in vitro.Brain. 2009 Nov;132(Pt 11):3032-46. doi: 10.1093/brain/awp238. Epub 2009 Sep 18. Brain. 2009. PMID: 19767413
-
Survival of mossy cells of the hippocampal dentate gyrus in humans with mesial temporal lobe epilepsy.J Neurosurg. 2009 Dec;111(6):1237-47. doi: 10.3171/2008.11.JNS08779. J Neurosurg. 2009. PMID: 19392605
-
Stimulus and potassium-induced epileptiform activity in the human dentate gyrus from patients with and without hippocampal sclerosis.J Neurosci. 2004 Nov 17;24(46):10416-30. doi: 10.1523/JNEUROSCI.2074-04.2004. J Neurosci. 2004. PMID: 15548657 Free PMC article.
-
Interictal-ictal interactions and limbic seizure generation.Rev Neurol (Paris). 1999 Jul;155(6-7):468-71. Rev Neurol (Paris). 1999. PMID: 10472661 Review.
-
Do interictal discharges promote or control seizures? Experimental evidence from an in vitro model of epileptiform discharge.Epilepsia. 2001;42 Suppl 3:2-4. doi: 10.1046/j.1528-1157.2001.042suppl.3002.x. Epilepsia. 2001. PMID: 11520313 Review.
Cited by
-
Ex vivo multi-electrode analysis reveals spatiotemporal dynamics of ictal behavior at the infiltrated margin of glioma.Neurobiol Dis. 2020 Feb;134:104676. doi: 10.1016/j.nbd.2019.104676. Epub 2019 Nov 12. Neurobiol Dis. 2020. PMID: 31731042 Free PMC article.
-
Interictal localization of the epileptogenic zone: Utilizing the observed resonance behavior in the spectral band of surrounding inhibition.Front Neurosci. 2022 Dec 12;16:993678. doi: 10.3389/fnins.2022.993678. eCollection 2022. Front Neurosci. 2022. PMID: 36578827 Free PMC article.
-
Cell-type specific and multiscale dynamics of human focal seizures in limbic structures.Brain. 2023 Dec 1;146(12):5209-5223. doi: 10.1093/brain/awad262. Brain. 2023. PMID: 37536281 Free PMC article.
-
Impaired hippocampal functional connectivity in patients with drug resistant, generalized tonic-clonic seizures.Neuroreport. 2019 Jul 3;30(10):700-706. doi: 10.1097/WNR.0000000000001262. Neuroreport. 2019. PMID: 31116131 Free PMC article.
-
Therapeutic potential of glial cell line-derived neurotrophic factor and cell reprogramming for hippocampal-related neurological disorders.Neural Regen Res. 2022 Mar;17(3):469-476. doi: 10.4103/1673-5374.320966. Neural Regen Res. 2022. PMID: 34380873 Free PMC article. Review.
References
Publication types
MeSH terms
Substances
LinkOut - more resources
Full Text Sources
Other Literature Sources
Medical
Miscellaneous
