. 2018 May 8;8(1):7254.
doi: 10.1038/s41598-018-25354-3.

Hyperactivity of Rac1-GTPase pathway impairs neuritogenesis of cortical neurons by altering actin dynamics

Affiliations

Hyperactivity of Rac1-GTPase pathway impairs neuritogenesis of cortical neurons by altering actin dynamics

Valentina Zamboni et al. Sci Rep. .

Abstract

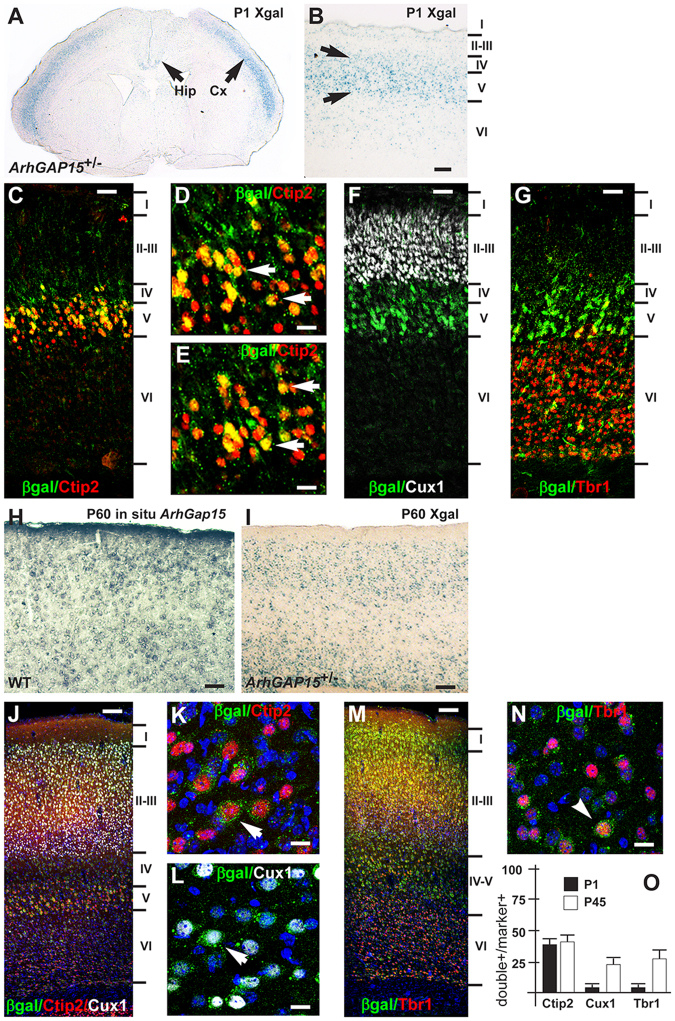
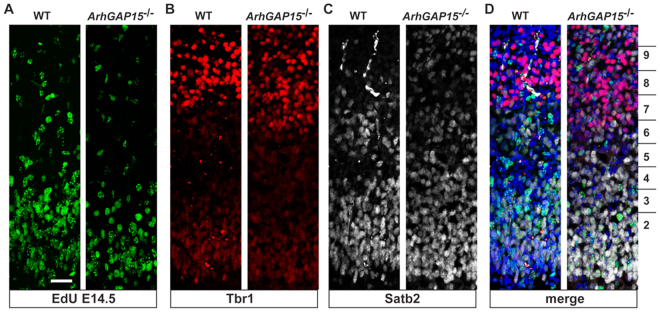
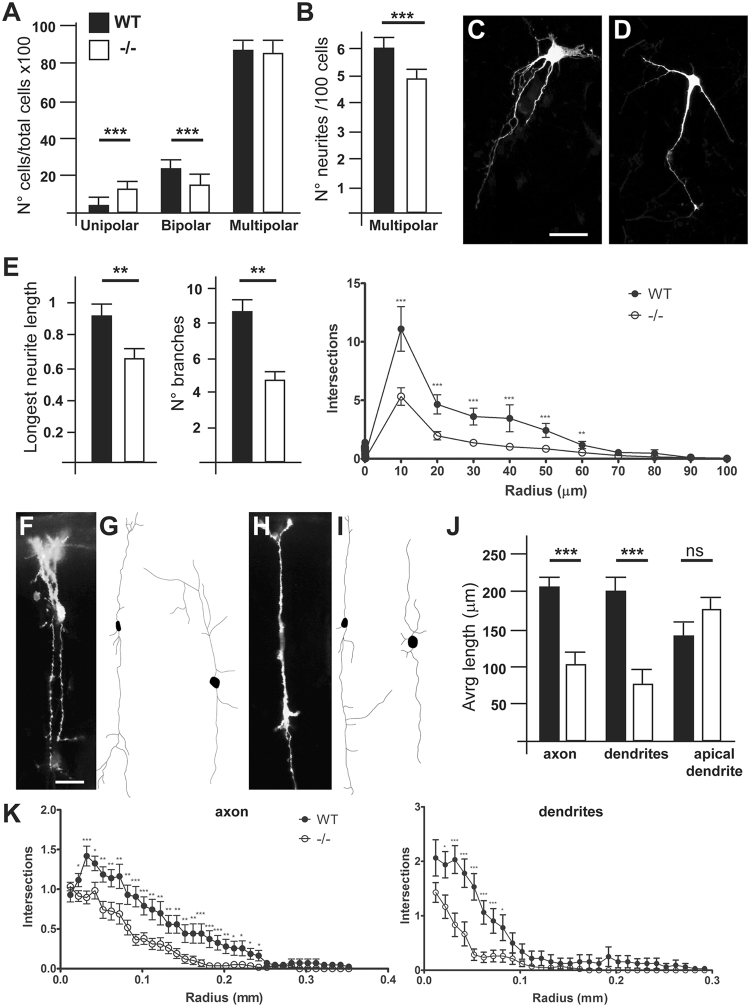
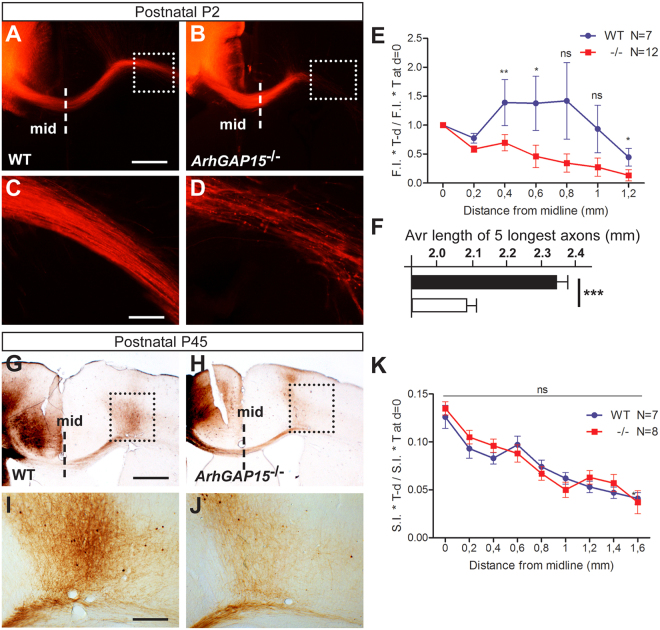
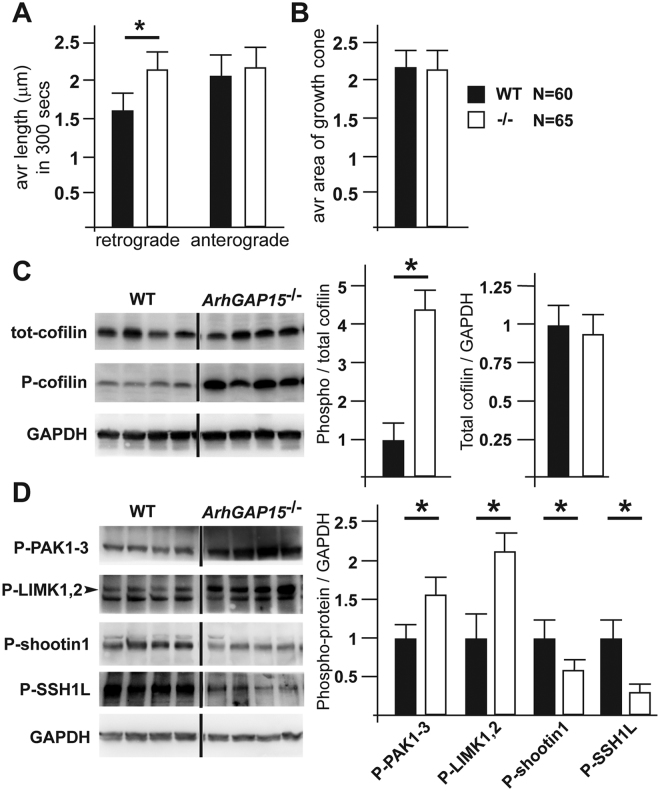
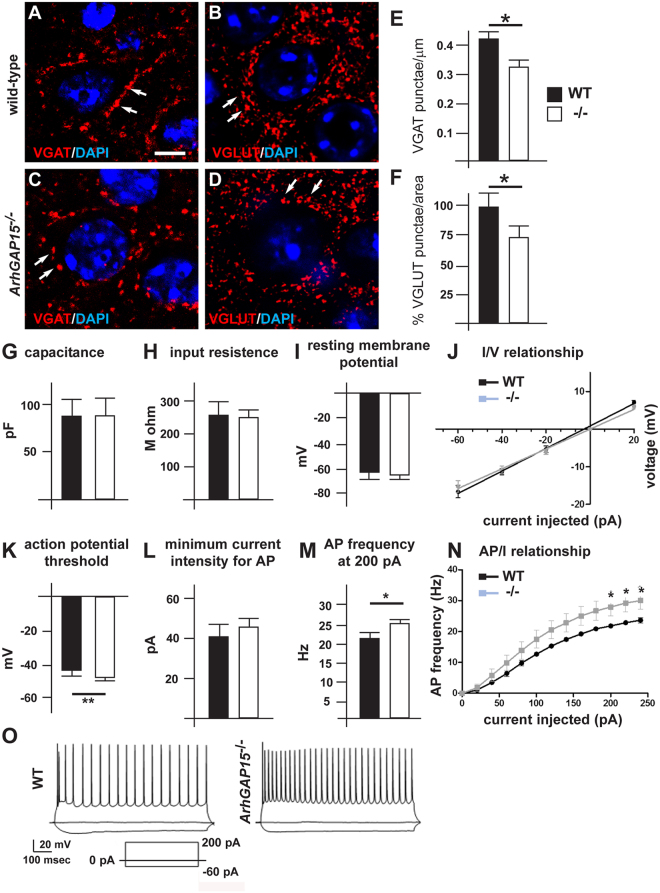
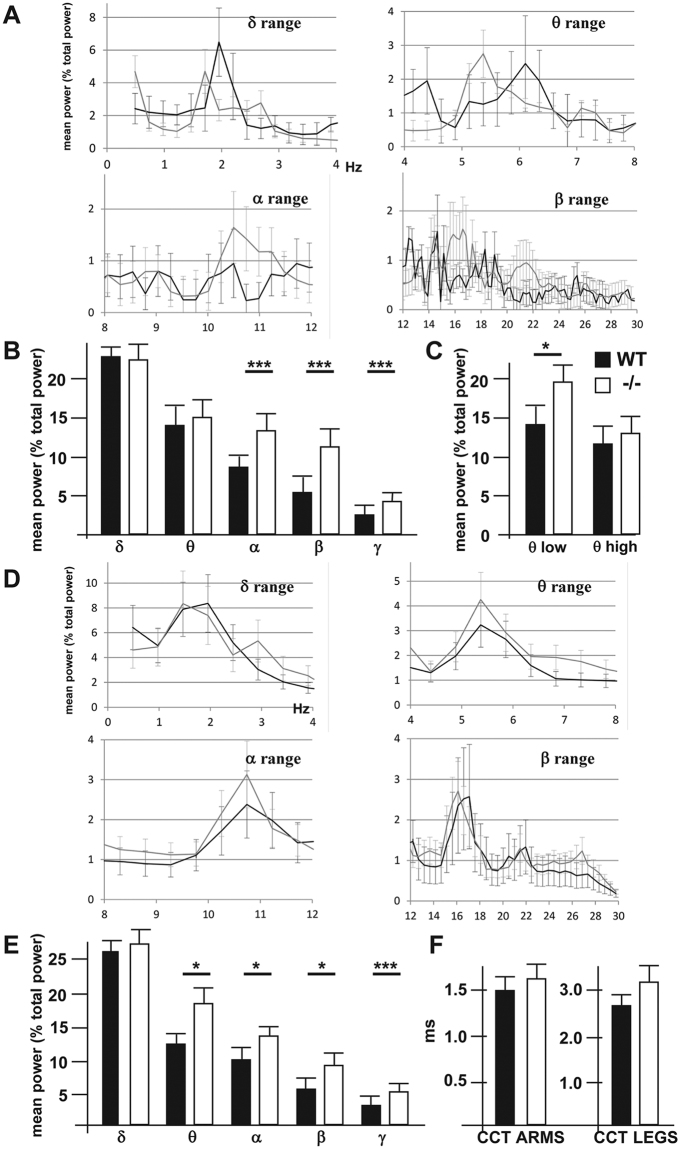
The small-GTPase Rac1 is a key molecular regulator linking extracellular signals to actin cytoskeleton dynamics. Loss-of-function mutations in RAC1 and other genes of the Rac signaling pathway have been implicated in the pathogenesis of Intellectual Disability (ID). The Rac1 activity is negatively controlled by GAP proteins, however the effect of Rac1 hyperactivity on neuronal networking in vivo has been poorly studied. ArhGAP15 is a Rac-specific negative regulator, expressed in the main subtypes of pyramidal cortical neurons. In the absence of ArhGAP15, cortical pyramidal neurons show defective neuritogenesis, delayed axonal elongation, reduced dendritic branching, both in vitro and in vivo. These phenotypes are associated with altered actin dynamics at the growth cone due to increased activity of the PAK-LIMK pathway and hyperphosphorylation of ADF/cofilin. These results can be explained by shootin1 hypo-phosphorylation and uncoupling with the adhesion system. Functionally, ArhGAP15-/- mice exhibit decreased synaptic density, altered electroencephalographic rhythms and cognitive deficits. These data suggest that both hypo- and hyperactivation of the Rac pathway due to mutations in Rac1 regulators can result in conditions of ID, and that a tight regulation of Rac1 activity is required to attain the full complexity of the cortical networks.


Conflict of interest statement

The authors declare no competing interests.

Figures

Figure 1
Figure 1
Expression of ArhGAP15 in early postnatal and adult mouse brain. (A,B) Xgal staining of coronal sections of the ArhGAP15+/− brain, at postnatal day 1 (P1). In (A), low magnification; in (B), a higher magnification of the somatosensory area. Cortical layers are indicated on the right. Signal is detected mainly in layer V. Scale bar in B = 60 μm. (CG) Immunostaining of the somatosensory cortex of ArhGAP15+/− brains, at P1, with anti-βgal (e.g. ArhGAP15, green cytoplasmic stain) and either Ctip2 (C,D,E, red nuclear fluorescence), Cux1 (F, white nuclear stain) or Tbr1 (G, red nuclear stain) pyramidal markers. In (D) and (E), higher magnification from the image in (C). Double-stained neurons were observed only with Ctip2 (CE), indicated with white arrows. Scale bars in C,F,G = 50 μm, bar in D,E = 20 μm. (H) RNA::RNA in situ hybridization to detect the ArhGAP15 mRNA in coronal sections of the somatosensory cortex of young adult (P60) WT animals. Scale bar = 50 μm. (I) Xgal staining of coronal sections of the somatosensory cortex from ArhGAP15+/− P60 animals. Scale bar = 60 μm. (J–N) Characterization of βgal-expressing (green cytoplasmic staining) pyramidal neurons in ArhGAP15+/− brains at the age P45, by double immunostaining with the layer-specific markers Ctip2 (red nuclear staining), Cux1 (white nuclear staining) and Tbr1 (red nuclear staining). (J and M) show low magnification images, with cortical layers indicated on the right. K,L and N show higher magnifications from the images on the left. Double-positive cells are indicated with white arrows. (O) Percentages of Ctip2-, Cux1- and Tbr1-positive pyramidal neurons that stain double-positive for βgal, at P1 (solid bars) and P45 (open bars). Quantification was done by section. Scale bars in J,M = 50 μm, bar in K,L,N = 10 μm. Data are presented as mean ± SEM.
Figure 2
Figure 2
Genesis and organization of cortical pyramidal neurons in ArhGAP15−/− mice. (A) Representative micrographs of EdU tracing of cortical neurons in WT (left) and ArhGAP15−/− (right) cortices, examined at birth. Embryos were injected with EdU at the age E14.5. No difference in the number and position of EdU+ neurons is detected. (BD) Representative micrographs of immunostaining of WT and ArhGAP15−/− cortices, at birth, for Tbr1 (B) and for Satb2 (C). The merged image (DAPI, EdU+, Tbr2+, Satb2+) is shown in panel D. The subdivision in 10 BINs is reported in panel D. No differences in the number and position of the stained neurons were detected. Scale bar in A = 20 μm.
Figure 3
Figure 3
Loss of ArhGAP15 affects neuronal morphology and neuritogenesis of cortical pyramidal neurons. (A) Relative proportion of unipolar, bipolar and multipolar neurons in primary cultures obtained from WT (solid bars) or ArhGAP15−/− (open bars) embryonic cortices. Cells were electroporated with a PGK-GFP vector prior to plating, and examined after 3 DIV. In the absence of ArhGAP15, the number of bipolar neurons is significantly decreased, while the number of unipolar neurons is increased. Results are expressed as percentage over the total number of cells counted (minimum 150). (B) Multipolar neurons were further scored for the number of neurites (on the right), and in the absence of ArhGAP15 neurons show a significantly decreased number of average neurites. (C,D) Representative micrographs of cortical neurons in primary culture from WT (left) or ArhGAP15−/− (right) animals. Cells were transfected with a PGK-GFP vector prior to plating, and examined after 3 DIV. Only cells with a pyramidal morphology were considered (>90% of all neurons). Scale bar in C = 20 μm. (E) Quantification of the length of the longest neurite, of the number of branches (secondary neurites) and of the overall complexity of arborization (Sholl analysis) in neurons from WT (solid bars) and ArhGAP15−/− (open bars) cortices. (F,H) Representative micrographs of DiI labelled cortical pyramidal neurons from WT (F) and ArhGAP15−/− (H) animals at P2. (G,I) Examples of reconstructed DiI labelled cortical pyramidal neurons from WT (G) and ArhGAP15−/− (I) animals at P2. (J) Quantification of the length of the axon, of the dendrites and of the apical dendrites in DiI labelled cortical pyramidal neurons from WT (solid bars) and ArhGAP15−/− (open bars) animals at P2. (K) Sholl analysis of the axon (left) and dendritic complexity (right) revealed a significant reduction in the arborization of cortical pyramidal neurons from ArhGAP15−/− animals. Data are presented as mean ± SEM. **P ≤ 0.01, ***P ≤ 0.001 (Student’s t-test).
Figure 4
Figure 4
Loss of ArhGAP15 affects the length and targeting of pyramidal callosal commissural axons in vivo. (AD) Representative images of DiI-labeled callosal projection of WT (A,C) and ArhGAP15−/− (B,D) P2 brains, for tracing analyses. Low magnification images are shown on the top, while the box inserts indicate the area shown at a higher magnification, on the bottom. (E) Quantification of the F.I. *thickness of the callosal bundle, normalized against the F.I. *thickness at the midline (indicated in panels A and B with dashed lines), as a function of the distance from the midline. 7 and 12 sections were examined for, respectively, the WT and ArhGAP15 mutant genotypes, from at least 3 independent brains in both cases. (F) Average length from the midline, in mm, of the 5 longest DiI-labelled callosal axons, in WT (solid bars, N = 7) or ArhGAP15−/− (open bars, N = 12) brain slices. (GJ) Representative images of BDA-labeled callosal projections of WT (G,I) and ArhGAP15−/− (H,J) P45 brains, for tracing analyses. Images on the top are at low magnification, to show the injection site, the callosal projections, and the midline (reported in panels G and H with dashed lines). Images on the bottom are higher magnification of the inset indicated in the images on the top. Scale bars in A and G = 200 μm, bars in C and I = 20 μm. (K) Quantification of axonal length, as in panel E except that F.I. was substituted with S.I. (staining intensity). No difference was observed at this age. 7 and 8 comparable sections of the WT and ArhGAP15−/− animals were examined, respectively, deriving from 3 brains of each genotype. Data are presented as mean ± SEM. *P ≤ 0.05, **P ≤ 0.01 (Mann-Whitney test).
Figure 5
Figure 5
Loss of ArhGAP15 alters actin dynamics at the axonal growth cone, associated to increased activity of the PAK-LIMK-ADF/Cofilin pathway. (A) Quantification of retrograde and anterograde actin filament extension in neurons dissociated from WT or ArhGAP15−/− cortices, at E15.5. While anterograde extension is unchanged, in the absence of ArhGAP15 retrograde actin extension is increased. (B) Quantification of the area of the growth cones. The average area is unchanged. N corresponds to the number of neurons analyzed for, respectively, the WT and ArhGAP15 mutant genotypes, from at least three independent cell cultures. (C) Western blot analyses of ADF/cofilin and phospho-ADF/cofilin in total extracts of WT and ArhGAP15−/− cortices, at P2. The signal relative to GAPDH is used as loading control and subsequent normalization. On the right, quantification of the ratio of phospho-ADF/cofilin over the amount of total ADF/cofilin and phospho-ADF/cofilin, corrected for GAPDH expression. The WT is placed = 1. (D) Western blot analyses of phospho-PAK1-3, phospho-LIMK1/2, phospho-SSHL1 and phospho-shootin1 in total extracts of WT and ArhGAP15−/− cortices, at P2. The signal relative to GAPDH is used as loading control and subsequent normalization. On the right, quantification of the ratio of phospho-PAK1-3, phospho-LIMK1/2, phospho-SSHL1 and phospho-shootin1 corrected for GAPDH expression. The WT is considered = 1. Full-length blots are presented in Supplementary Figure S4. Data are presented as mean ± SEM. *P ≤ 0.05 (Student’s t-test).
Figure 6
Figure 6
Synapses and electrophysiology of pyramidal neurons in ArhGAP15−/− mice. (AD) Representative images of excitatory and inhibitory synapses on the soma of pyramidal neurons in the somatosensory cortex of WT (A,B) and ArhGAP15−/− (C,D) brains, at P45. Sections were immunostained for VGAT (left panels, red fluorescence) or for VGLUT (right panels, red fluorescence). Nuclei were counterstained with DAPI. Scale bar in A = 2 μm. (E,F) Average number of VGAT+ (E) and VGLUT (F) punctae per surface of neuronal soma. WT, solid bars, ArhGAP15−/−, open bars. The density of VGAT+ punctae is significantly decreased in the mutant cortex. Asterisks indicate statistical significance (p < 0.01). (GO) Electrophysiology of cortical pyramidal neurons. Slices of the somatosensory cortex from WT (open bars) or ArhGAP15−/− (solid black bars) animals, at P100, were used for recordings. At least 30 neurons were examined per slice. (G–J) Passive electrical properties, including the capacitance (G), the resistence to input current (H), the resting potential (I) and the current/voltage ratio (J). No differences are observed between the two genotypes. (KN) Active electrical properties including the threshold to action potentials (APs) (K), the minimal current intensity to induce APs (L), the frequency of APs at various currents (200 pA) is shown in (M) and the AP/current ratio (N). We observe a significantly reduced threshold to APs and an increase frequency of APs at 200 pA. (O) Representative traces of WT (left) and ArhGAP15−/− (right) neurons. *indicates p < 0.05; ***indicates p < 0.001.
Figure 7
Figure 7
EEG recording from sleeping animals. (A) Power spectral profiles of WT (black line) and ArhGAP15−/− (grey line) animals, at P40. The power of the individual frequency band (1 Hz bins) was normalized by expressing it as % of total power (1–50 Hz for all epochs). (B) Averaged normalized power of each EEG band for WT (solid bars) and ArhGAP15−/− (open bars) animals, at the age P40. Significance is reported on the top. (C) Quantitative comparison of the θ activity, subdivided in θ-low and θ-high, for WT (solid bars) and ArhGAP15−/− (open bars) animals, at the age P40. (D) Power spectral profiles of WT (black line) and ArhGAP15−/− (grey line) animals, at P180. The power of the individual frequency band (1 Hz bins) was normalized by expressing it as % of total power (1–50 Hz for all epochs). (E) Same as in (B), recorded in WT and ArhGAP15−/− animals, at P180. (F) Central conductance of the brain-to-arm motoneuron path (left) and the brain-to-leg motoneuron path (right) in WT (solid bars) and ArhGAP15−/− (open bars) animals, at P45. No difference is detected. Data are presented as mean ± SEM. *P ≤ 0.05, ***P ≤ 0.001 (Student’s t-test).

Similar articles

Cited by

References

    1. Lelieveld, S. H. et al. Meta-analysis of 2,104 trios provides support for 10 new genes for intellectual disability. Nat. Neurosci. 10.1038/nn.4352 (2016). - PubMed
    1. Reijnders MRF, et al. RAC1 Missense Mutations in Developmental Disorders with Diverse Phenotypes. Am. J. Hum. Genet. 2017;101:466–477. doi: 10.1016/j.ajhg.2017.08.007. - DOI - PMC - PubMed
    1. Maglorius Renkilaraj MRL, et al. The intellectual disability protein PAK3 regulates oligodendrocyte precursor cell differentiation. Neurobiol. Dis. 2017;98:137–148. doi: 10.1016/j.nbd.2016.12.004. - DOI - PubMed
    1. Klein KM, et al. The phenotypic spectrum of ARHGEF9 includes intellectual disability, focal epilepsy and febrile seizures. J. Neurol. 2017;264:1421–1425. doi: 10.1007/s00415-017-8539-3. - DOI - PubMed
    1. Ramakers GJA, et al. Dysregulation of Rho GTPases in the αPix/Arhgef6 mouse model of X-linked intellectual disability is paralleled by impaired structural and synaptic plasticity and cognitive deficits. Hum. Mol. Genet. 2012;21:268–286. doi: 10.1093/hmg/ddr457. - DOI - PubMed

Publication types