

The lactose operon from Lactobacillus casei is involved in the transport and metabolism of the human milk oligosaccharide core-2 N-acetyllactosamine
- PMID: 29740087
- PMCID: PMC5940811
- DOI: 10.1038/s41598-018-25660-w
The lactose operon from Lactobacillus casei is involved in the transport and metabolism of the human milk oligosaccharide core-2 N-acetyllactosamine
Abstract
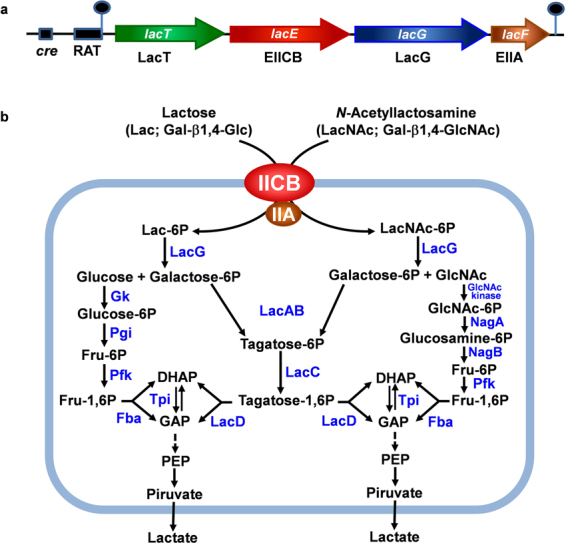
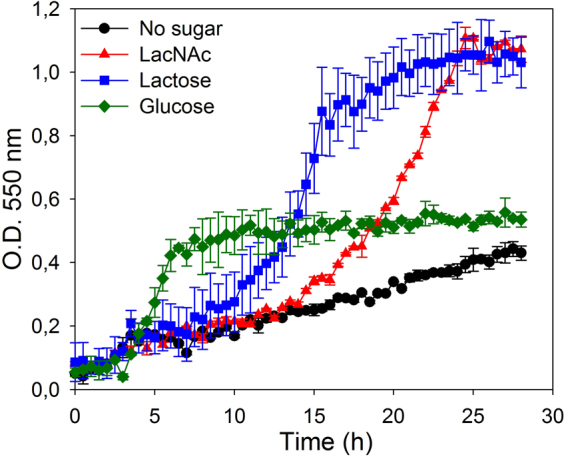
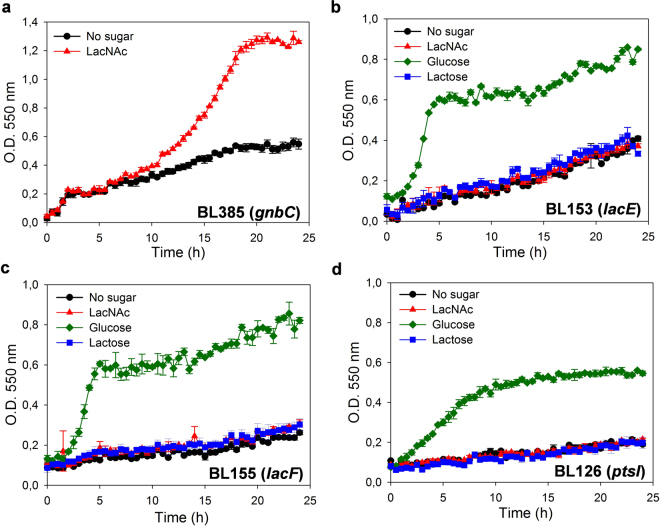
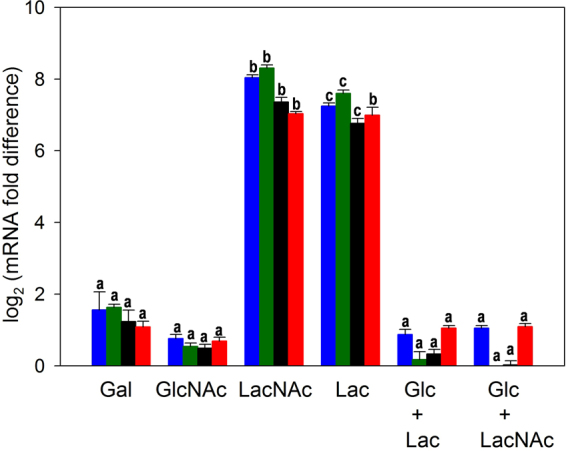
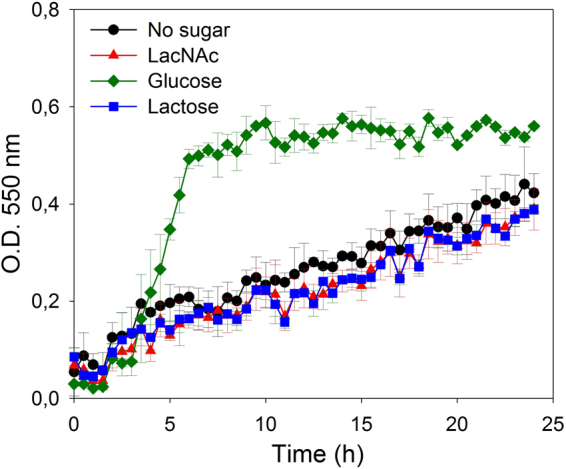
The lactose operon (lacTEGF) from Lactobacillus casei strain BL23 has been previously studied. The lacT gene codes for a transcriptional antiterminator, lacE and lacF for the lactose-specific phosphoenolpyruvate: phosphotransferase system (PTSLac) EIICB and EIIA domains, respectively, and lacG for the phospho-β-galactosidase. In this work, we have shown that L. casei is able to metabolize N-acetyllactosamine (LacNAc), a disaccharide present at human milk and intestinal mucosa. The mutant strains BL153 (lacE) and BL155 (lacF) were defective in LacNAc utilization, indicating that the EIICB and EIIA of the PTSLac are involved in the uptake of LacNAc in addition to lactose. Inactivation of lacG abolishes the growth of L. casei in both disaccharides and analysis of LacG activity showed a high selectivity toward phosphorylated compounds, suggesting that LacG is necessary for the hydrolysis of the intracellular phosphorylated lactose and LacNAc. L. casei (lacAB) strain deficient in galactose-6P isomerase showed a growth rate in lactose (0.0293 ± 0.0014 h-1) and in LacNAc (0.0307 ± 0.0009 h-1) significantly lower than the wild-type (0.1010 ± 0.0006 h-1 and 0.0522 ± 0.0005 h-1, respectively), indicating that their galactose moiety is catabolized through the tagatose-6P pathway. Transcriptional analysis showed induction levels of the lac genes ranged from 130 to 320-fold in LacNAc and from 100 to 200-fold in lactose, compared to cells growing in glucose.
Conflict of interest statement
The authors declare no competing interests.
Figures


Similar articles
-
Elements involved in catabolite repression and substrate induction of the lactose operon in Lactobacillus casei.J Bacteriol. 1999 Jul;181(13):3928-34. doi: 10.1128/JB.181.13.3928-3934.1999. J Bacteriol. 1999. PMID: 10383959 Free PMC article.
-
Regulation of lactose-phosphoenolpyruvate-dependent phosphotransferase system and beta-D-phosphogalactoside galactohydrolase activities in Lactobacillus casei.J Bacteriol. 1983 Jun;154(3):1195-203. doi: 10.1128/jb.154.3.1195-1203.1983. J Bacteriol. 1983. PMID: 6406426 Free PMC article.
-
A unique gene cluster for the utilization of the mucosal and human milk-associated glycans galacto-N-biose and lacto-N-biose in Lactobacillus casei.Mol Microbiol. 2014 Aug;93(3):521-38. doi: 10.1111/mmi.12678. Epub 2014 Jul 3. Mol Microbiol. 2014. PMID: 24942885
-
Molecular characterization of the plasmid-encoded lactose-PTS of Lactobacillus casei.FEMS Microbiol Rev. 1989 Jun;5(1-2):157-65. doi: 10.1016/0168-6445(89)90020-x. FEMS Microbiol Rev. 1989. PMID: 2517398 Review. No abstract available.
-
Genetics of lactose utilization in lactic acid bacteria.FEMS Microbiol Rev. 1994 Oct;15(2-3):217-37. doi: 10.1111/j.1574-6976.1994.tb00136.x. FEMS Microbiol Rev. 1994. PMID: 7946468 Review.
Cited by
-
The plasmid-encoded lactose operon plays a vital role in the acid production rate of Lacticaseibacillus casei during milk beverage fermentation.Front Microbiol. 2022 Oct 6;13:1016904. doi: 10.3389/fmicb.2022.1016904. eCollection 2022. Front Microbiol. 2022. PMID: 36386630 Free PMC article.
-
Infant-gut associated Bifidobacterium dentium strains utilize the galactose moiety and release lacto-N-triose from the human milk oligosaccharides lacto-N-tetraose and lacto-N-neotetraose.Sci Rep. 2021 Dec 2;11(1):23328. doi: 10.1038/s41598-021-02741-x. Sci Rep. 2021. PMID: 34857830 Free PMC article.
-
Plasmids encode niche-specific traits in Lactobacillaceae.Microb Genom. 2021 Mar;7(3):mgen000472. doi: 10.1099/mgen.0.000472. Epub 2020 Nov 9. Microb Genom. 2021. PMID: 33166245 Free PMC article.
-
Unique Microbial Catabolic Pathway for the Human Core N-Glycan Constituent Fucosyl-α-1,6-N-Acetylglucosamine-Asparagine.mBio. 2020 Jan 14;11(1):e02804-19. doi: 10.1128/mBio.02804-19. mBio. 2020. PMID: 31937642 Free PMC article.
-
Hybrid de novo Genome Assembly of Erwinia sp. E602 and Bioinformatic Analysis Characterized a New Plasmid-Borne lac Operon Under Positive Selection.Front Microbiol. 2021 Nov 11;12:783195. doi: 10.3389/fmicb.2021.783195. eCollection 2021. Front Microbiol. 2021. PMID: 34858382 Free PMC article.
References
-
- Balogh R, Jankovics P, Beni S. Qualitative and quantitative analysis of N-acetyllactosamine and lacto-N-biose, the two major building blocks of human milk oligosaccharides in human milk samples by high-performance liquid chromatography-tandem mass spectrometry using a porous graphitic carbon column. J Chromatogr A. 2015;1422:140–146. doi: 10.1016/j.chroma.2015.10.006. - DOI - PubMed
-
- Stanley, P. & Cummings, R. D. In Essentials of Glycobiology (eds Varki, A. et al.) (2009). - PubMed
Publication types
MeSH terms
Substances
LinkOut - more resources
Full Text Sources
Other Literature Sources
Molecular Biology Databases
